There are large racial differences in the homicide rates in the United States. The FBI and other government organizations are not always forthcoming with detailed data, but you can quite readily estimate it (approximately) with the victimization/mortality data from the CDC and other sources (most crimes being committed intra-racially)

The black homicide rate is about 10 times higher than the white rate. It has been this way for quite some time (i.e., even as the rates have changed the differences themselves have remained fairly stable).
Similar patterns can be found elsewhere, but I find the homicide statistic useful and interesting for many different reasons, namely:
- it is hard to sweep it under the rug statistically or otherwise distort (e.g., under-reporting, misattribution, etc)
- it is a good bellwether for broader differences in social conditions.
- the statistics are readily available
- it demonstrates the limited power of mechanistic economic explanations and that even large residuals associated with race/ethnicity are not necessarily the product of “racism” on the part of police, teachers, etc.
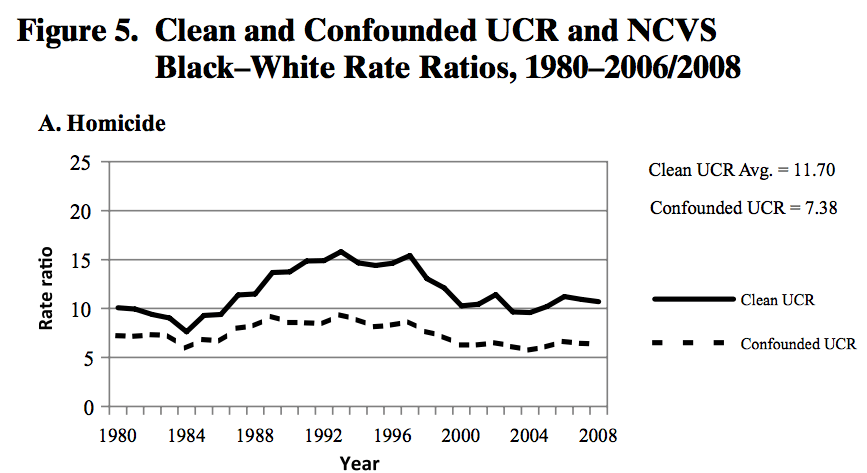
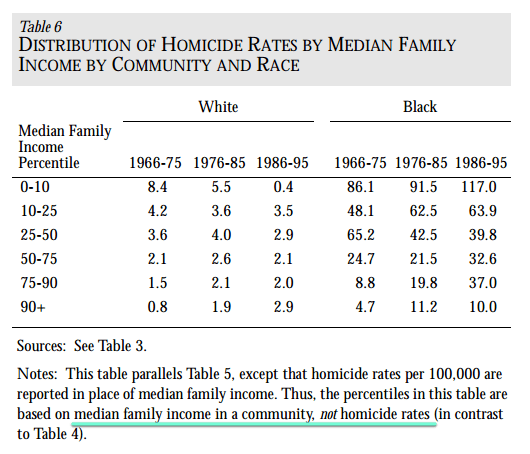
There are, of course, many progressives today that will claim that black-on-black crime is a “myth” or that these differences are fairly modest and can be explained mostly by stuff like poverty. This despite decades old scholarship from some progressive-minded people:
Despite these facts, the discussion of race and crime is n-tired in an unproductive mix of controversy and silence. At the same time that articles on age and gender abound, criminologists are loath to speak openly on race and crime for fear of being misunderstood or labeled racist. This situation is not unique, for until recently scholars of urban poverty also consciously avoided discussion of race and social dislocations in the inner city lest theybe accused of blaming the victim (see W. J. Wilson 1987). And when the topic is broached, criminologists have reduced the race-crime debate to simplistic arguments about culture versus social structure. On the one side, structuralists argue for the primacy of “relative deprivation” to understand black crime (e.g., Blau and Blau 1982), even though the evidence on social class and crime is weak at best. On the other side, cultural theorists tend to focus on an indigenous culture of violence in black ghettos (e. g., Wolfgang and Ferracuti 1967), even though the evidence there is weak too.
Still others engage in subterfuge, denying race-related differentials in violence and focusing instead on police bias and the alleged invalidity of official crime statistics (e.g., Stark 1990). This in spite of evidence not only from death records but also from survey reports showing that blacks are disproportionately victimized by and involved in, criminal violence (Hindelang 1976,1978). Hence, much like the silence on race and inner-city social dislocations engendered by the vociferous attacks on the Moynihan Report in the 1960’s, criminologists have, with few exceptions (e.g., Hawkins 1986; Hindelang 1978; Katz 1988), abdicated serious scholarly debate on race and crime.
Or, more recently, analysis conducted by others:
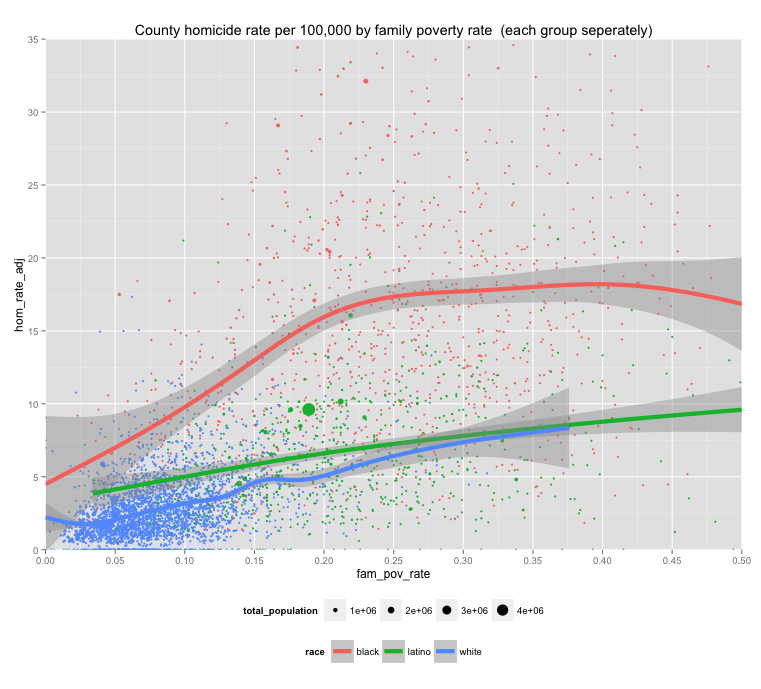
Given the intense focus recently on “concentrated poverty” and segregation I decided to take a more in-depth look at this data for myself. I downloaded the CDC mortality data by county (2004-2013) and cross-referenced that with the Census ACS data by county (2010). I analyzed the data collectively (assessing the impact of % of each racial group and other covariates on the overall homicide rate within a county) and separately, disaggregated by race/ethnicity (assessing the determinants of each groups’ homicide rate with their own ACS county-level estimates). Although analyzing data at a county level isn’t as good as more granular levels of analysis in some respects, the way I see it is that even if each group is heavily segregated the controls should allow us to do a pretty good job of estimating these effects (especially when comparing each groups’ homicide rate to their own poverty rates and the like)..
Analysis of the combined data
Race is a strong predictor of homicide rates at a county level.

It predicts better than the poverty rate, median household income, racial segregation, income segregation, education rates, and so on and so forth.

The single-motherhood rate is a close second though.
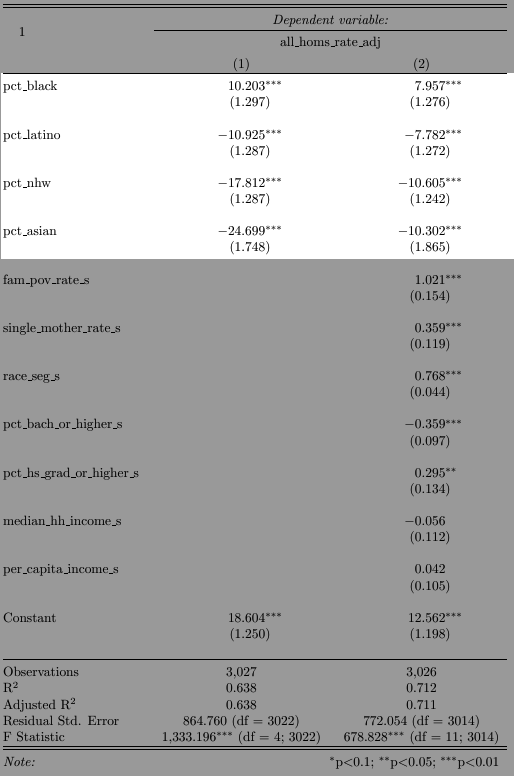
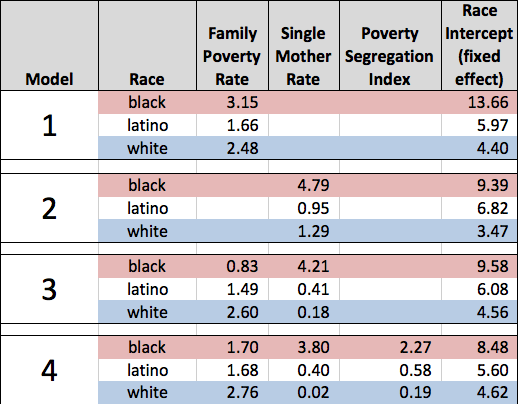
In the linear multi-regression models below I scaled all variables in standard deviation (SD) units to make it easier to compare their relative magnitude.
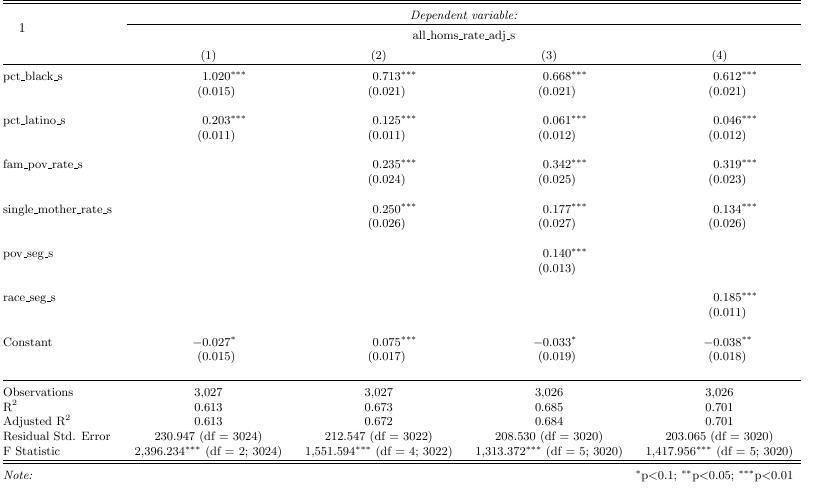
As you can see in model (1) a one standard deviation increase in percent black corresponds to a bit more than a one standard deviation increase in the county homicide rate. Controlling for the poverty rate, single-motherhood rate, and racial segregation rate, as we see in model (4), reduces the association with black to about 0.6 SD.
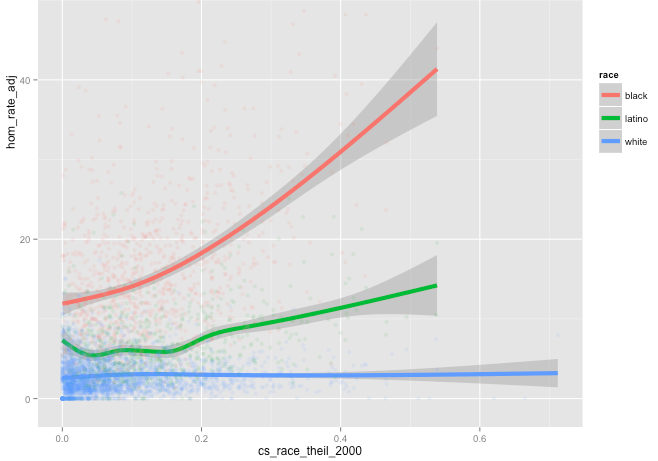
Curiously a 1 SD increase in the Theil racial segregation index is associated with a ~0.18 SD increase in the homicide rate, which is non-trivial, though perhaps less than some might expect. I am not convinced that segregation itself actually causes increased violence because it’s likely that increased violence and crime actually spurs further racial segregation, i.e., the arrow of causation likely runs substantially in the other direction (though I wouldn’t necessarily deny the potential for co-causality/feedback loops here). You might also note this (standardized) coefficient is roughly of the same scale as the coefficients for single-motherhood and poverty segregation. It’s also appreciably less than the association with poverty.


Even in modestly racially segregated counties percent black remains a very strong predictor of homicide rates.
Below are the regression results with and without controls keeping the dependent variable and race/ethnicity unscaled to make comparison across groups easier.
In model 1 transitioning from a 100% white to 100% black county increases the expected homicide rate by ~28 homicides per 100,000 people per year whereas the change in the expected outcome is “only” ~18.5 in model 2 with extensive controls (keep in mind that the average homicide rate in N/W Europe is 1.0-1.5 per 100,000). This implies that controlling for an extensive set of covariates (in a linear model) only reduces the expected homicide rate differential by ~35%.
Race remains an exceptionally strong predictor and this cannot be explained plausibly by racism/bias in reporting, prosecution, etc because this measure (which is derived from coroner reports) removes that sort of thing from the equation entirely.
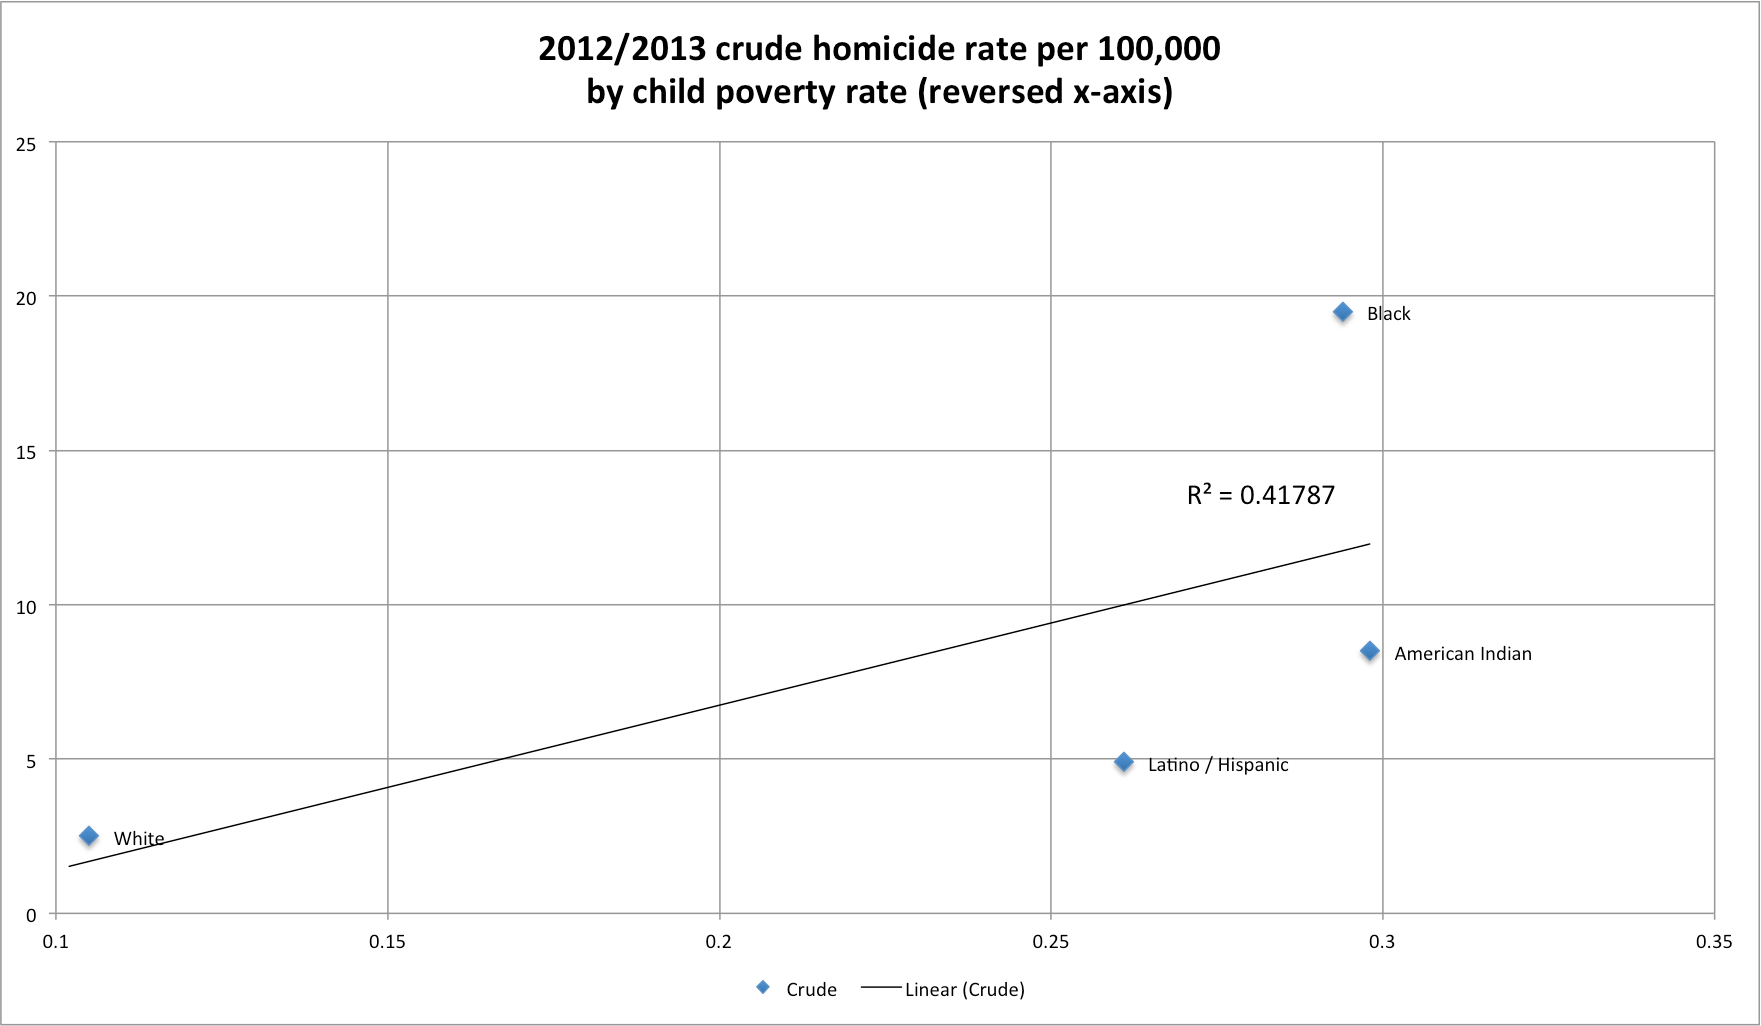
Poverty rates seem to be a strong predictor and was traditionally, in popular imagination, the go-to explanation for crime rate differences, so let’s take a brief look at that.


Although it’s clear that poverty predicts homicide quite independently of black, it’s also clear that black predicts independently of the poverty. Moreover, if you look closely at the distribution and other analysis I present here it’ll be clear that poverty doesn’t come close to closing these racial differences.
Single-motherhood is also a strong predictor.


Although the data are somewhat noisy and single-motherhood is quite strongly associated with the black population (r=0.76 at the county level), it seems to me that:
- there is a non-linear relationship between single-motherhood and homicide (which may be throwing off the linear model estimates somewhat)
- counties with very high rates of single-motherhood have very high homicide rates even with negligible black populations
- blacker counties with low-rates of single-motherhood seem to have homicide rates much closer to the national average (the same cannot be said for other covariates)
Based on the other evidence I have seen, I have come to view the single-motherhood being at least a very strong proxy for community health is and, in many respects, a stronger predictor of inter-racial differences than other measures like poverty rates. It does not entirely explain the observed racial differences here, but it mediates much of the relationship and does so more effectively than other common measures.
Controlling for single-motherhood rates with an unweighted loess regression I find little evidence to suggest that percent black adds much in the way of predictive validity.

Whereas if I invert this, I do indeed find that single-motherhood rates have some incremental power over and above percent black.

Obviously these two measures are well correlated, so it might be helpful to see counties with unexpectedly high or low rates of single-motherhood given their black population share….
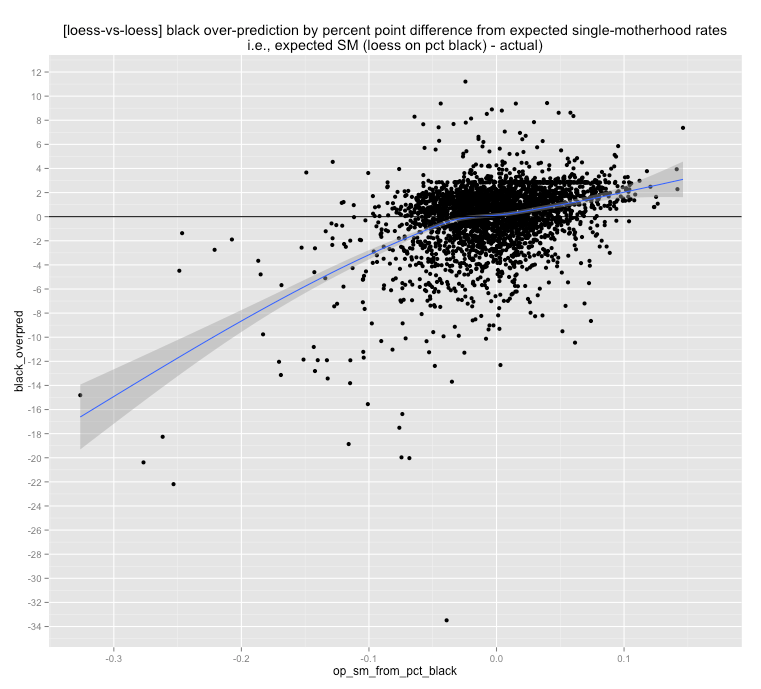
Counties with higher than expected rates of single-motherhood given their black population (negative on x-axis) have much higher than expected homicide rates given their black population (negative on y-axis).
If I flip this around:
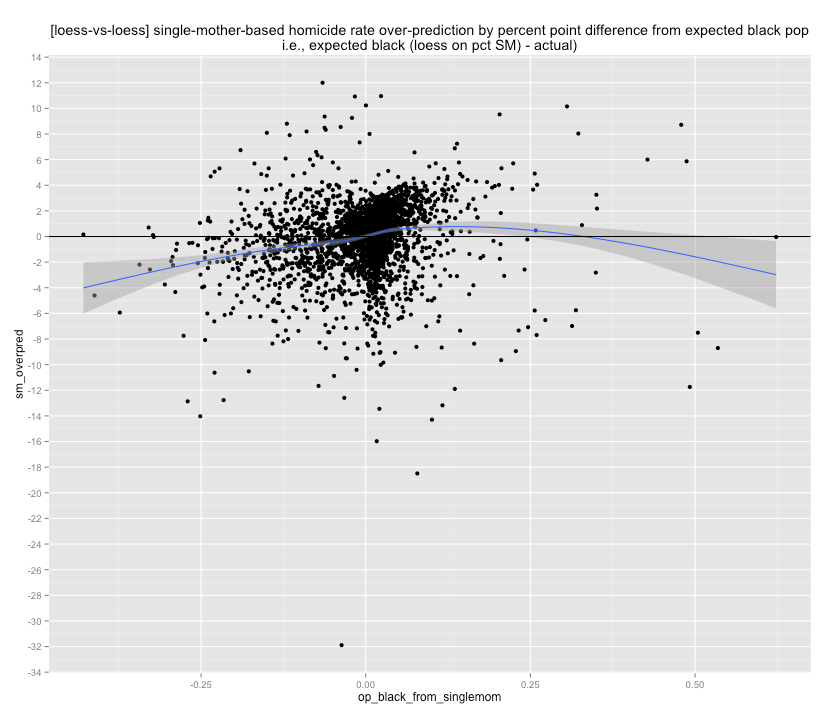
I find a modest association in counties with higher than expected black populations based on their single-motherhood rates, but it’s much weaker than the above relationship.
Likewise, single-motherhood has incremental power, even accounting for poverty rates.

whereas the same is much less true in the reverse.

Like I did above with percent black and single-motherhood rates, if I look at the homicide residuals (over-predictions) on single-motherhood and poverty rates by deviations from expected poverty rates (as a function of single-motherhood) or single-motherhood rates (as a function of poverty rates), I generally find single-motherhood to be much more influential.


Counties with much higher than expected rates of single-motherhood (negative on x-axis) given the poverty rate, have much higher than expected homicide rates (negative on y-axis).
Of course black(er) counties systematically deviate along these lines.

At any given income level, black communities tend towards substantially higher average rates of single-motherhood (which, incidentally, contributes significantly differences in poverty rates as this data is reported).
Obviously this analysis is not exhaustive, but it certainly tends to support my view that single-motherhood is a strong predictor and that it not well explained by percent black or poverty rates.
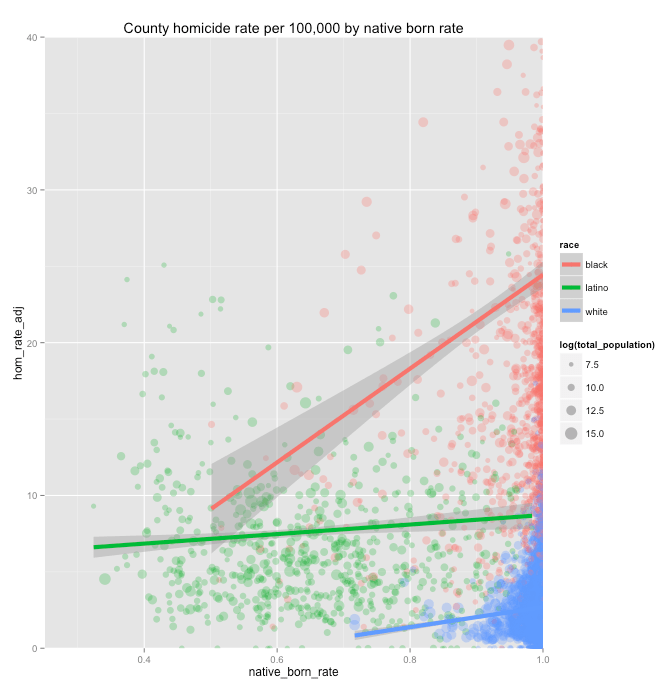
Analysis of racially disaggregated data
Besides the analysis above whereby I rely on multiple regressions to estimate the racial associations and the like from the aggregated data (all racial groups combined into single statistics), I also downloaded and analyzed racially disaggregated data for homicide rates and census demographic statistics (note: I exclude asians and pacific islanders from this part of the analysis because census and CDC aggregate this data differently and I didn’t feel like attempt to re-weight the census data to re-constitute their hybrid asian/pacific islander group).
The advantage of this approach is that even if every group is well segregated the income and SES-related statistics ought to do a pretty good job of describing the state of each community economically (unlike doing this analysis with racially aggregated data where we should probably expect blacks and latinos to have lower average income than county-wide statistics would suggest)
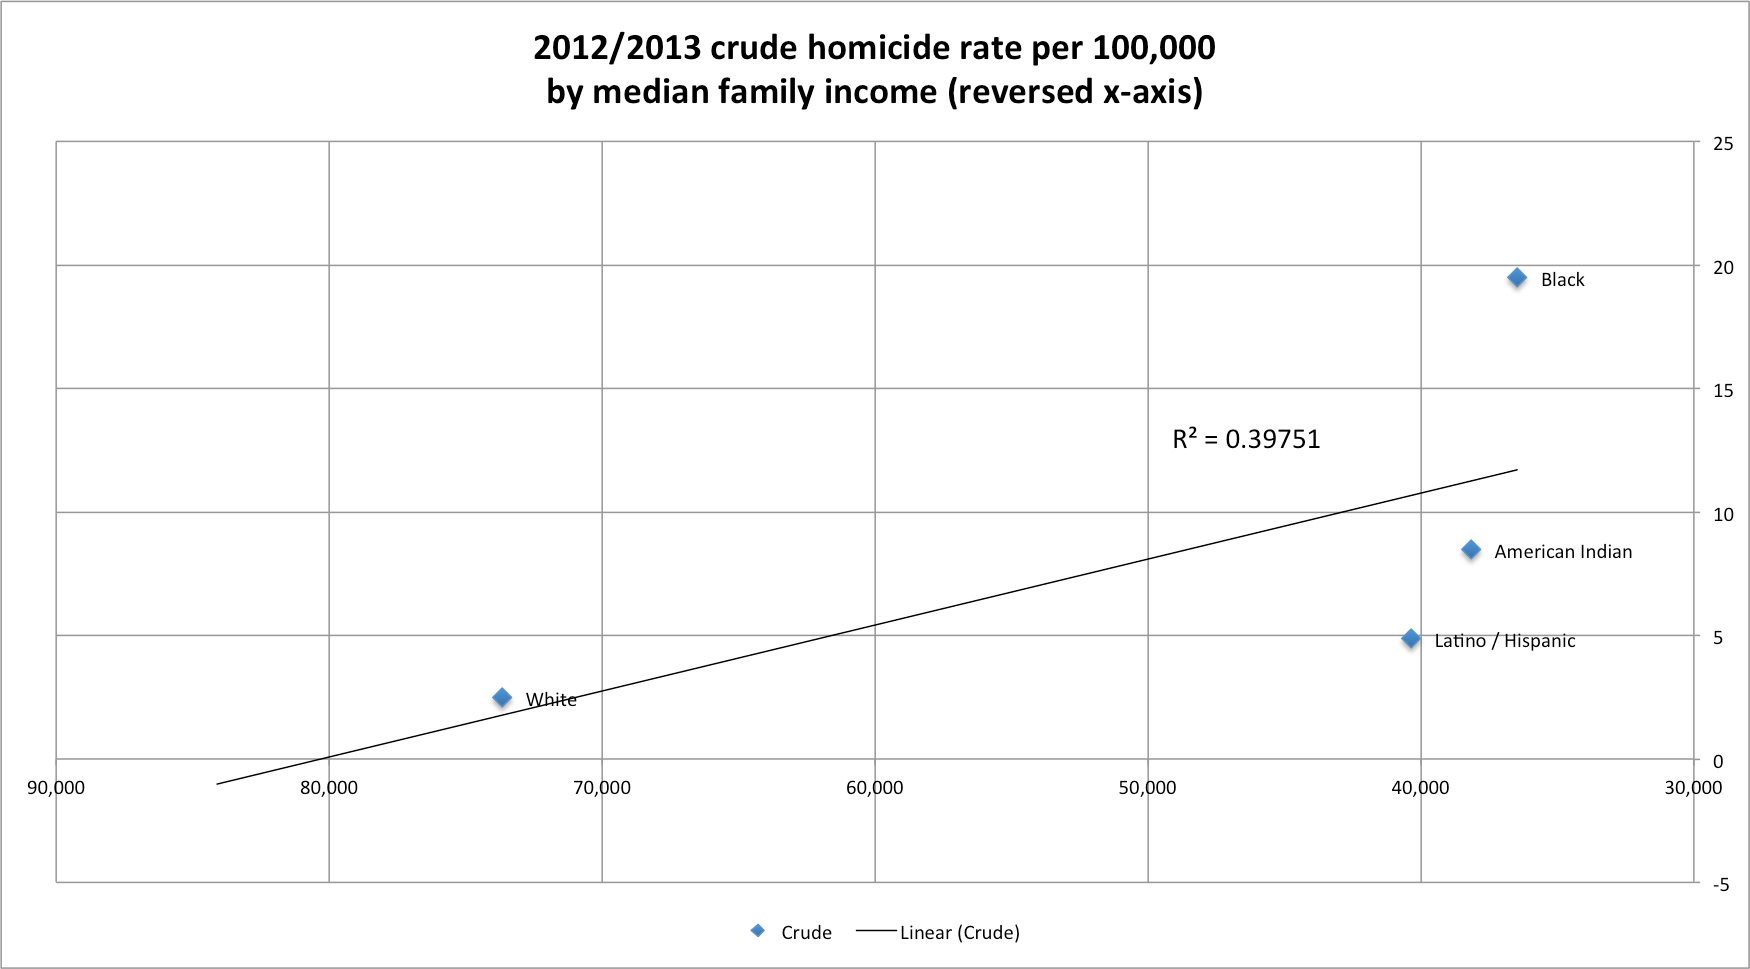
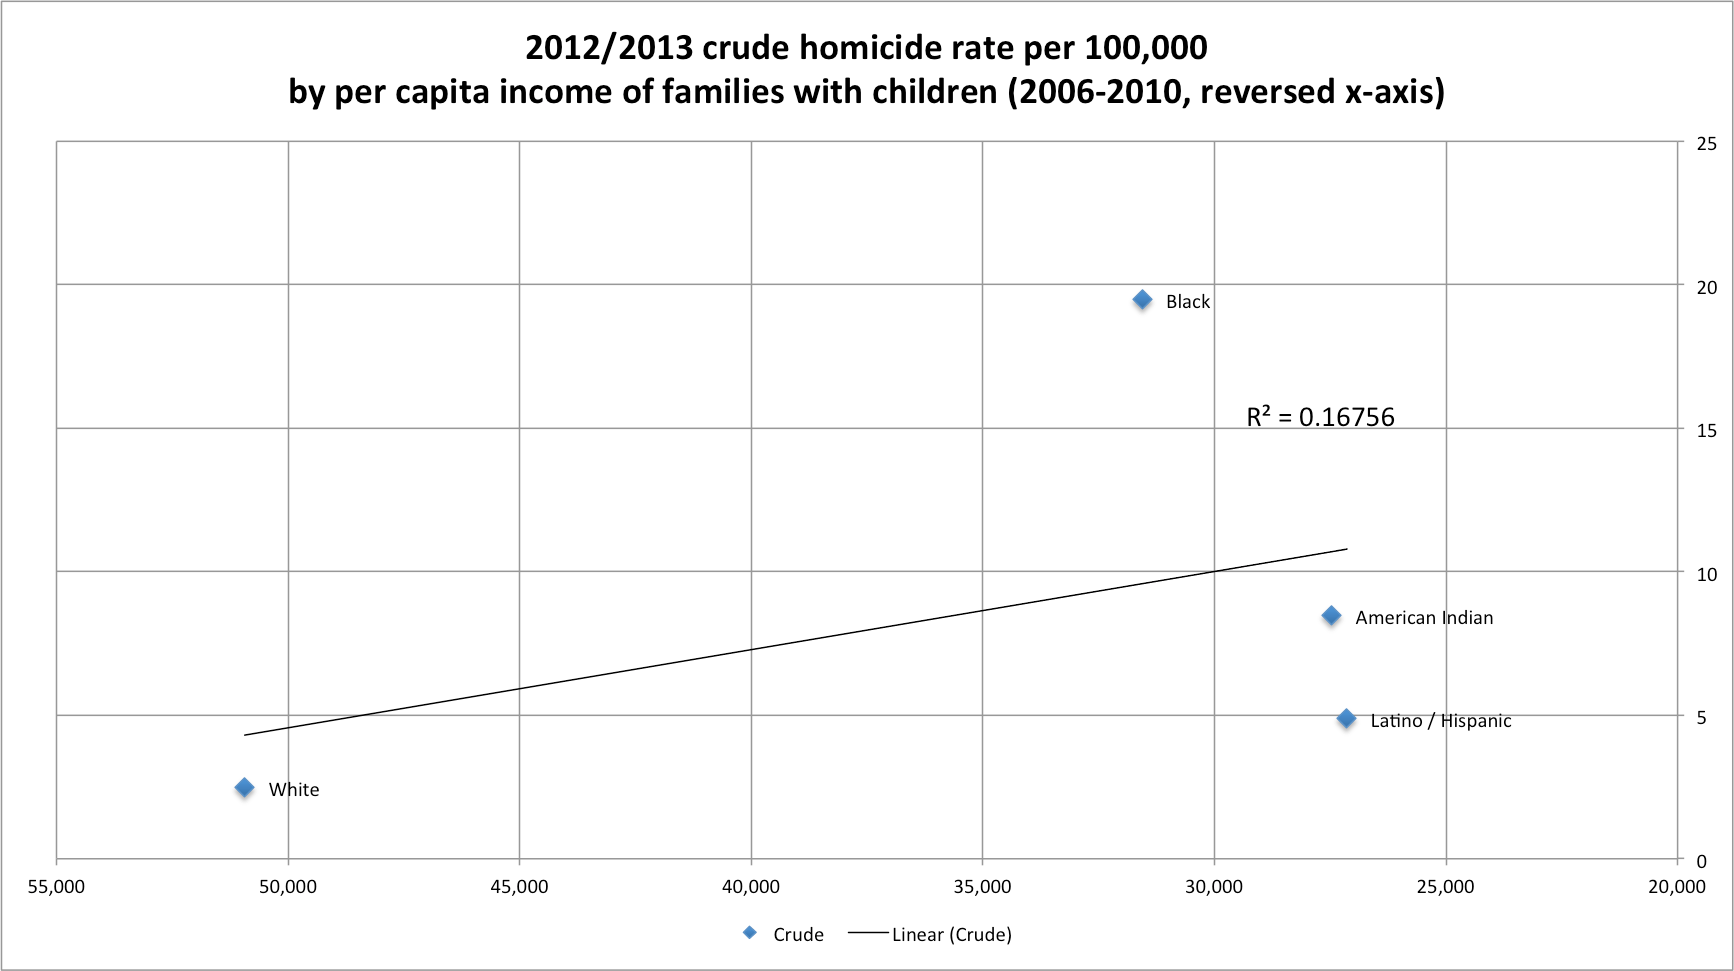
Economic statistics


By now I think it should be pretty clear that the economic conditions of each group are not particularly strong predictors of their victimization rates and that they certainly don’t come close to closing the white-black gap. Even poor “white” counties have homicide rates quite a bit lower than affluent “black” counties with low poverty rates.
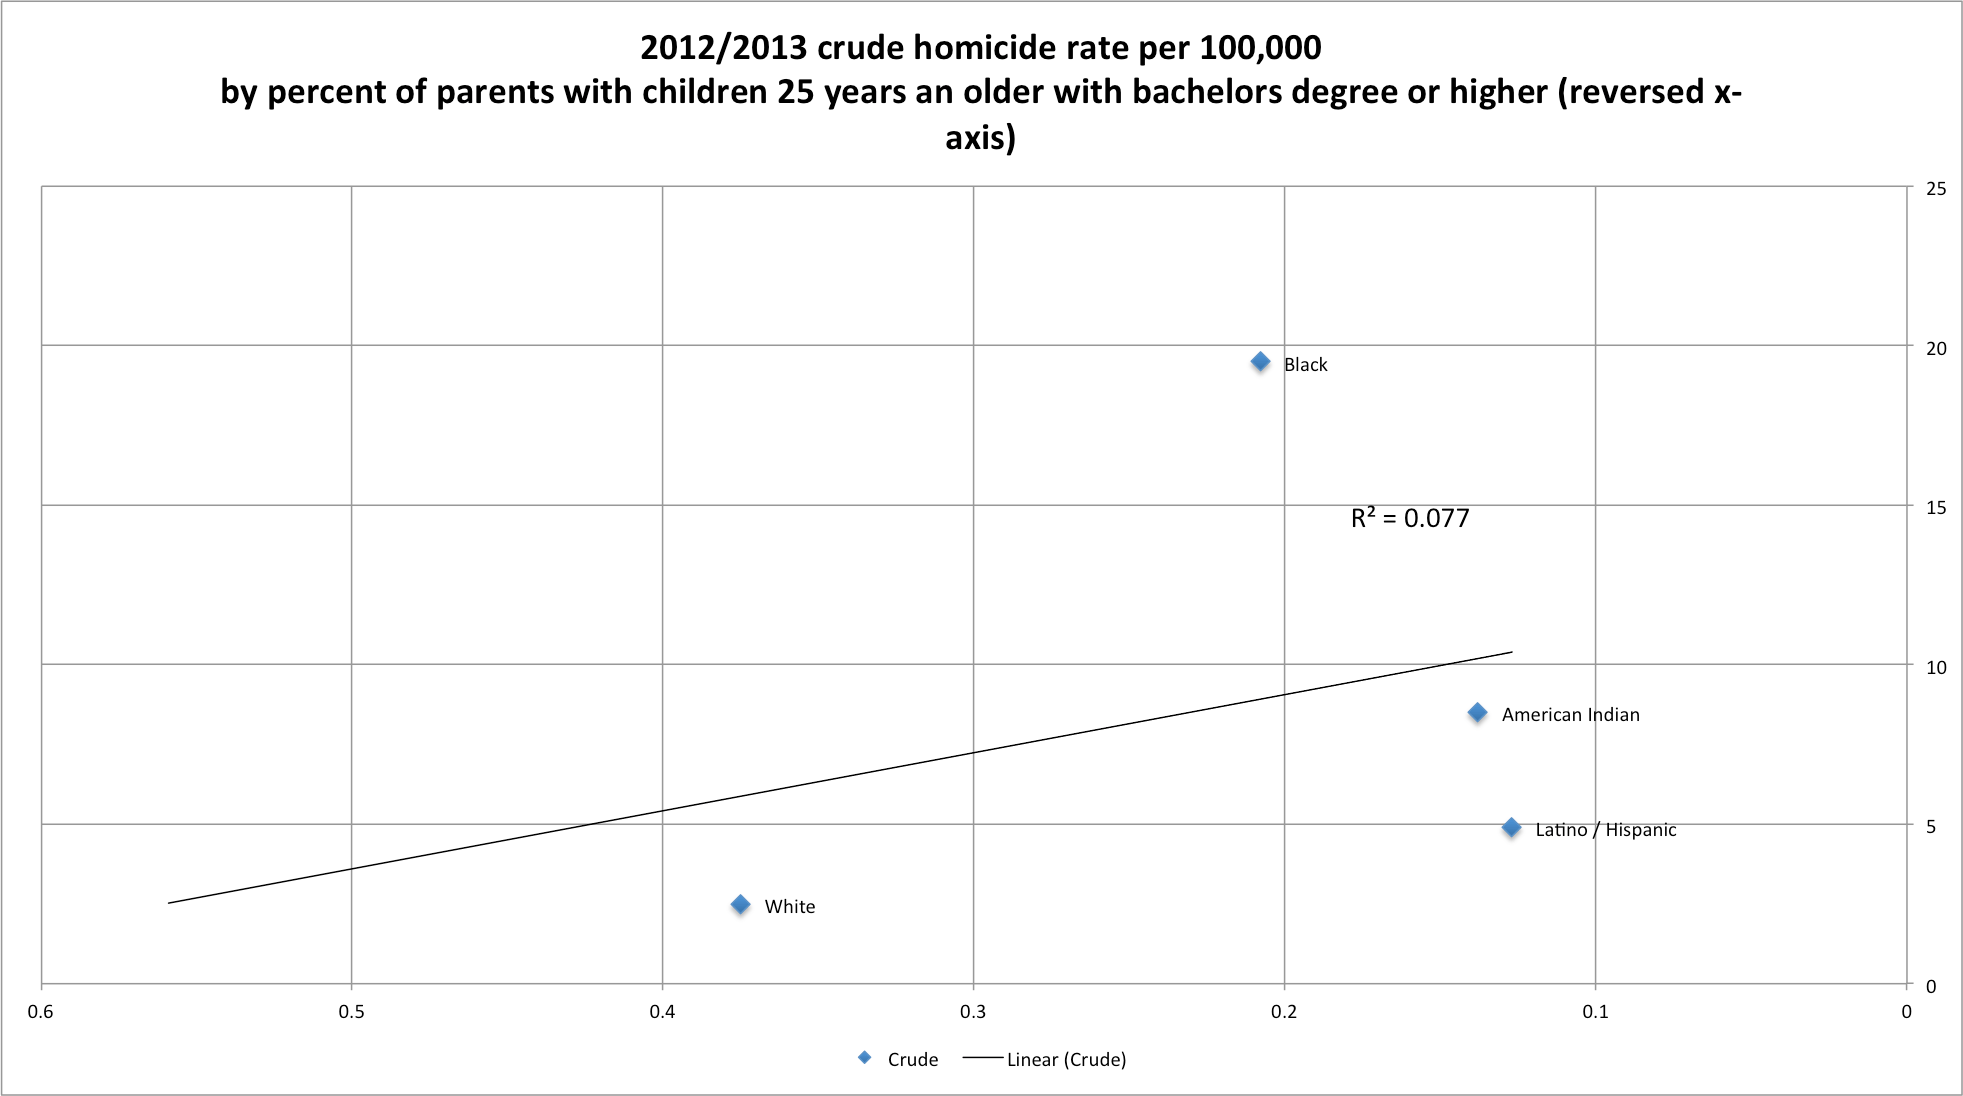
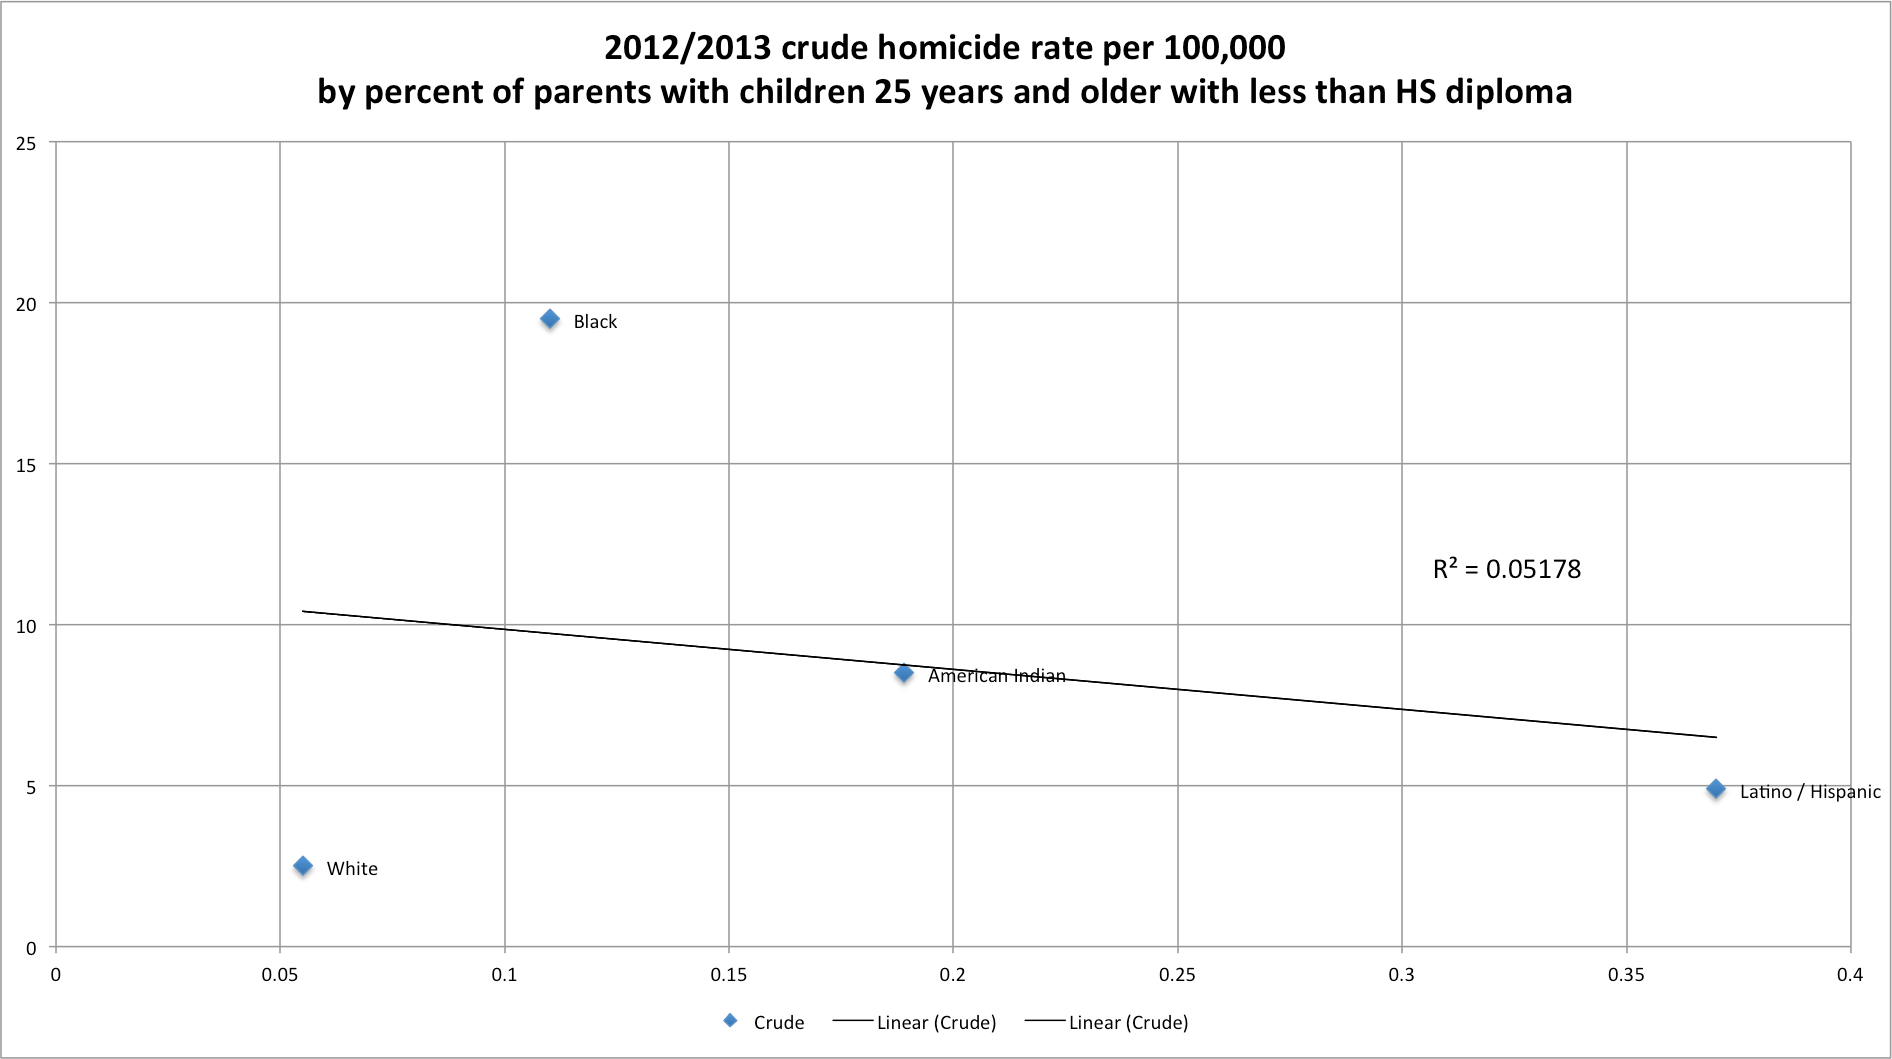
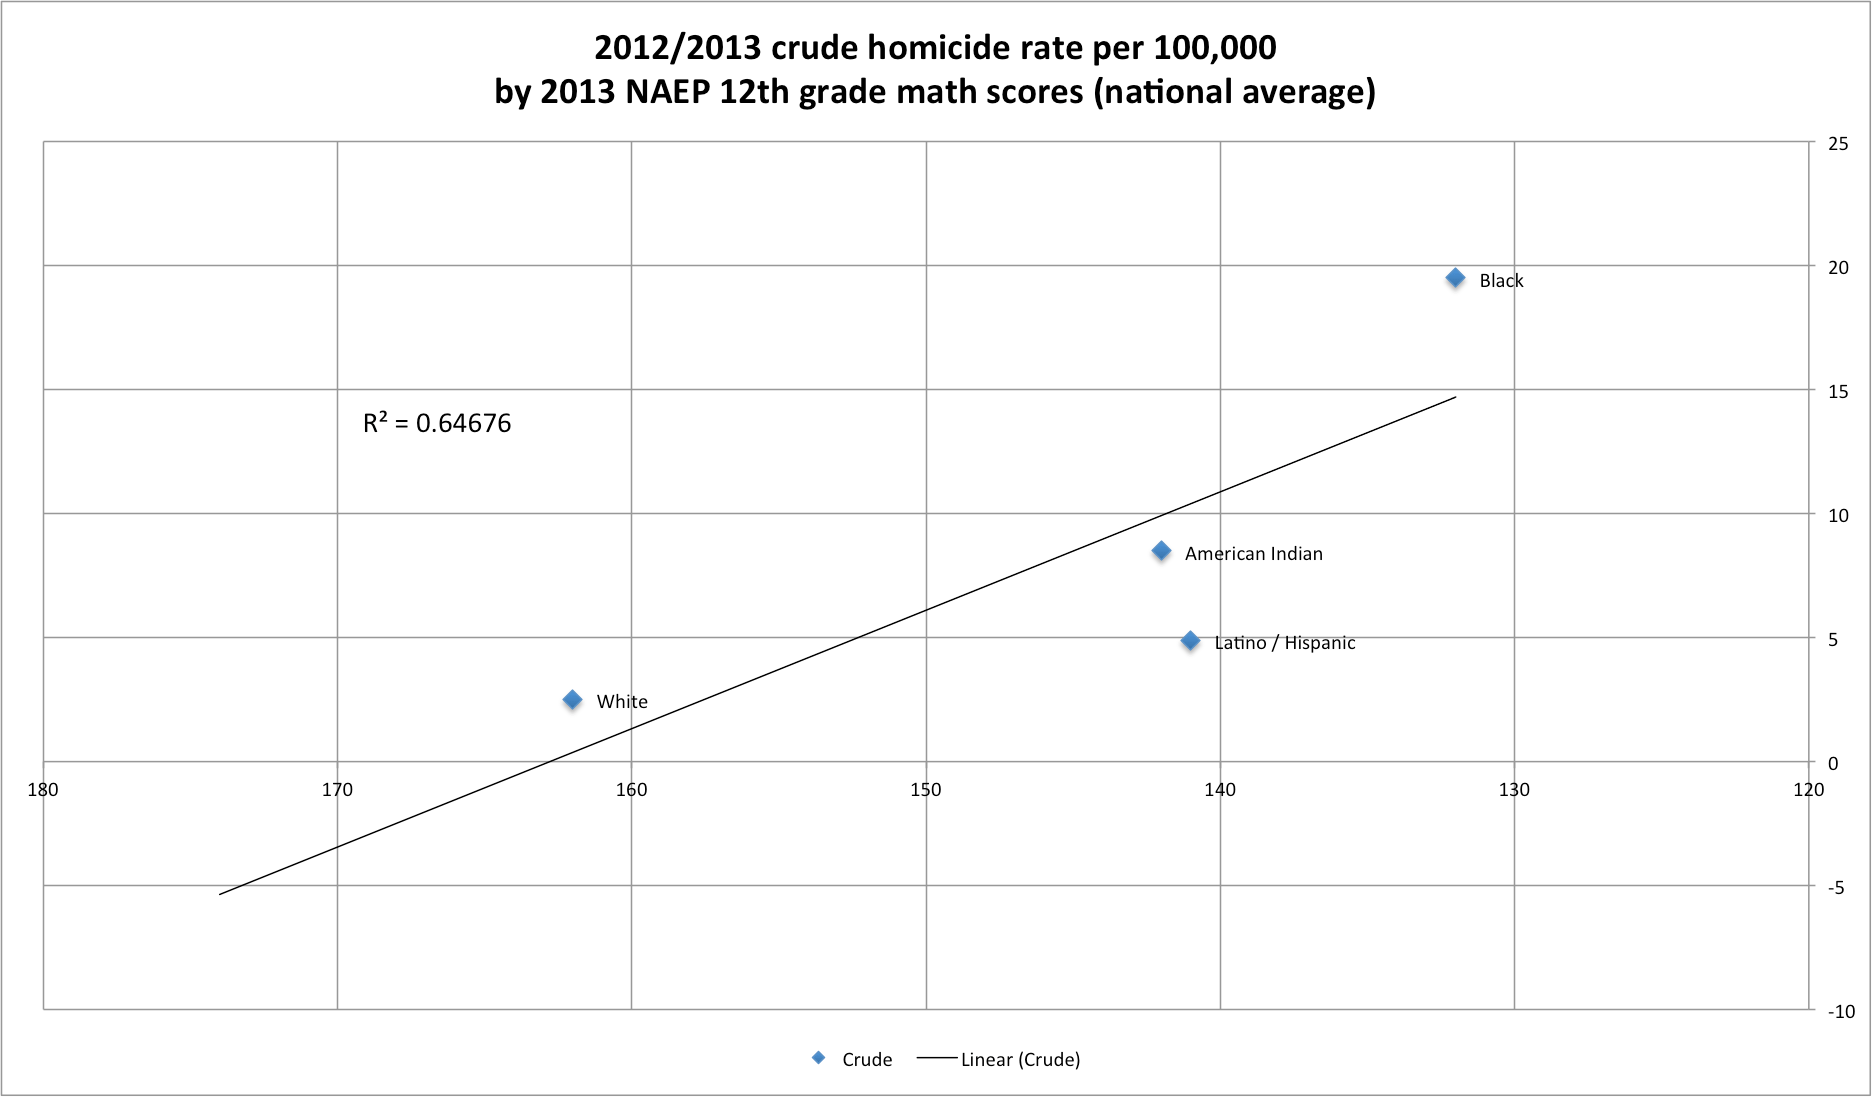
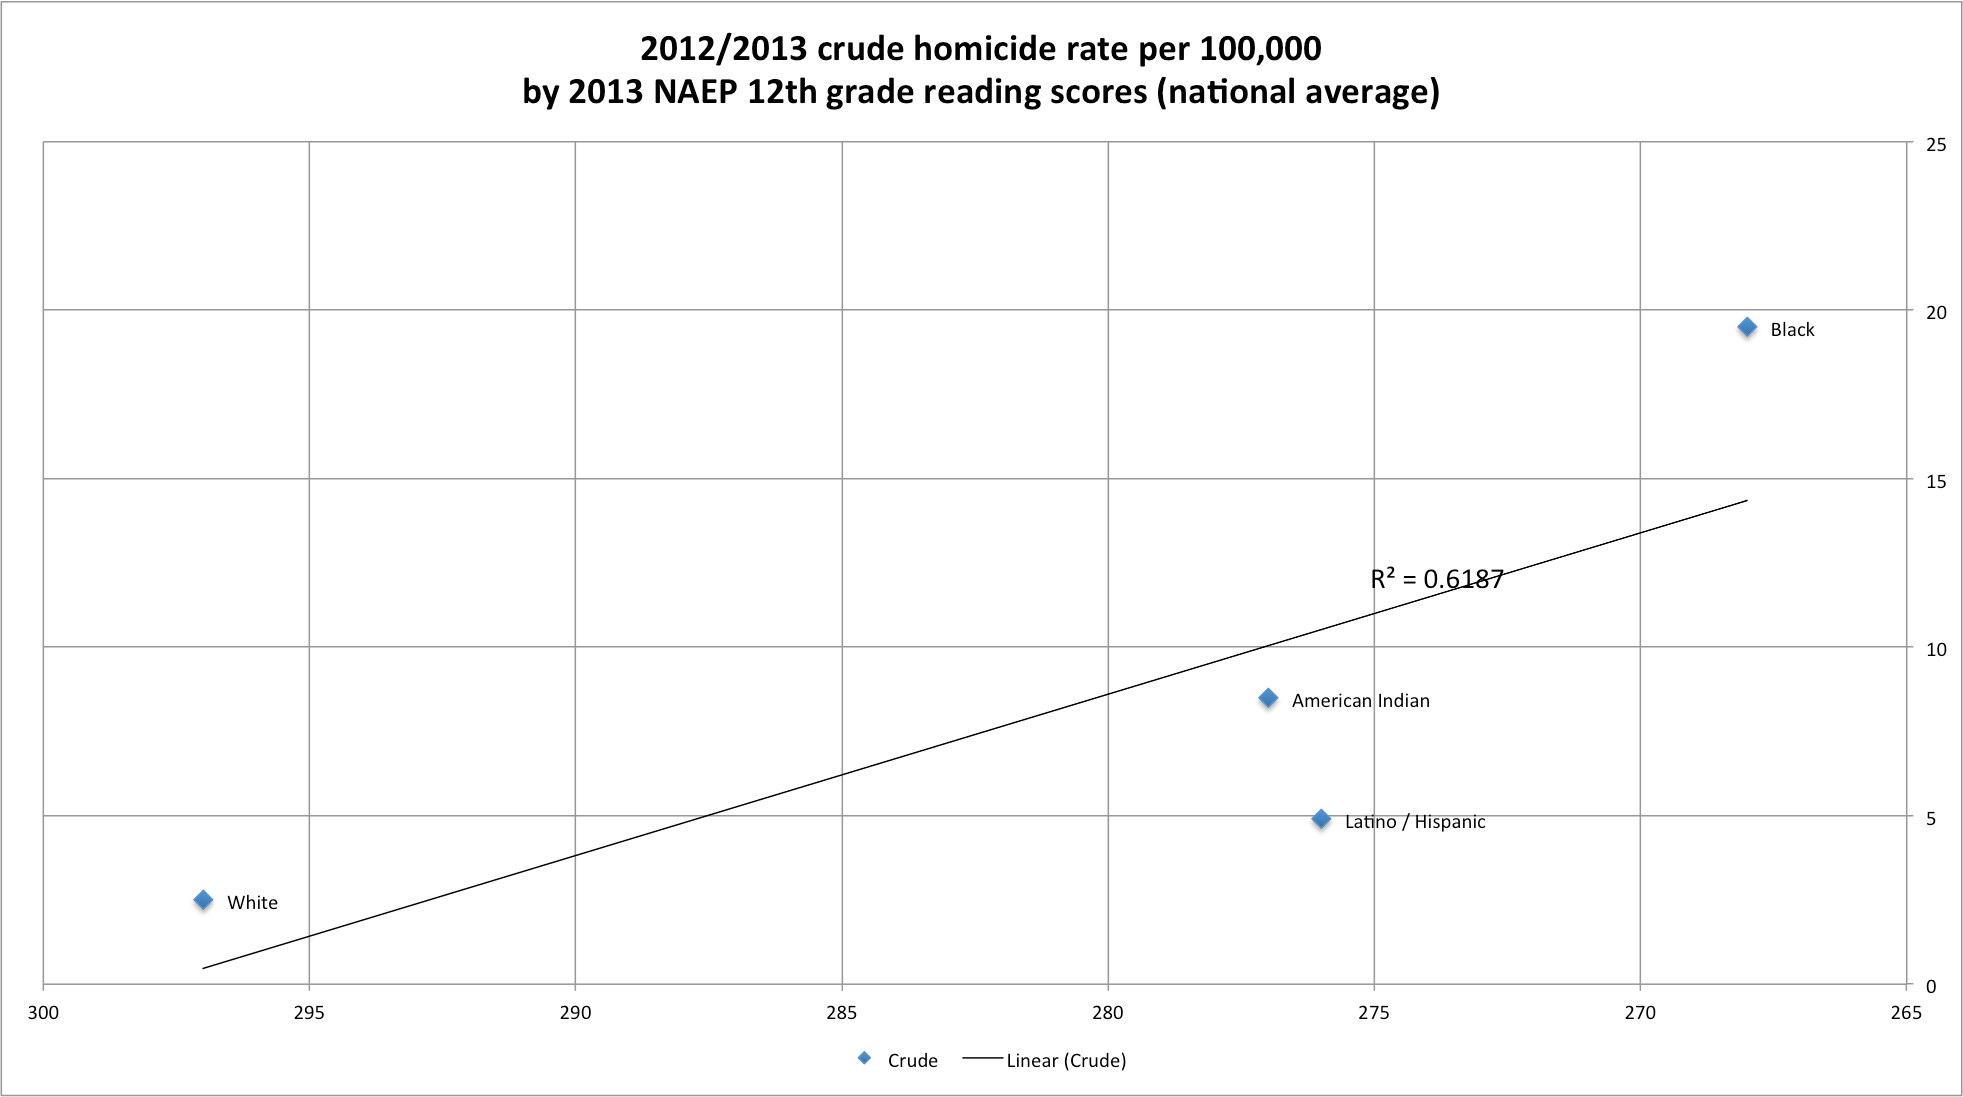
Education statistics


Employment statistics (2010 census snapshot)


(Note: Obviously the employment statistics fluctuates with time and large demographic shifts, but I’d bet there is a pretty good correlation across time or, at least, over the span of 5-10 years, i.e., communities with elevated unemployment in good times will usually be even more elevated in bad times, thus preserving the ordinal relationships reasonably well).
Housing / rental statistics


Combined measures
Most of these measures are usually at least fairly well correlated so combining them won’t do much to close these differences either, but for the sake of skeptics….


(Note: I flipped the sign on poverty to keep its effects consistent with education and other covariates below)


One could play around with this forever, but I very much doubt that anyone can find a realistic economic-driven model that explains this. I do not dispute that there may be important ecological differences in these communities or that these differences might have some non-trivial influence, but the homicide differences are too vast to be explained by objective differences in the economic characteristics of the communities. Even with the composites above, some of which are influenced substantially by behavioral differences, which are not purely economic, and which are sensitive to things like crime rates (e.g., more crime tends to drive down housing and rental prices, encourage more “white flight”, etc), do not come close to closing these large gaps.
Assessing the association with single-motherhood with racially disaggregated data
Although the single-motherhood rate is a strong predictor with the racially-aggregated (combined) data, the picture is more complicated when trying to predict homicides for each group in the disaggregated data.


The effects seem to be the larger for blacks, followed by non-hispanic whites, followed distantly by latinos. Of course, if you believe that these “effects” are non-linear and realize that loess regressions do a poor job of dealing with sparse data (as in, there are very few large “white” counties with high rates of single-motherhood), then you might find this weighted loess regression interesting:

This plausibly explains a good deal of within and across group variation. The same cannot be said if I apply this same technique to other measures.
Like median family income…..

It systematically overshoots the white and latino rates even when there is plenty of density and undershoots the black rate.
Or child poverty rates…

Or percent of households with bachelor or higher

Or percent of households with HS diploma or higher

Or median housing value

Or median gross rent

…. you get the point.
Assessing the evidence with regression models
One way to try to answer this question is with a mixed effects model (specifically with the lme4 package in R). By allowing for fixed racial effects (as in, each group has its own intercept) and, later, in some models, random effects (varying slopes for each racial group), I can try to better estimate how much these covariates explain homicide rates within and across groups.
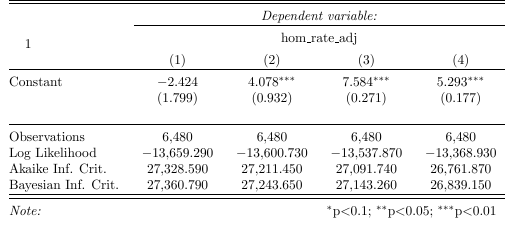
First, I’ll compare several population-weighted models with fixed effects.
 You might note that in model (2) introducing poverty rates into the mix does little to change the homicide rate differences (compare to the racial coefficients in model 1) whereas in model (3) the white-black delta is about half the size. Likewise, in model (4), where I control for both poverty and family formation, the gaps actually increase slightly relative to model (3) and that the standardized single-motherhood coefficient is still about twice as large as the standardized poverty rate coefficient (keep in mind that the racial differences in single-motherhood are much larger than the economic differences).
If I go a step or two further and introduce non-group specific statistics, i.e,. county-wide, for percentage black, racial segregation, and poverty segregation into the mix:
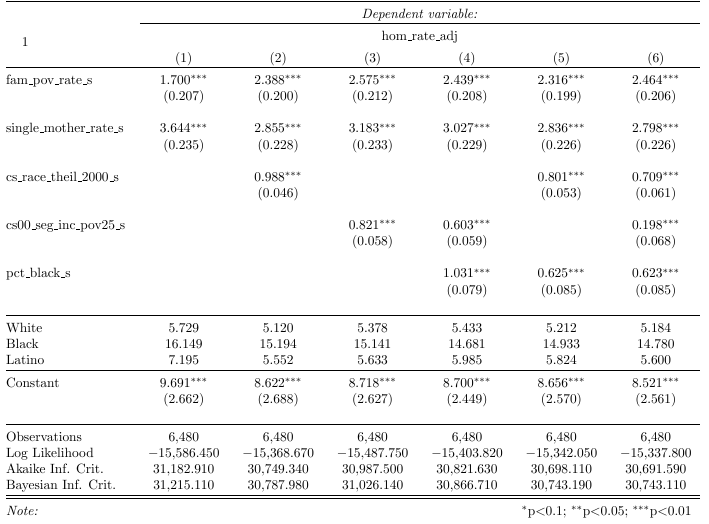
The single-motherhood rate is still very much significant, likewise for differences in the racial coefficients. I feel this is important to show because there appears to be fairly strong association between the county-wide racial segregation index and homicide rates for blacks, in particular, in simple bivariate regressions. Though you might also note that even in perfectly racially integrated counties (according to the index) the black homicide rate is still much higher than average and that most blacks are not in these heavily segregated counties.
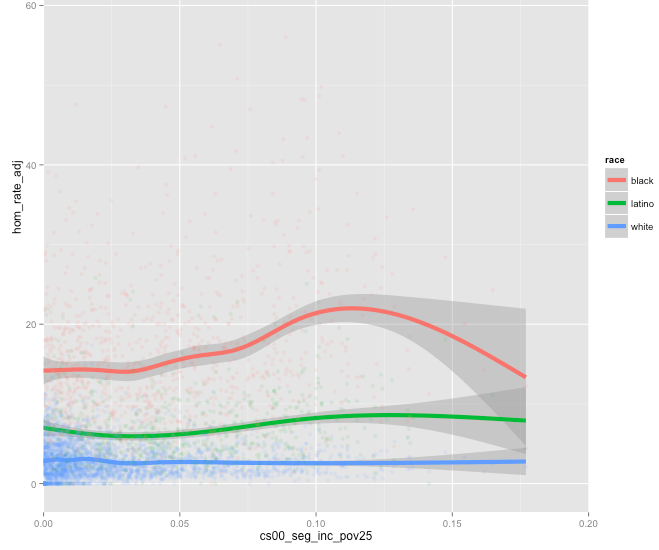
Likewise, direct measures of “concentrated poverty”, i.e., poverty segregation vs racial segregation, seem to show an even weaker relationship.
Now if I go a step further and introduce random effects into these mixed effect models whereby groups are allowed to respond differently to these covariates (which may or may not make sense)….
As in the purely fixed effects model, single-motherhood does much to explain the black-white gap (albeit largely through the black rate), largely mediates the association with poverty (see model 3), and poverty segregation (as in model 4) does little to explain this either. Ideally I’d measure the poverty segregation levels of each group separately (don’t have that data yet), though I largely capture this with the family poverty rate (measured at a group level).
I wouldn’t take these random effect models too seriously except to the extent that it further support the position that these “effects” aren’t likely to be explained by different baseline levels of single-motherhood and the like between groups(i.e., i’d produce similar estimates if I were to run regressions on the black community independently) and that these black difference are generally poorly explained by economic measures like poverty.
A quick comparison of national aggregates
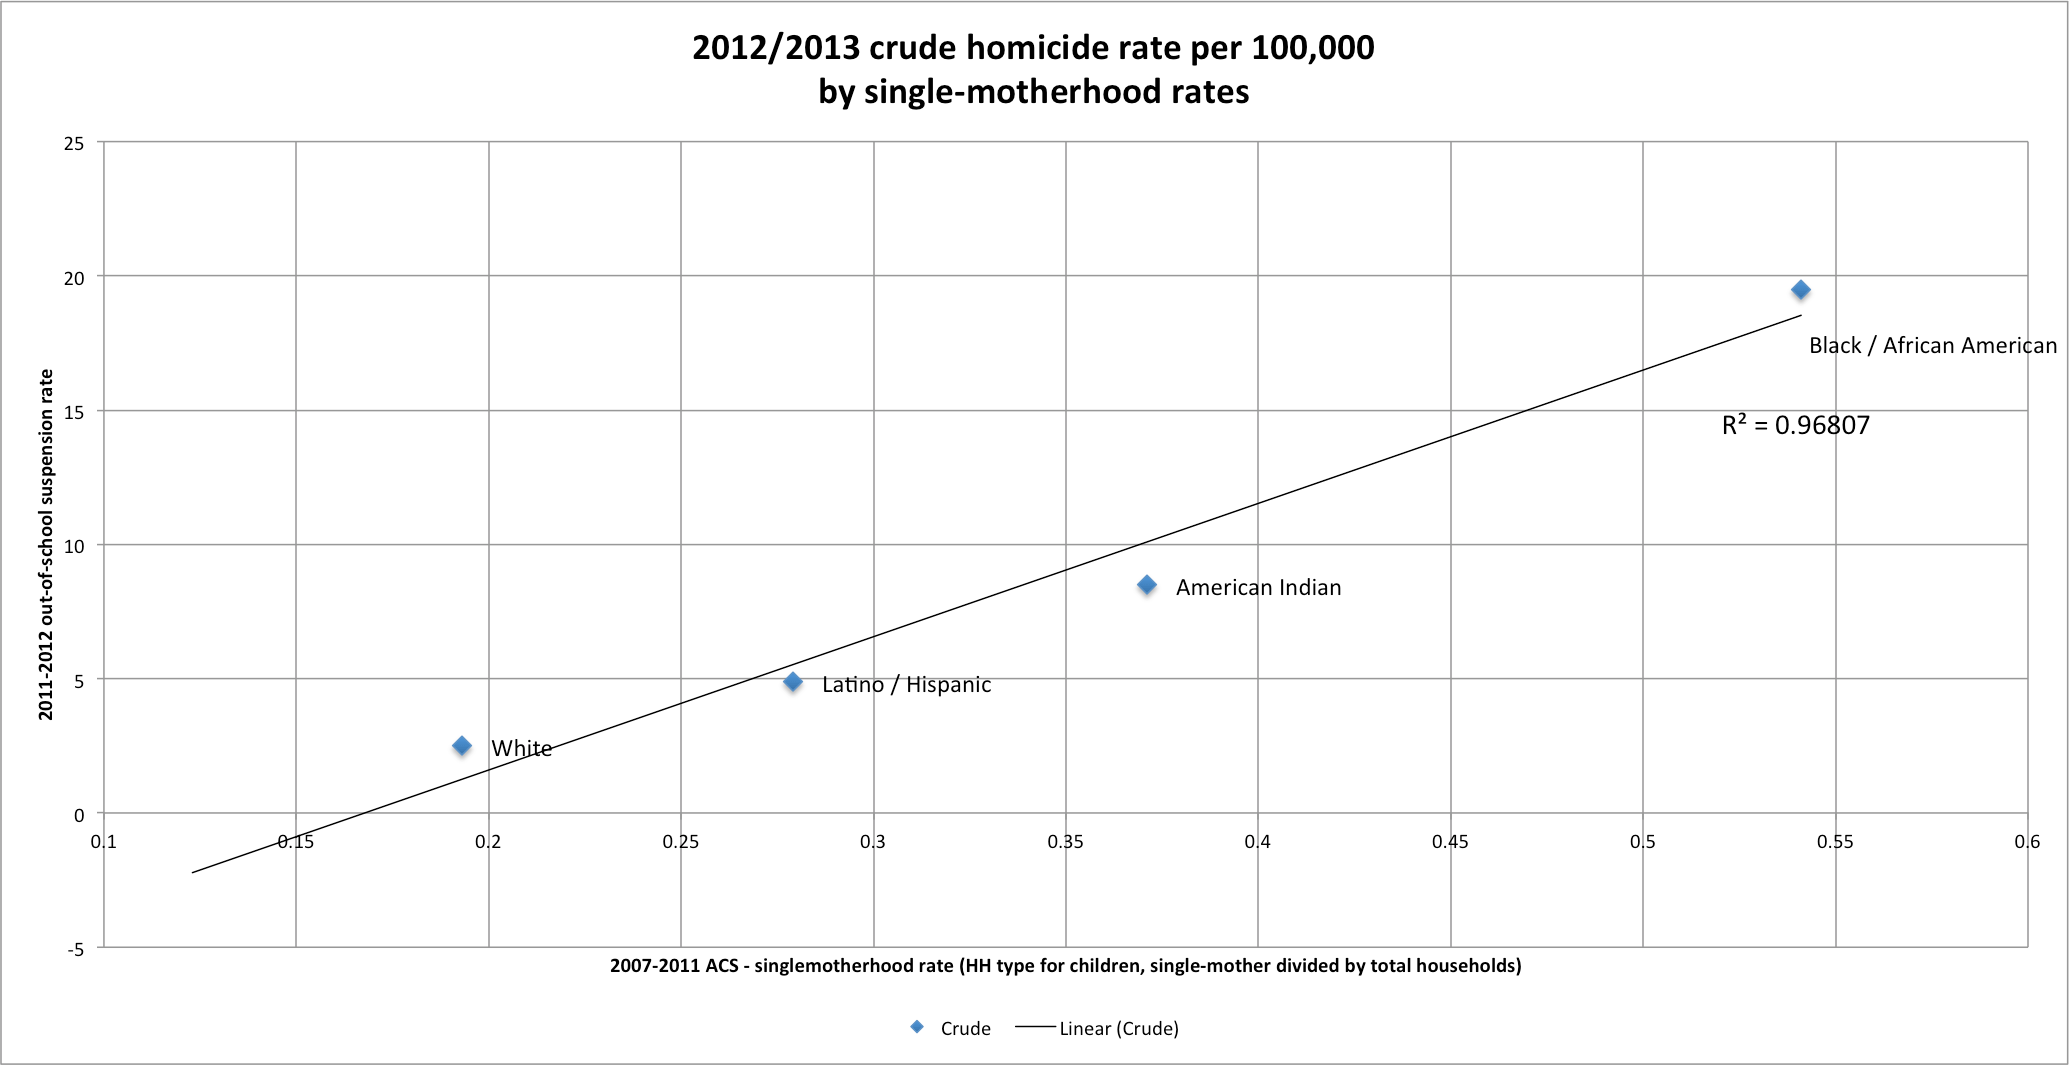
As in a prior post, wherein I compared aggregated rates of single-motherhood to out-of-school suspension rates and found very strong correlations, much higher than other key covariates, I repeat this procedure with homicide rates at the national level (note: I had more groups in suspensions post)

State-level comparisons between single-parent family rates and homicide rates


State-level comparison between male suspension rates and homicide rates


Some additional descriptive statistics / brief discussion reported data
At any given income level the rate of single-motherhood is much higher in the black community. This is clearly not just a phenomenon having to do with income levels.

Nor is it well explained by poverty rates

Also this whole “concentrated poverty” notion cuts both ways. Because affluent blacks are more likely to live near poverty, poor blacks are necessarily (somewhat) more likely to live near modally affluent (~middle class) peers.

And more college educated adults.

My point here is that the proponents of this view tend to overstate the economic (and sometimes educational) aspects of this and seem to want to have it both ways.
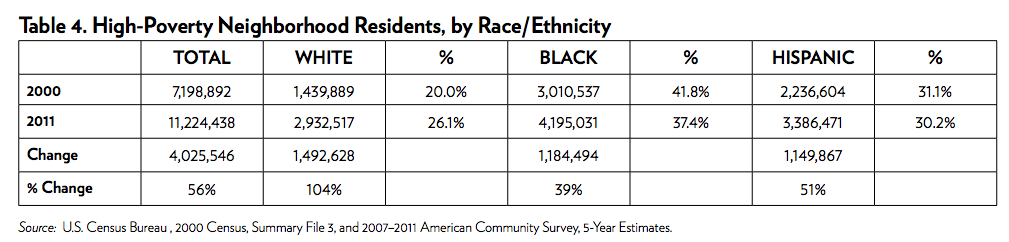
Nor do blacks have a monopoly on “concentrated poverty”. Even at the hyper-local census-tract level we don’t find this.
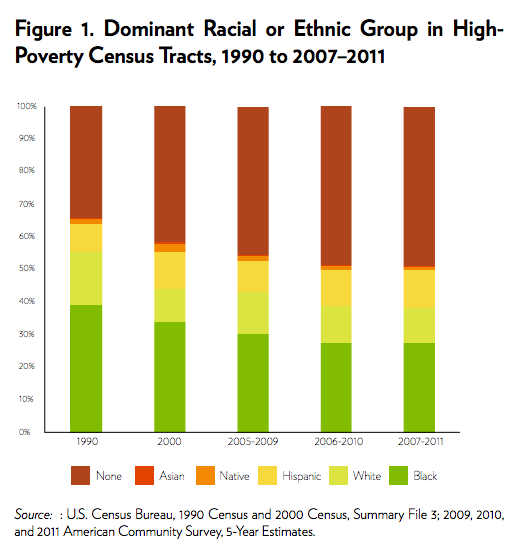
While blacks are more likely to live in “high-poverty neighborhoods” (>= 40% poor at census-tract level), only about 10% of blacks live in these neighborhoods nationwide.
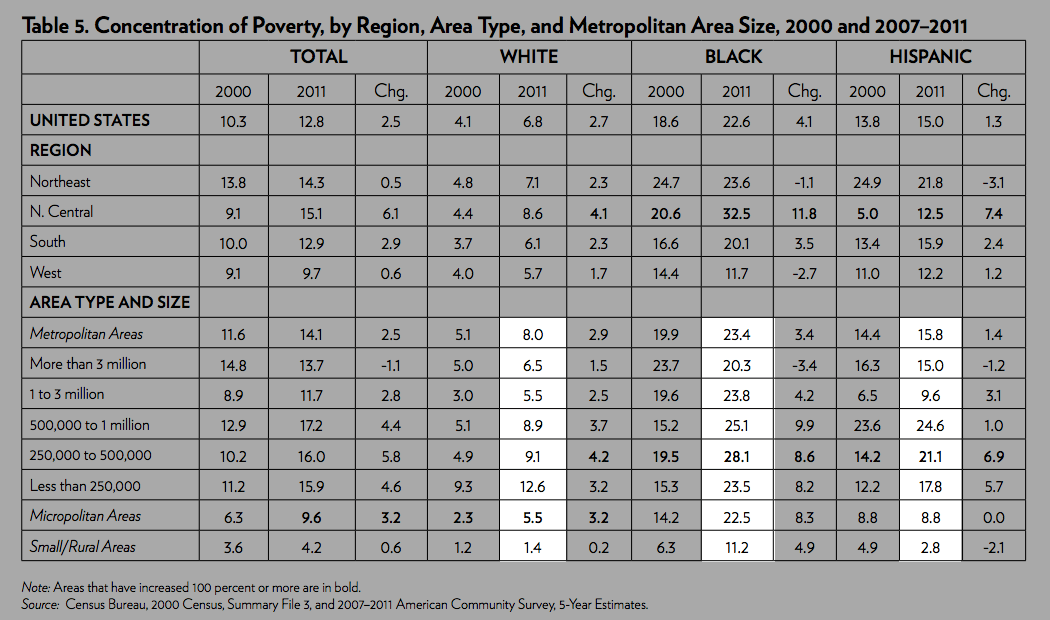
Along a similar vein, the “concentration of poverty” metric (the proportion of poor that live in high poverty neighborhoods) tends to suggest this pattern is not just an urban (big city) phenomenon for blacks and that it generally corresponds pretty well to their elevated overall poverty rates (my use of racially disaggregated poverty rates within each group at a county level likely corresponds quite well with this). All groups are appreciably are more likely to live near their own and thus poverty rates have clear predictive power for the amount of “concentration of poverty” you are apt to find in any given area.
It’s also worth noting that the hispanic poverty concentration is pretty similar to blacks and yet their homicide rates are much lower (even controlling for poverty rates).
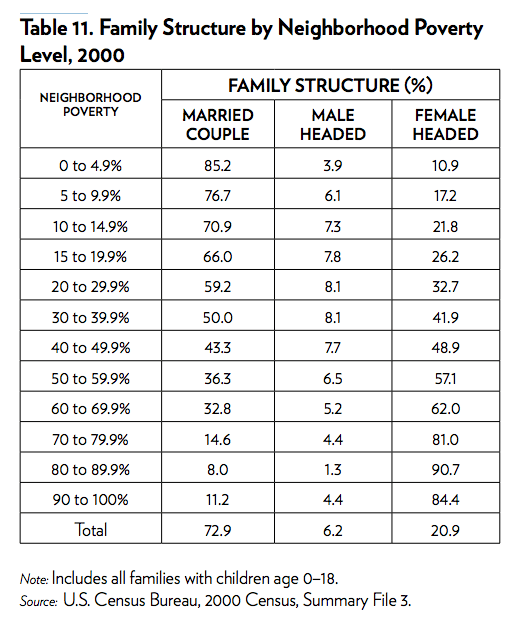
Other things being equal (e.g., earnings levels, employment, etc) higher rates of single-motherhood will tend to have a direct mechanistic effect on poverty rates (fewer earners and lower average female earnings) which, itself, will tend to increase the “concentration” metric too. (Which does not mean that single-motherhood is simply measuring poverty, because poverty rates don’t explain differences in single-motherhood that well, especially not between groups…. even though aggregating the data together implies it’s a near-linear inverse relationship, see table below).
I have also seen various media reports of analysis that purport very large differences in “neighborhood disadvantage”.
For example:
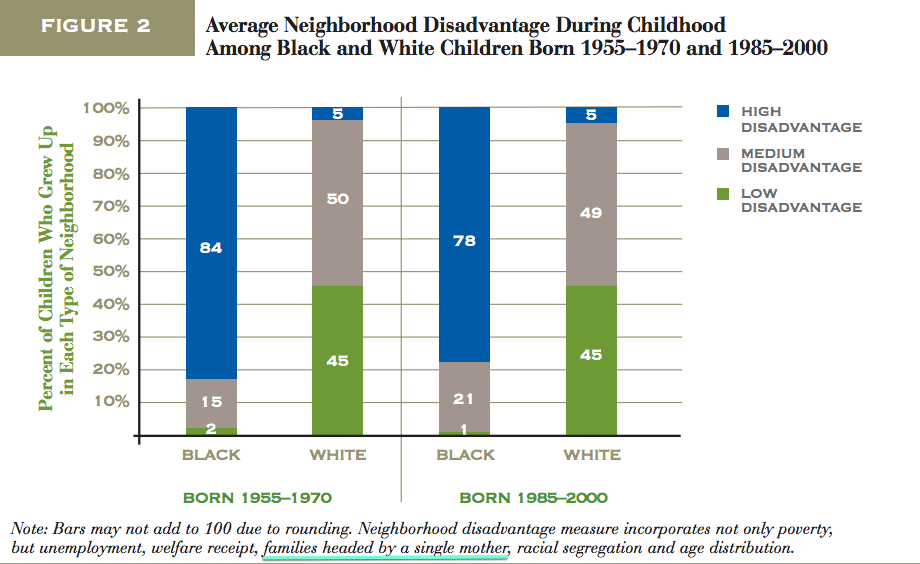
This figure implies that there is very little overlap in neighborhood context, which may actually be sort of true, but this methodology obviously leans heavily on single-motherhood rates and racial segregation to find racial differences this vast, i.e. it’s not simply a measure of concentration of poverty.
I must confess that I am a little unclear as to how it is that people that presumably believe there no are important cultural differences between groups think that racial segregation per se, after controlling extensively for economic conditions, education rates, and the like, is supposed to have large, quantitively significant, effects on socially important outcomes. If they truly believe that then controlling for the educational, occupational, and income levels of neighborhoods ought to render racial differences insignificant.
If these sorts of (statistical) differences don’t exist between racial groups after controlling for socio-economic conditions especially, then why should the racial composition of the neighborhood matter? But if they do matter, as careful analysis of that data clearly indicates, then it makes even less sense to attribute any and all so-called racial segregation to racism and similar irrational behavior (i.e., racial segregation may be unfortunate and consequential, but that doesn’t mean that it’s actually irrational).
A bit on the nature of statistical differences
While I have argued that even controlling for socio-economic status (SES) blacks are more likely to have serious social problems, I wish to make clear, in case I have not already done so, that this is a statistical proposition. I am not arguing that arguing that most black men have committed serious crimes anymore than progressives that argue that SES is an important consideration in crime mean to argue that all poor people (of any race) are criminals. Even controlling for typical measures of SES, we still find that race has quite a bit of predictive value when it comes to crime, school discipline problems, and the like.
To this point, I have seen good evidence that black immigrants in the US experience vastly lower rates of incarceration (much closer to the white average).
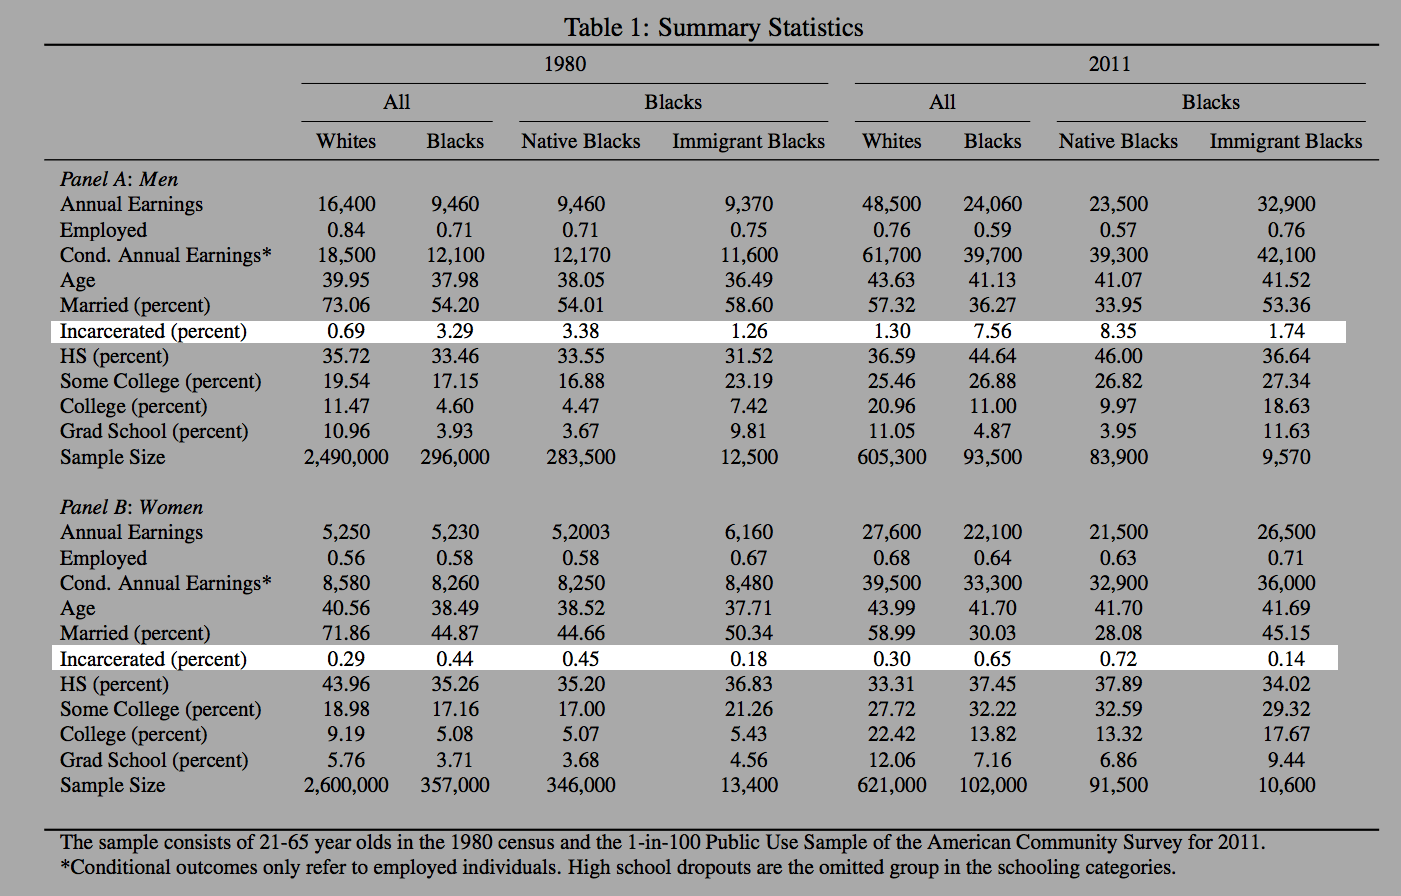
It’s also not likely to be explained well by selection (e.g., cognitive ability, education levels, etc) because we find these differences even controlling for education levels.
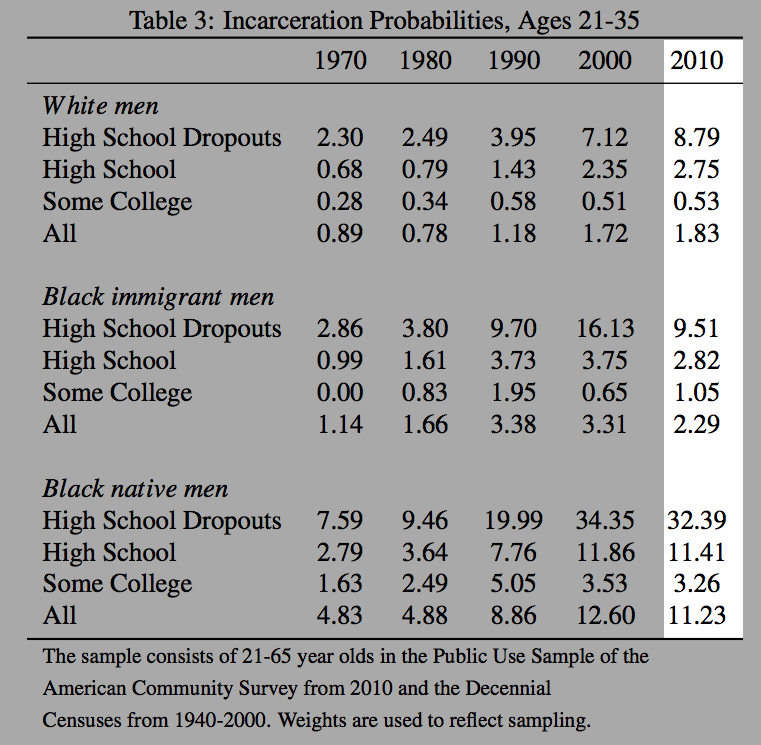
I find some suggestive evidence of this in my own data too:
This is probably not a coincidence either:

Conclusion
To summarize:
- There are vast differences in homicide rates between groups
- This “effect” is found consistently in aggregated and (racially) disaggregated data
- Inter-racial differences are better explained by family structure than economic conditions.
- These differences are even found in some pretty affluent/low-poverty communities
- The (intra-racial) black homicide rate, in particular, is better explained by family structure than poverty rates and, especially, other economic measures.
- There are large differences in family structure between whites and blacks, in particular.
- It’s probably not a coincidence that other groups fall closely along this regression line when aggregated at national or even state levels.
- The inter-racial differences in family structure are not well explained by income or poverty measures, i.e., (domestic) blacks of the same income level have much lower levels of traditional family structure.
Although there is a significant and growing body of evidence that school discipline, county-wide crime rates, and the like are significantly influenced by genetic risk-factors and although heritable differences between racial groups cannot simply be assumed away, I do not believe that all group differences are necessarily genetic (not entirely at least!). It is possible, perhaps even likely, that heritable differences explain some of these differences in family structure (both within and between groups), but even so that does not mean that spillover effects cannot add up in disastrous ways (concentrating large numbers of poorly supervised, poorly socialized young men, especially low social status young men, may produce effects that we might not find if they were more dispersed or better integrated into society).
Regardless, if community context does have non-trivial effects on outcomes of this sort, then advocates for “de-segregation” work at cross-purposes when they argue: that racial differences don’t exist; that they can be explained almost entirely by economic conditions; or that anything that remains after such controls are put in place must be explained by racism, bias…. and so on and so forth.
It is abundantly clear that there actually are large racial differences even within schools and classrooms with respect to discipline problems, academic outcomes, and the like today. These differences exist even with standard controls for SES (though, incidentally, many studies use SES controls when measuring the effects of integration, but the sort of integration people think usually involves low-SES blacks). If people truly want more and better integration then denying these facts and implicitly charging schools, teachers, and the like with racism for disparate outcomes is ultimately counter-productive. If blacks are statistically more likely to seriously misbehave due to unmeasured differences like family structure (or, alternatively, unmeasured “social capital”) raising holy hell every time significant disparities are found and insisting that “racism” is the cause is only apt to increase resistance to further integrating neighborhoods and schools because broadly middle class whites, asians, and most other parents (blacks included) really don’t want to their children to be in school with unruly or even violent children. They are likely to remove their children from said environment if it is in their power.
Firm discipline may, arguably, be the price of admission if more integration of neighborhoods and schools is desired on both the economic and racial dimension. Statistical racial differences are all but inevitable in those circumstances (i.e., especially integrating low-SES blacks in with middle class whites, asians, etc). Different discipline procedures might help to reduce the absolute rates of suspension and expulsion (hopefully without worse unintended consequences!), but racial differences are still bound to be non-trivial for the foreseeable future and it’s hard to even grapple with these things productively as a society when we deny basic objective facts and suppress vocal dissent.
The ability to suppress open dissent should not be confused with the ability to suppress the consequences of dissent. It especially should not be confused with the reality of the issue itself.
Great analysis! Complementary to your work Sethi and O’Flaherty use a game theoretic analysis to show that differences in violence can in part be associated with preemptive motives for violence.
http://www.columbia.edu/~rs328/Homicide.pdf
Do you think you could look at the longitudinal data through the lens of lead versus changes in rates of black single-parenthood as competing hypotheses?
The single-parenthood rates are a result of policies that reward women and lower income groups for divorce and single-parenthood. Given blacks had a disproportionately low income at the time policies of no-fault divorce, child-tied welfare benefits, and child-tied spousal support were put into place, it makes sense these policies disproportionately impacted the black community, thus causing all the social malefactors related to it.
From Wikipedia: “The United States Census of 1860 was the eighth Census conducted in the United States starting June 1, 1860, and lasting five months. It determined the population of the United States to be 31,443,321, an increase of 35.4 percent over the 23,191,875 persons enumerated during the 1850 Census. The total population included 3,953,761 slaves, representing 12.6% of the total population.”
https://en.wikipedia.org/wiki/1860_United_States_Census
Yet at that time, 89% of black people were slaves, despite being only 12.6% of the U.S. population.
http://blackdemographics.com/population/
I’d be interested to see the author examine this disparity and provide some hypotheses to account for it.
Your 2nd link implies blacks were 14.1% of the population at the time (not 12.6%) and this is generally consistent with my understanding of the data too. I don’t see any disparity to resolve…. also not sure how this relates to my research.
When you compare black immigrants to native whites, isn’t that a pretty dubious comparison to make? My assumption of any immigrant group, but especially those that would come to the US on their own accord from the Islands, Africa, South America; would be much more at the top of their respective populations. More motivated, higher intelligence, stronger families–the top end of their respective bell curves. So when you compare a group of the cream of the crop of one race to the entirety of another race (a few million compared to 200+ million) and the stats are roughly the same… that doesn’t seem to do anything but make the racial argument stronger. Unless I’m wrong here
Oh I agree immigrants tend not to be fully representative of the countries they come from. Selection for various characteristics (genetic, cultural, socioeconomic, etc) is always a very real possibility and the non-genetic traits don’t necessarily persist more than a generation or two….
“It’s also not likely to be explained well by selection (e.g., cognitive ability, education levels, etc) because we find these differences even controlling for education levels.””
if you’re immigrating from a foreign country you may be the “cream of the crop” but your background in terms of economic status might still be closer to a US middle class existence because your country has lower standards for what constitutes upper class. and the lack of correlation w/ education suggests that it mightn’t be to do with class since class and education tend to be linked afaik. then again i think immigrants tend to have lower crime rates in general regardless of race, it’s the second generation who tend to see a spike.
Cream of the crop of one race? Wow you guys are dumb.
Single motherhood is in my view a mediocre determinate of crime as well. It increases rates, but like income has serious drawbacks.
The counterfactual would be wealthy nations with high rates of out of wedlock births. Chile has the highest rate in the world with a murder rate of 3.1 for 2012. Iceland has an out of wedlock birthrate of just under 70%. Its one of the only European country that comes close to the African American rate (~72%). Yet they, like so many other European nations including the poorer one has a very low homicide rate.
https://icelandmonitor.mbl.is/news/news/2015/05/13/iceland_3rd_lowest_murder_rate/
Liberal explanations about poverty and racism being the root of black criminality and social underachievement have elements of truth but are incomplete. By any measure including GDP per capita, hourly earnings+benefits, median household income, and median individual income almost every European nation is poorer than America. They do not have the murder or sexual assault crime states the USA does.
Similarly, so are conservative explanations about big government and the breakdown of the family. The EU has a far more developed and generous welfare state. They have similar or higher rates of divorce, similar or higher rates of single motherhood, and much higher rates of atheism and agnosticism. Drug use is less taboo and more common in some places that have experimented with decriminalization. Yet, despite the breakdown of the family and its replacement with “big daddy government” the Europeans have been able to largely adapt without the violent consequences.
Out of wedlock births by nation
https://yaleglobal.yale.edu/sites/default/files/images/chamie-chartPicture1-500px858.png
Homicide by Nation. International comparisons can get really messy, but looking at OECD nations helps in this discussion.
https://en.wikipedia.org/wiki/List_of_countries_by_intentional_homicide_rate
“Out of wedlock” is not synonymous with fatherlessness
National culture plays a huge role. In the Nordic countries, having a child in the first place is seen as a sort of contract, the marriage ritual is more for fun. Even with divorce, it’s incredibly rare that the father will be entirely absent. As a rule, joint custody of children is the solution applied. Due to there not being any stigma behind having out-of-wedlock children (the stigma is tied to not being there for your children), marriage rates and divorce rates are bad variables to use when comparing different countries.
I’m not very into statistics. I didn’t understand: so, how much of the white-black homicide rate gap is explained by single-motherhood?
Thanks
When aggregated at a (very high) group level, family structure appears to (statistically) “explain” close to 100% of the differences in homicide rates between groups (r-squared very close to one). It also appears to explain a tremendous amount within and between groups at slightly lower levels of aggregation (groups by state) — the logarithmic plot+regression implies that if black communities had family structure rates comparable to that of white or asian communities (even better), their homicide rates would be in the same ballpark if the trend continues [a pattern which surely cannot be claimed for measures of income, wealth, etc!] Of course, there is virtually no overlap at reasonably high levels of aggregation (state, city, or even county) so we can’t actually observe it (white family structure rates in the worst states are still better than black family structure rates in the best states for blacks). Even at the county level, there is next to no black-white overlap with respect to family structure, certainly not enough to reliably estimate homicide rates for both IMO (especially in more of a real world understanding of the data where people don’t necessarily live and interact neatly within their county boundaries, not to mention issues of measurement error, etc).
This is not to suggest that the r-squared between family structure and homicide rates at a more granular level (e.g., county, tract, etc) is close to one (“~100% explains homicide”) or that including family structure in a simple linear regression will fully mediate the significance of race (the % white and % black coefficients are still substantially different). Because of measurement error, real world issues with this sort of data, and choices of modeling methods, and the like I don’t think we should necessarily expect this even if family structure really did fully explain this in reality. My preferred specification for the relationship between family structure and homicide rates would be logarithmic (bad outcomes of this sort increase exponentially as social structure decays due to interaction effects between individuals in the same area IMO); in hindsight I should have done more to model this at the county level prior to disaggregating by race…..I’m fairly sure we’d see family structure explains more (higher r-squared) and does more to mediate group differences at that level of analysis [perhaps a small project for later]
That said, while I personally believe family structure is likely to be at least partially causal here, I’m not necessarily arguing one needs to accept this is purely or even partially causal either. My point, RE: family structure, is that it fits the data much better than income and other available economic indicators (e.g., poverty, wealth, housing values, etc) and that it should probably be taken a lot more seriously as an area of inquiry (especially by progressively-minded folks).
Wait, I’m not going to lie, I have a hard time following statistics. What exactly is your argument? That a parent taking out a child in their class because they don’t want a black child being in their class, isn’t racism? Because, that is, by definition, racism. “Statistically more likely to” lacks nuance and doesn’t mean, is going to.
What you need to look for is cause and effect. How can we fix the problem instead of abandoning it? You say segregation isn’t irrational, but it clearly didn’t work in the past, why do you suggest we try it again? Is injustice not irrational? Would you say it’s rational if it was a woman taking out her child from a classroom because she doesn’t want her child near men, who are statistically more likely to commit crimes? Also, doesn’t income play a part in single motherhood top? Couldn’t that be linked back to poor socio-economic conditions? If disparities in treatment link back to single motherhood, why do black kids with more than 1 parental figure still get mistreated? Disparities in treatment due to race or gender manifested itself in some of the worst events/time periods in history. Again, cause and effect here. Not to mention, it is not an excuse to treat them more harshly. Where’s the statistic that said they were more likely to misbehave in school? And unequal treatment in schools will definitely not solve the so called imbalance in behaviour between races due to cultural differences. That’s just straight up racial profiling and assuming all people of one race are the same. Quite the contrat, it will cause them to look at the injustices and rebel. They cannot rebel against injustice if there is no injustice, and the eradication of injustice is what equality is all about.
These cultural differences you are saying account for violence, the same thing can be said back in history. The history of cultural genocide and unjust treatment that went on for decades cannot be the contributing factor? What if the main factor here is the past? To fix a problem we don’t move back, we move forward. You wouldn’t take every child of a white father away just because of the pedophilia statistics, why exactly is this different? Again, your statistics are in the end, just statistics and do not account for personal values, beliefs and abilities as a parent.
https://www.google.ca/amp/s/www.vox.com/platform/amp/identities/2018/4/5/17199810/school-discipline-race-racism-gao
https://www.apa.org/monitor/2016/11/cover-inequality-school
https://www.uncf.org/pages/k-12-disparity-facts-and-stats
https://public.wsu.edu/~taflinge/evistats.html
https://www.google.ca/amp/s/www.vox.com/platform/amp/2015/5/7/8562077/police-racism-implicit-bias
My work is almost entirely descriptive. There are large differences in community-level homicide rates associated with racial/ethnic demographics. They are clearly not explained by poverty rates or other indicators of economic deprivation.
We are unlikely to fix problems we are rarely willing to even acknowledge exist and, in the rare movements we do, delusionally assert causes to them that are reasonably known to be false. As for solutions, I’d suggest more and better policing to start. This almost certainly entails significant racial disparities, so we need to be realistic: the people killing black people in black neighborhoods are overwhelmingly young black men (even if just a small fraction of them!). If we run a regression and control for income levels, we should not be surprised to find substantial racial disparities. However, safer and better ordered neighborhoods are ultimately in the interest of the black community writ large. Further, safer neighborhoods will do (has done) more to reduce neighborhood-level segregation than almost anything.
My argument vis-a-vis family structure isn’t that it explains everything, particularly not at the level of the individual, but that it seems to explain much at at ecological level. A community full of single parents is different than one where this is relatively rare, even for the children raised in single-parent homes. Having lots of poorly supervised adolescent males running around a neighborhood for hours on end is a recipe for trouble, particularly when they don’t have much else going on in their lives (academics, organized sports, work, etc), and particularly when a significant fraction of those were raised with significantly different behavioral norms.
Though I can’t say there is absolutely no unequal treatment (mostly different thresholds as to what constitutes acceptable behavioral), actual behavioral disparities are large. It’s a tricky problem, but willful naivety will hurt far more in the end.
Your modeling leaves out one crucial factor, the constant world wide messaging that black people’s lives are not worth anything.
Given the both blatant and soft messaging about the low value of black lives is it really any surprise that homicide rates among black people are on average higher regardless of demographics? It is an underlying message constantly played out in the news, media and government policy.
Until the mid 1960 Crayola had a color called flesh, it represented white people. Think about the message that it was sending to every child who wasn’t white and did not match that color, but saw it every day in their crayon box and the images of what the media was defining as beautiful.
Study after study shows how global society has been conditioned to value white lives while things that are black are frequently viewed as negative or evil. In TV shows the good guys wore white and the bad guys wore black.
For a perfect example at how this plays out in society take a look at the show SG1 or almost any other sci-fi show made prior to 2015. In almost every instance that represents an enlightened or beautiful society the people are almost always all white. The majority of alien races encountered are white and lead by white people even though white people are not even the majority on this planet.
Conversely any war like or primitive society is almost always represented by people with brown skin. While it is only a TV show and had some black people in prominent roles on the show, it is the perfect representation of the soft messaging being constantly broadcast about the value of white lives verses black lives.
We even see this reflected in Asian cultures where lighter skin and European features in their own their own people are valued over features more native to their own. In China we even see this reflected in how they hire white people to play the role of a Doctor or some other professional just because people in their society are more likely to be influenced by messaging coming from a white person than someone who looks like them.
I will say that things have gotten better over the last generation in that black people are finally starting to see themselves represented in all elements of society today, but a decade or so of progress is not going to wipe away the ramifications of thousand of years of the institutionalized devaluing of black lives.
I do not find your inchoate counterargument persuasive, and I believe you are mistaken on some specific points. Still, your comments are almost entirely orthogonal to the argument I advanced in this 5-year-old blog post, i.e., there are substantial racial differences in violent crime that cannot be explained away by economic factors (despite received wisdom to the contrary). This difference reflects a stubborn reality, whatever the root cause(s).
It’s an ugly truth that I would generally prefer not to dwell on too much (such a thing is possible!). However, society and leaders must be reasonably well acquainted with truth to reason correctly about policy tradeoffs. It comes up in education, legal, policing, transportation, and other policy domains. For example, this factual perspective is particularly necessary today with the rise of BLM and the passive acceptance of some of its core propositions by many poorly informed observers.
To expound on this tangent briefly, when we reliably know there is an 8-to-10 fold difference in homicide rates, with similar implications for other violent and many other serious crimes (much of which isn’t as well measured due to under-reporting, “juking” stats, and perceptual differences in what rises to the level of actual criminal/reportable behavior), it’s not realistic to expect comparable police activity in black communities (even adjusting for income, education, etcetera!). This elevated police presence very likely necessarily implies more encounters with the police, and especially more potentially violent confrontations (police dispatched due to reports of crime).
I do not see how one can realistically expect disparities between-groups in police shootings and other unfortunate events to be effectively equal under the circumstances. Knee-jerk responses, like doing away with the police, are patently stupid. Indeed, we could probably use more police, especially in many black communities.
P.S., This is not to suggest there is no opportunity for improvement or that any-and-all use of force by the police is justified, but the focus on racial disparities per se is mostly misplaced and likely counter-productive. More and better training might reduce the (absolute) rate of these sorts of incidents (which have been trending down for decades!). Still, bulk of the relative racial disparities of this sort are unlikely to be profitably resolved without creating even worse issues (e.g., the breakdown of law and order).
Whether you agree with me or not, it does not change the fact that your analysis is flawed. You are doing the equivalent of counting to 100 by starting from 80. The current state from which you are deriving your statistical conclusions from did not happen in a vacuum.
You speak about society and leaders needing to be reasonably acquainted with the truth yet reject the fundamental truth of the impact of black lives not having the same value in society.
I have not delved into the details of the BLM movement and could care less about what they have to say even if you want to conflate my argument with their movement. Unfortunately due to that movement any reference to the valuation of black lives and how it has impacted society is reflexively connected to that movement even though the study of it has been around for decades.
Nor have I gone poking around your site to understand if you are legitimately attempting to answer a question or promoting an agenda. I was just pointing out that your conclusions are flawed because you are leaving out a key variable.
Reject the input, accept it, whatever, doesn’t matter to me, but if you are genuinely seeking to answer the question then you will look at all the factors, not just the ones you deem relevant.
My argument is not flawed. I have convincingly shown that B (economic resources) does not convincingly explain A (crime disparities). You wish to argue that some factor C (the notion that some lives “matter” more than others) might. Your argument is not convincing, or even well-founded, but that’s neither here nor there insofar as my analysis is concerned. My position holds up well even if we posit that your tendentious response is fundamentally correct.
I mentioned BLM because my analysis is relevant to disparities of this sort — it’s an important fact that we must deal with even if it does not settle the issue in and of itself. The thrust of your comments is apparently that blacks may be disproportionately responsible for violent crime and that material (economic) factors cannot explain this, but that blacks necessarily cannot be culpable for their actions because of an alleged bias against them. So what? Though I remained unconvinced by your assertion, it does not falsify my analysis, and it’s not even particularly relevant to the broader issues.
Whatever the ultimate cause, we must still make decisions in the here and now. Your quibbles over moral responsibility do not change the unfortunate truths, even though you presumably hold out hope that such disparities will disappear once black lives “matter” sufficiently and some time has passed (how much??). We still must formulate policy around reality as we are likely to continue to find it in the foreseeable future, whatever the ultimate cause of such disparities.
Hi I was wondering what would happen if you looked at class factors not in terms of wealth or income but in terms of business ownership, stakes, positions held at workplace, type of workplace, self employment, temping vs part/fulltime, union membership , type/strength/involvement level of unions etc.,
Thanks.
You mention this analysis is missing a key variable: value of a black life in society. Yet, you then don’t define the value of the variable. How much is a black life valued in society, according to you? How do you calculate that? How does using your made-up variable change the analysis? Can we see your work?
How is anyone supposed to do an analysis with a made-up variable that you yourself are unable to quantify or communicate how you calculated it?
Just because something is hard to measure does not mean it is not important. He had all the economic and criminal statistics handy, while probably for understanding the value of a black life in society would have to be analysed more qualitatively through a survey or discourse analysis of media or even governmental discussions. Yet the qualitative nature does not take away from the variable’s importance.
Care to go one to two levels deeper here to something more substantive? What type of survey would compute the value of a black life relative to an asian life or white life or hispanic life or indigenous persons life? Are you just going to ask an audience how they value different lives and ask for a number? What if the survey responses told you people value lives equally? Would that be case closed on thinking this is an important variable?
Or how would you go about computing the value of lives with ‘discourse analysis’? Any sort of specifics would be helpful.
Let’s say we run that ambiguous survey you mention, and then we get a number for the value of the lives of different races (btw, i think this idea of valuing different race’s lives is perverse). What are we going to do with it? Why is this variable important? What are the causal mechanisms at play? Is it your theory that the primary reason for a racial group’s criminal activity is how they value their own lives along racial lines?
If so, how do you square away the fact that men are predominantly the perpetrators AND victims of violent crime, relative to women? If the hypothesis of black lives being valued lower is the cause of violent crime, why do black women commit less crime (and are criminalized less) than white men?
A simple explanation exists for all these factors: The mass incarceration of Black people and the utter and complete failed War on Drugs.
It would be great to see a statistical analysis of what crimes a child commits in relation to how long the parents or other relatives or role models were incarcerated. I suspect the correlation is high.
And it turns out the solution is rather simple: stop locking up Black men for non violent drug offenses.
I’m not sure what your reasoning here is exactly, but it seems unlikely regardless.
1) These disparities in crime and imprisonment go back long before the war on drugs.
2) the vast majority of people in prison, both black and white, are serving time for serious violent crime. Only a small percentage are serving time for drug crimes (even fewer for drugs alone, let alone mere possession)…. similar issues with the timing.
3) While there are surely moderately strong correlations between parent and child in indicators of criminality (imprisonment, convictions, etc), as in most of other characteristics, the better identified (causal) evidence indicates the effects are relatively modest and mixed. Even the higher estimates couldn’t explain these sorts of gaps and, indeed, there is some evidence the causal effects are even positive on education and related outcomes. Though I believe family structure is a strong predictor and that there’s likely some causal element to it (especially at the neighborhood level vis-a-vis spillover effects on the rest of the community), most of the fathers serving time in prison (especially the violent offenders that constitute the bulk of the population): (1) probably aren’t particularly involved in their childrens’ lives and (2) probably are not particularly good role models.
Then how come the UK sees the same pattern of incarceration, with a proportionally higher rate of imprisonment of black males?
https://www.theguardian.com/society/2010/oct/11/black-prison-population-increase-england
There was no “War On Drugs” there. Also, the majority of serious offenses carrying longer sentences tends to be disproportionately black also, and I don’t think you can explain that away by simply saying that it’s because black males are incarcerated for petty crimes more often. Certainly, you would have to show statistically that was even the case in the first place.
You just used a simple OLS with incredibly endogenous variables and interpreted the slope coefficients as causal, so your analysis is mute.
My argument isn’t that black causes violence, but that economic variables do not explain the particularly strong association between black and violent crime. Your concerns over endogeneity are misplaced.
P.S., Simplicity is often a virtue.
This answer is beyond dishonest. Just look two posts down. I don’t see OP arguing with commenters saying race is causal, lmao. “I’m not saying this is the case, I’m just dishonestly hinting at it over and over.” The structure of your argument is bunk. I especially knew you were a joke after the para dismissing racial segregation as a factor independent of race, as if that very notion was absurd. What a joke.
It is not the least bit dishonest. The argument I made originally, which I still stand-by, is that economic variables do not explain the very large differences in homicide rates, PERIOD. The argument is very straight forward and this is important information in its own right.
Many argue or implicitly believe these things are readily explained by straight forward economic factors like poverty rates. They believe or even argue these differences cease to be relevant in middle class black neighborhoods. It’s just not true. Similarly wrong arguments pop up from these false premises, for example, the need for policing or the expected number of stops in a neighborhood. Whatever the ultimate cause(s), there is a persistently large black fixed effect that will barely budge after controls for neighborhood economic conditions. Similar issues apply to analysis of other dependent variables, such as incarceration rates, but homicide is interesting here because it is largely independent of potential bias in policing, prosecutions, courts, and so on.
I don’t know what you’re talking about, RE: “after the para dismissing racial segregation as a factor independent of race”. I’m not convinced racial segregation explains much, especially not current day (observable) segregation, but I don’t believe I argued it’s independent of race.
Why would you mention incarceration rates yet fail to include them in your analysis? Why do you think there are so many single mother households? I am also curious as to why you ignored population density as this seems to be an obvious choice for exploration as a co-factor.
I’m not a statistician, you must have a reason I can’t see.
Can you explain what the poverty rate is in your analysis? I know what the definition is obviously but wouldn’t it change depending on the COL of a particular area? Poverty in California is different from poverty in Mississippi. I could make a strong argument against the federal poverty line being stright BS.
Do you know of any peer reviewed studies that performed a similar analysis on the same data that you used here?
A thorough and insightful analysis. Thank you for sharing your work.
If family structure is a key variable in explaining homicide rates, and family structure changed due to welfare reform in the 1960s, do you have any notion of the racial differences in homicide rates before welfare reforms were enacted? And if there are differences, how might they be explained?
I have read that the rate of single-parent families were roughly equal between black and white in the pre-WW2 era — maybe about 10-15%. And yet my understanding is that black homicide rates were higher than white rates. Is it possible that historically higher levels of black homicide could be explained by other factors such as poverty, for example, where the traditional family structure remained largely intact?
|| Is it possible that historically higher levels of black homicide could be explained by other factors such as poverty ||
LOL. So apparently poverty does not strongly correlate with [roughly] current differences between black-white/non-black homicide rates, but single-motherhood does. Yet you now are left with the task of explaining why the homicide rate for blacks was so much higher pre-1960s, particularly in the late 1800s, when presumably family structure was much stronger. Oh well, back to the poverty explanation… LOL
The amount of mental gymnastics required to “explain” something that is rather obvious. The only commonality that one can see here is that the population in question is black, and that crime correlates with them wherever they go. The significantly lower immigrant black crime rate can easily be explained by the selective cognitive/behavioral traits that will be required to immigrate to the States. Even with the lower educated strata amongst this group, they are not likely to be typical. To view the “typical” example of these immigrants, look to their home countries, where homicide rates are… through the roof. Plus you will have to wait to see the 2nd and 3rd generations and how they pan out amongst these immigrant groups. Regression to the mean, and all that.
And as someone else has pointed out, you have a few societies with rather frequent single-motherhood. They do not experience the utterly crazy homicide levels that are seen amongst black Americans. And even with all this, surely some West African societies have stronger family structures and better community links than US blacks. So why do they have such high homicide rates? The major link between the two societies is genetic; they are culturally separated by 400+ years.
At some point you just need to get real. Been hearing one or more excuses for some 20 years now. BTW, we see similar crime rate differentials between black/non-black communities in Europe and the UK, where there was very little slavery, mainly arriving by way of immigration. So what links them to Afro-Americans?
It’s all very tiresome.
Its just density and rainfall
https://www.huduser.gov/portal/periodicals/em/summer16/highlight2.html
“Racially and ethnically segregated neighborhoods also tend to have higher rates of violent crime. Peterson and Krivo”s analysis of nationwide neighborhood crime data for the year 2000 demonstrates, however, that violent crime rates in predominantly African-American and Latino neighborhoods differ little from predominantly white neighborhoods after controlling for segregation and disadvantage. In particular, spatial disadvantage — that is, adverse characteristics such as poverty or crime among nearby neighborhoods — appears to drive disparities in local crime rates between these neighborhoods.45 As Pattillo-McCoy writes, crime from disadvantaged areas in Chicago often spills over into middle-class, predominantly African-American neighborhoods.46 Moreover, the effects of citywide segregation extend beyond majority-minority neighborhoods: neighborhoods nationwide, regardless of their racial composition, tend to experience higher rates of violent crime when they are located in cities with higher levels of segregation.47”
There is this claim by leftists that its not poverty per se, but rather small very poor cramped neighborhoods that create crime and that if you look at similar neighborhoods the homicide level is similar. This contradicts the data that shows that even very wealthy blacks comit more crimes then poor whites, but I guess the claim would go that wealthy blacks still tend to live in these segregated poor areas?
This whole thing is nonsensical- it leaves out the notion that these patterns are multi generational- ie. Blacks who have managed to escape poverty today come from likely 8 + generations of poverty, stolen educations, and forcibly separated families. Compared to whites that likely come from 8 of middle class, educated, full families.
This whole thing implies that the data from the past decade is all that matters (in most cases above), and that generational tradition and culturally informed norms don’t play any part. Norms based in hundreds of years of slavery then segregation and racism is just ignored. We all know it’s better today, but we are trying to heal 100’s of year here. Not just the 90’s….
This is dumb, and I wasted a long time reading it trying to understand this view. But this and other glaring holes make it all nonsense.
I’m not entirely convinced this hypothesis is correct. Still, that is entirely besides the point of this post. This old post specifically (1) points out that the gaps in violent crime are very large and (2) refutes the argument that it is substantially explained by differences in material (economic) circumstances.
I have often heard it argued that the gaps are modest and that they are entirely explained by economic factors like current-day income levels (individual and/or neighborhood). Such views are plainly wildly at odds with reality. It’s also one of the few areas where I hold out some hope for material improvement. Whatever the original cause(s), it is my position that this is probably the biggest and most consequential issue for blacks today.
It is important to have an accurate understanding of the current day. Recent movements like BLM and the broader de-policing movement are profoundly misguided with massive negative effects in the short (see the recent large increase in homicides) and, very likely, the long run. In my view, popular support for these movements stems substantially (not entirely) from failure to understand these key issues. The arguable historical origins of these behavioral differences aren’t necessarily particularly relevant for the situation we find ourselves in today. They certainly do not falsify the objective reality that we must contend with.
Even with regards to the specific narrower concerns popularized by BLM vis-a-vis police excess, I believe the advocates would be much better served if they had a realistic view, along the lines of what I discussed in this post. It’s very likely the racial disparities in police shootings are quite well explained by even larger disparities in crime, which effectively necessities increased policing, which increases contact with police, and so on (never mind potential behavioral differences when contact is made). However, the focus on disparities per se rather than the actual outcomes for blacks, as in, shootings, armed or unarmed, is counterproductive if there is potential for improvement in policing that may benefit all groups (e.g., better hiring, training, funding, etc).
I understand some people are uncomfortable talking about these things. I am too. Nonetheless, I increasingly believe the avoidance of objective reality, even outright lying, and obfuscation, has done blacks and the larger society a real disservice. I believe most of the other side of this issue is sincere and means well. Still, they’re wrong on the facts, and, in my opinion, ultimately strategically wrong if their intent is to create material improvement for blacks.
It is crazy that so many are deluded and the current culture near exclusively embraces the delusion. As if most of the world has gone insane and is reflexively hostile towards any challenging of the delusion. Scientists, researchers, academics, politicians, ordinary people censured, penalized, fired, hit with death threats if dare speak truths. I call it “The Great Lie”, playing off the labeling of Trump’s stolen election lie. The two are remarkably similar in nature. People beloved false claims about the election and rioted. People believed false claims such as the claim that Michael Brown had his hands up and rioted. In fact, BLM was created over that lie.
“Woke” is actually asleep. It is sleeping denial of the truths about race. It lashes out wildly at any attempt to interrupt the lazy slumber.
Somewhat understandable though, given that this might be a largely racial (root biological) problem, rather than something sociological or cultural. The latter can be fixed. You can really only mitigate the former, and there’s an issue that you will really not want it to spread beyond the problem population in question.
However I agree the zero accountability “solution” as championed by leftist organizations is utterly disastrous and completely the wrong way to approach this tricky subject.
It’s a big problem though. If it was just dumbness, then it’s not the end of the world. But this particular problem results in the trashing or un-liveability of an entire area/city.
“We are unlikely to fix problems we are rarely willing to even acknowledge exist and, in the rare movements we do, delusionally assert causes to them that are reasonably known to be false”. Amen,,,
Hi, I found this very interesting – it is hard to find an analysis of the same topic and it changed my opinion about the impact of wealth. Have you looked at the relation of population density to this – since white people tend to live in more rural areas, and black people more often in cities? My understanding is that cities tend to have higher crime (I’m also not a statistician). I think poverty, income, house cost and education are probably(?) more related to each other than population density so there might be a greater association when combined
Cities with few blacks tend to be safer (even than a lot of rural areas) if you look at per capita crime. Even rural type areas in Arkansas with lots of blacks (as a %) tend to be quite dangerous or very dangerous. Tbh you only need to look at homicide rate by county/area and notice that it correlates heavily with where black folks live.
Plus I’m not sure that being “rural” necessarily means being “safe”. If you strip out other populations and just look at whites, some of their most dangerous populations (homicide rate per capita) tends to be in Appalachian areas or WV. Not exactly bustling cities. So I feel the pop dens explanations are hogwash. Police forces and judicial systems tend to be more developed in built up areas anyway. The only places that experience a break-down in such systems, where criminals go wilding for fun, once again tend to have a large % of the offences committed by blacks e.g. NY, LA, New Orleans, Philly etc.
One thing you don’t adjust for is age of the population. The large majority of homicides are committed by 17-34 year olds, regardless of race or ethnicity.
Actually, I did. I used county-level age-adjusted homicide rates published by the CDC for my analysis in this post. Although these are technically homicide victims, there is a close relationship between victim and offender ages as victims are usually killed by similarly aged offenders that they know.
Also, while age adjustment has some effect, this effect is much smaller than some people believe, as the B-W differences in age structure are relatively modest. For example, in 2020-2021, the male B-W homicide ratio was 13.7 on crude rates, whereas it was 12.8 on age-adjusted rates. This is not nothing, but it hardly alters the substantive conclusion that group differences are non-trivial when the differences in rates are at least an order of magnitude.
Some people seem confused by large reported differences in modal ages, but such differences poorly reflect differences in the actual age distributions.
Moreover, while I agree that age is a powerful determinant of the risk of offending and victimization here, along with gender (!!!), the B-W differences are very significant across nearly all of the age distribution. For example, in 2020-2021, 15-34 year-old white men had a homicide victimization rate of 6.2 per 100,000, whereas the victimization rate of 65-74 year-old black men was was nearly twice as high at 12.2..
Most individuals in most groups are not killers, including young black men. However, the risks are very different across demographic groups. Race is one of those factors, particularly amongst blacks, though one can also find non-trivial differences between Whites and Asians, for example. These gaps have particular significance when we talk about related disparities, such as rates of incarceration or police shootings.
If these disparities were as widely understood and appreciated as those for age and gender, we might have avoided making a series of unforced errors in 2014 (Ferguson) and 2020 (Floyd) that caused car accident deaths and homicide rates to reverse sustained multi-decade declines and skyrocket around May 2020. We do not protest the disparities in incarceration or police shootings for young people or males because we understand them to relate to stubborn social facts, whatever their biological basis and that discrimination is unlikely to explain much.
One need not necessarily accept that these group differences are substantially innate to recognize that these differences in violent crime and related issues are both real and highly consequential. These disparities are unlikely to be explained away by bias in policing or the criminal justice system, and they are unlikely to disappear any time soon, given how long such disparities have existed. Even if one hopes that these particular ratios will converge on one soon, i.e., no disparity, we still need police and an effective criminal justice system in the here and now.
On the other hand, the focus on group disparities as ratios instead of pursuing general improvement has led us in counterproductive directions. Rates are apt to be much more socially malleable and practically significant than group ratios. Murder, car accident deaths, policing shootings, and more have declined substantially over several decades despite little to no change in most of these ratios. Since 2014 and the shift in sentiment vis-a-vis policing, criminal justice, systemic racism, and related themes, however, many of these rates have substantially worsened. I am also quite confident that most of these ratios increased correspondingly, i.e., more male, male black, and more towards young people (15-34).
The National gang Center has demographic profiles of street gang members, which have found to closely map to firearm homicide rates.
http://www.gunfacts.info/wp-content/uploads/2022/11/CRIME-AND-GUNS-Firearm-Homicides-in-the-U.S.-by-age-race-urbanization-2016-d.png
I would love to see a couple of more charts that do the following:
1) Map degree of urbanization as a disaggregated variable.
2) Map the aggregated, primary demographic factors of gang participation (age, race, urbanization) and again with single-parent households.
This is an interesting analysis, but what is your ultimate goal? Is this a hobby project? Do you desire to contribute to the body of scientific knowledge? If the latter, you would be better served reformatting this as a manuscript and submitting for publication in a peer-reviewed journal. Otherwise, this is not systematic and rigorous enough to merit consideration as “objective facts” or “the reality of the issue itself”, though certainly it serves as a basis for interesting online discussion.
Heads up, the Reddit admins must have been sent into a seething rage by this article since they have banned your entire domain from Reddit – any posts or comments linking to this site get removed automatically. Good work on chasing the facts.