Racial differences in homicide rates are poorly explained by economics

There are large racial differences in the homicide rates in the United States.  The FBI and other government organizations are not always forthcoming with detailed data, but you can quite readily estimate it (approximately) with the victimization/mortality data from the CDC and other sources (most crimes being committed intra-racially)

avg_hom_rate_nat

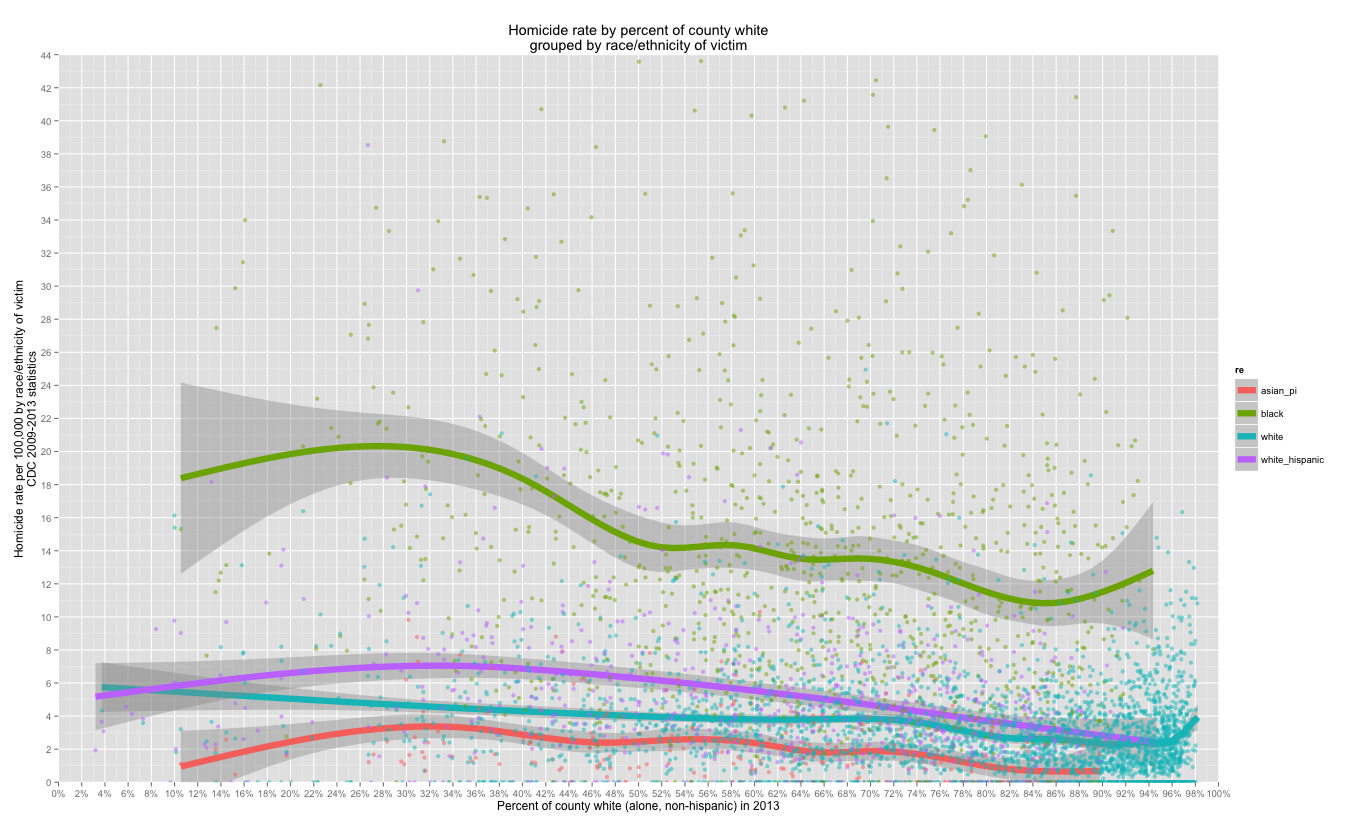
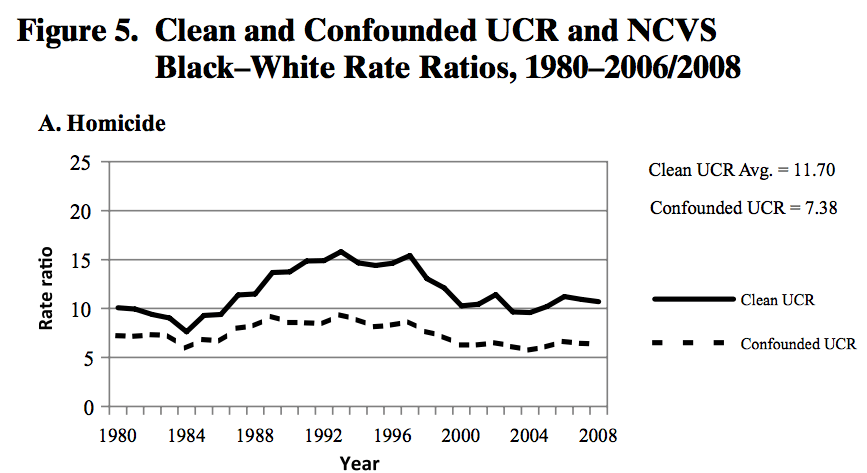
The black homicide rate is about 10 times higher than the white rate. It has been this way for quite some time (i.e., even as the rates have changed the differences themselves have remained fairly stable).

Google Chrome


Similar patterns can be found elsewhere, but I find the homicide statistic useful and interesting for many different reasons, namely:

On the relationship between school suspensions, race, single-motherhood, and more.

As a follow up to my prior post on single-motherhood and mobility and in response to various assertions of discrimination against blacks in the school system, I decided to take a data-driven look into the relationship between race and school suspension rates.


There is, of course, ample evidence that discipline rates vary dramatically between racial/ethnic groups.

Microsoft Excel

Blacks get suspended at vastly disproportionate rates whereas “asians” (census/OMB definition), on the other hand, are about half as likely as whites are to get suspended.  Contrary to conventional wisdom, though, this pattern tends to be pretty consistent nation wide and the south is not notably “worse” with respect to disparities here.

County level homicide rates by race/ethnicity of victim

In my last post, I plotted the overall US county-level homicide rate (all groups combined) by racial/ethnic demographics.  Much of that correlation is being driven by high black-on-black homicide rates throughout the country.

If I plot the rate by the race/ethnicity of the victim this pattern becomes clear and the group-level correlation weaken somewhat (especially asians and whites), but it’s still there…

hom_by_pct_black_grp_by_re

hom_by_pct_not_white_not_asian_grp_by_re

A quick post on gun related homicides

While I am personally ambivalent about gun ownership and suspect it plays an incremental role in relative differences between countries/regions/etc (holding other things roughly equal), I thought I’d add some perspective into this argument about the presumed causality of gun ownership on homicide rates.

Mother Jones analysis includes gun suicides and makes no attempt to correct for even course-grain racial/ethnic confounds.


I downloaded the 2009-2013 data for gun-related homicides by race/ethnicity from the CDC’s WONDER database  and compared it to the gun ownership rate data via wikipedia.

gundeaths_by_gunownership

I do not feel like doing a lengthy analysis here and now, but suffice it to say that once you remove suicides and race/ethnicity from the equation the case gets much weaker.

There is no evidence of a positive correlation here for blacks and hispanics (if anything somewhat negative).

There is a positive correlation for non-hispanic whites (r=0.45), but it pales in comparison to the racial/ethnic differences here.  To put this into perspective, amongst non-hispanic whites (the bulk of the gun owners in most states), states with the highest gun ownership rates have just 1 death per 100,000 more than states with the lowest rates (on average).