There are a large and growing number of popular media articles alleging racial discrimination in the mortgage market. It is simply assumed that if lenders are less willing to extend credit to blacks or make loans in “black neighborhoods” as often or with similarly favorable terms as they do whites or “white neighborhoods” that this apt to be explained by explicit racism or (subconscious) bias. These naive arguments persist despite tremendous evidence that there are observable and unobservable differences that have profound effects on credit risk.
I will briefly describe some of this evidence before making my own modest contribution using data from zillow.com and the US census. You can click here if you are familiar with this literature already and wish to skip ahead to my analysis.
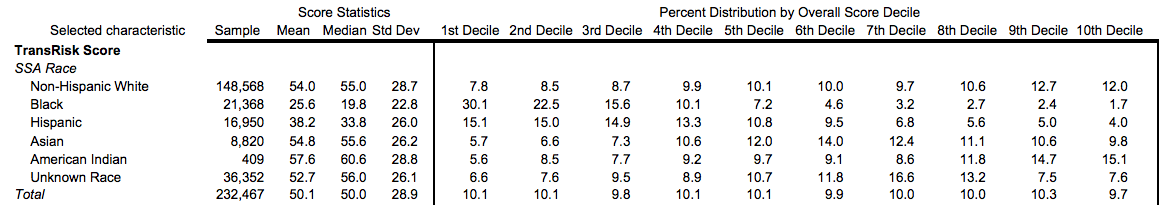
1- Blacks have much lower credit scores (e.g., FICO)
source
The difference in between the white and black means is about 1 standard deviation.
2 – Credit scores systematically over-predict black loan performance relative to whites
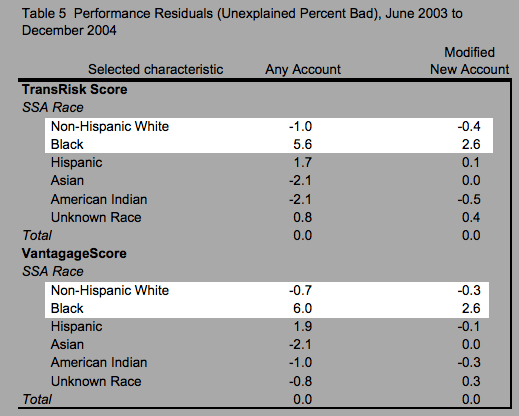
They do significantly worse than credit scores alone would predict (which are already below the white average).
3- These residuals are found throughout the entire credit distribution.

At any given (initial) credit score loans to blacks are significantly more likely to go bad. Further controlling for age, marital status, and even census tract still leaves a significant residual.


source
4- There are large differences in loan performance across all major credit categories
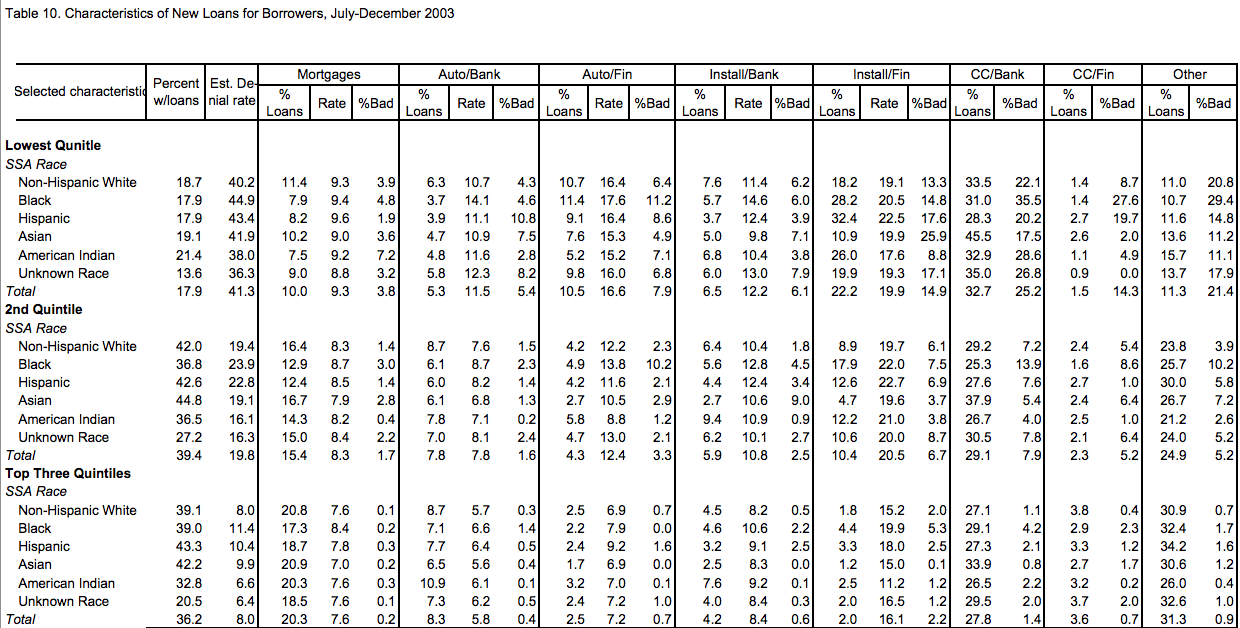

This clearly is not just a problem pertaining to mortgage lending and the history associated with housing (e.g., redlining). It extends across all forms of credit.
5- There are large differences in adult numeracy and literacy (even controlling for education)


The PIAAC data suggests that white adults with just high school diplomas are about as numerate and as literate as black adults with bachelor degrees. This is a really dramatic difference. Similar results are found elsewhere (I like PIAAC here because it was designed for international comparisons and it’s subject specific)
Other things being equal, people that are less numerate and less literate are less likely to make good financial decisions, i.e., they are more likely to over-spend, more likely to accept loans with less than optimal credit terms, and otherwise more likely to mismanage their financial affairs (these relationships are even found in some less obvious areas like health)
6- Basic personal finance practices vary significantly
Differences in numeracy and literacy are apt to at least partially explain differences in key financial skills, management of bank accounts, etc.


7. There are stark racial differences in bank usage


Blacks are more than 400% more likely to be “unbanked” and twice as likely to be “underbanked” relative to non-hispanic whites. This isn’t likely to be well explained by income differences (see the income section) or even wealth. These are rudimentary differences.
8. Differences in financial health exist amongst highly educated (credentialed)

9. Mortgages made in areas with more poorly performing loans default more often
Considerable research documents the negative externalities neighborhoods experience from foreclosures, particularly in terms of the values of nearby housing (e.g., Campbell et al., 2009; Rogers and Winter, 2009; Schuetz et al., 2008). The literature also shows that nearby foreclosures can lead to a heightened probability of default or foreclosure, for a number of reasons (see Campbell et al., 2009; Harding et al., 2009; Hartley, 2010; Immergluck and Smith, 2006; Ioannides, 2003; Lee, 2008; Leonard and Murdoch, 2009; Lin et al., 2009). Negative physical externalities caused by foreclosures, including visible deterioration, maintenance deferral or vandalism, may cause declines in neighboring home values causing potential homebuyers to view the neighborhood as less attractive. Foreclosure-induced mobility may increase the number of homes on the market, and thereby drive prices down. Further, the sale of foreclosed properties at discounted prices may lower property appraisals and sellers’ reservation prices for nearby properties.
[snip]Regarding the role of neighborhood characteristics in non-prime mortgage default risk, we uncover several new facts. First, default rates increase as the rate of foreclosure notices and the number of REOs in the neighborhood increases, even after controlling for a rich set of loan and borrower risk characteristics. We argue that this likely reflects a contagion effect, or that foreclosure and REO rates may be serving as proxies for weak neighborhood housing market conditions that are not already captured in the community district level price indices. At first blush, it seems hardly surprising that defaults are higher in high foreclosure and REO areas. However, what we have shown is that this effect is happening at an extremely local level. Our estimates remain large and significant when we include fixed effects for calendar year interacted with the 56 community districts in our New York City sample.
In short, making loans in struggling neighborhoods adds appreciably to mortgage risk even with extensive controls for individual and loan characteristics.
10. Black neighborhoods are associated with increased lending risk (negative externalities)
We find that borrowers in predominantly black neighborhoods also have higher default rates, regardless of race, even after controlling for a host of other borrower, loan, and neighborhood characteristics. The most obvious interpretation of this finding is that the share of black residents is proxying for unobserved borrower and loan characteristics common in those neighborhoods that are correlated with higher default rates.
But these unobservables must be ones that apply only to home purchase and not to refinance borrowers, because we find no neighborhood racial composition effect for the latter. In considering plausible candidates for such unobservables, it is useful to divide them into (i) factors that lenders and others involved in the loan’s origination know (or can learn) and that may be used to treat borrowers in black neighborhoods differently from borrowers in other neighborhoods, and (ii) factors that are not known to lenders and others.
In the first category, variations in lending and underwriting practices across census tracts that are unobserved in our data could lead to systematically different borrower and loan characteristics in certain tracts. For example, if underwriters used less stringent or improper standards for mortgage applicants in black neighborhoods, then borrowers in those neighborhoods likely would have relatively higher default risk, even after controlling for FICO scores and other observable risk factors.
[snip] Another possibility is that borrowers in black neighborhoods were more likely to use a mortgage broker, perhaps due to relatively limited financial sophistication or just limited access to local bank branches that makes it more costly to shop around for a mortgage. While we cannot discern the use of brokers in our data, others have found that loans involving brokers are more likely to enter default (Coulton et al., 2008; Laderman and Reid,
2008).
source
11. Black neighborhoods appreciate less
While much of neighborhood appreciation inequality is explained
by nonracial (particularly socioeconomic) factors, minority composition continues to exert a significant effect on appreciation even net of these considerations, particularly in highly segregated communities and those that experience large increases in black representation.
source

12. Crime, especially violent crime, reduces housing appreciation.
Having crime and housing data over time, we are also able to capture the impact both of levels of crime as well as changes in crime. Controlling for structural housing and neighborhood characteristics, housing prices in a low-income neighborhood with one additional violent crime per thousand (level) are on average 1.1 percent lower. The average housing price in low-income neighborhoods is $88,170, so this represents a loss in value of $970. Controlling for the same factors, a house in a low-income neighborhood with an increase (change) of one more crime per thousand has on average 3.6% lower housing prices. This represents a loss in value of $3,174. The total loss due to one addition crime per 1,000 is $4,144 in these neighborhoods.
source
13. Perceived school quality effects housing values
The three studies surveyed in this review yield many similar conclusions regarding which school attributes influence house prices. First, homebuyers are concerned about changes in the demographic makeup of the local school, in addition to, and sometimes more than, test scores when deciding how much to spend on a home. Second, two sources agreed that prospective homebuyers do not measure school quality in the same value-added way that researchers might. Instead, they rely on many observable factors, such as demographics of their peer groups, to measure school quality.
And third, it would be interesting to see if the way homebuyers measure school quality will change as school performances on standardized tests are made more public. One source was able to confirm that this is the case, while yet another suggested it without providing statistical verification. All of this leads to the question of whether homebuyers actually cared more about certain observable demographic factors or if they just used them as indicators because they were more easily accessed. The decline in the use of certain demographic factors as key indicators may also suggest changing opinions regarding race that would be interesting to explore.
source
14. Neighborhoods with larger black populations are associated with worse outcomes across multiple measures here
Black neighborhoods are associated with much higher homicide rates, more discipline problems in schools, higher rates of other violent crimes, worse academic outcomes (test scores), and so on and so forth. Most of this is fairly common knowledge (even if deeply un-PC), but many people (1) underestimate these differences (2) do not appreciate that these factors are likely to have uniquely depressive effect on black housing markets and (3) few understand that large statistically significant differences remain even after extensive controls for socio-economic status (SES) and the like. Family formation differences can help “explain” at least some of this, but these sorts of things are rarely taken into account when we talk about racial discrimination in the mortgage industry.
15. Racial demographics correlate with subjective and objective neighborhood satisfaction for all groups
However, after accounting for community social characteristics, distinct effects of racial/ethnic composition persist, supporting the idea that there is something about race, above and beyond social class, that propels neighborhood satisfaction. In the full sample of respondents, whites report less satisfaction in neighborhoods with higher proportions of minority residents, and their dissatisfaction is diminished by perceived and observed social conditions in only trivial ways. Even after accounting for local social characteristics, Latinos report lower levels of satisfaction in neighborhoods with higher proportions of Latinos or African Americans. Further, African Americans report lower levels of satisfaction when they live with Latinos, and they report the least satisfaction in neighborhoods where they live with the fewest blacks, despite the better socioeconomic conditions and fewer social problems present these neighborhoods.
source
16. There are pronounced differences in spending and investing habits
The racial difference in visible expenditures is large in absolute dollars. Appendix Table A4 shows that, on average, Whites spend about $7,204 on visible items per year. The finding that Blacks and Hispanics spend 32 percent more than comparable Whites on visible goods therefore implies that Blacks and Hispanics spend on average roughly $2,300 per year more on visible goods than their White counterparts. This estimate is likely a lower bound given that the CEX has been found to under report total household consumption relative to data from the National Income and Product Accounts. To put these magnitudes in perspective, data from the March CPS shows that, for the 1990-2002 period, Black and Hispanic households had average incomes, respectively, of $42,500 and $48,300 in 2005 dollars. Outlays on visible goods thus represent a substantial fraction of the overall budget of minorities.
[snip] We find racial differences in visible consumption within all educational groups, although the magnitudes of the differences vary slightly for different education levels. Black households headed by someone with only a high school degree consume 38 percent more visible goods than a comparable White household, conditional on income, total expenditure and demographics. The comparable Black-White gap in visible expenditures for households headed by someone with at least a college degree is 28 percent.
[snip] We argue that one does not need to appeal to cultural differences or racial differences in preferences to understand this evidence. We present a theoretical treatment of status-seeking and conspicuous consumption. A large subset of such models shares the prediction that visible consumption should vary negatively with the mean income of the individual’s reference group. We show that visible consumption patterns both within and across races are consistent with this prediction. It is important to note, however, that there may yet be racial differences in utility parameters which act in combination with the effects we have identified.
source
17. There are substantial differences in wealth

Although, contrary to some people, it not likely to be well explained by inheritances or inter-vivo transfers. The vast majority of these differences can be explained by observable differences:
The findings suggest that nearly all of the Hispanic/white wealth gap at the mean and the median of the distribution can be accounted for by differences in observable traits, with basic demographic characteristics and educational attainment making up most of the gap. Also, most of the white/Black wealth gap can be accounted for by differences in observable characteristics, particularly basic demographic traits and homeownership. Using the full set of observable characteristics discussed in this paper, including home ownership and usual income, we can account for 80 percent of the observed wealth differences between white and black families.
source
This systemic capital deficiency is apt to contribute independently to credit risk (although it’s also reflecting endogenous differences in savings and consumption behaviors).

18. Even blacks with similar/high net-worth behave quite differently
Wealthy blacks (top 5%) of similar wealth and demographic profile invest far more conservatively.

source
Despite high net worth, similar age, and business ownership rates between these groups, wealthy blacks invest far less in their businesses as a proportion of their net worth:
Wealthy black Americans are less likely to hold equity in business assets. Looking at this group’s non-financial assets, 9% are equity in business assets. That figure is 37% for comparably wealthy whites. The numbers are similarly stark if you look at this as a percentage of total assets: 21% of the wealthy whites’ total assets are invested in their own businesses, versus just 6% for wealthy blacks. Because both groups are equally likely to run their own companies – 23% in both cases – the researchers calculate that this means white business owners are investing in their businesses at a rate 7 times higher than black business owners. In raw dollar terms, it means that black business owners have about $68k in their businesses, while white business owners have roughly $468k.
source
And they invest a much higher proportion of their net-worth in non-financial assets (especially homes)
Among non-financial assets, the two main differences between the top 5% of African-Americans and the white comparison group are significantly less equity in business assets1 —9% of non-financial assets for the top 5% of African-Americans versus 37% for the white comparable group—but a higher level of investment in real estate outside the primary home—41% of non-financial assets versus 22%, respectively.
This sort of behavior helps explain differences in the wealth gaps and tends to support the notion that there are deeper seated differences that are not well explained with crude observables like individual income, wealth, etc.
19. Differences in time preference may explain much of this
The present study demonstrated, using meta-analytic techniques, that individuals with higher intelligence demonstrate significantly less of a tendency to prefer smaller, sooner rewards to larger, later ones. This association was present to a small-to-moderate degree in the 24 eligible research reports (comprising 26 independent effect sizes) that we gathered via a systematic search of the literature.
[snip]Other moderator tests that we conducted were significant only under liberal, fixed effects assumptions. We discuss these effects primarily to describe the studies within the present meta-analysis. Studies involving participants of lower socioeconomic status showed weaker associations between DD [“delay discounting”] and intelligence. Given evidence that economic scarcity can influence discount rates (Ostaszewski,Green & Myerson, 1998), it makes sense that, for those under greater economic hardship, intelligence matters less in determining DD preferences than it does for people of greater financial means. It is possible that this effect would have held up in more conservative analyses if relevant information had been presented in more of the studies. Additionally, effect sizes were larger for samples of higher mean IQ, although the reason for such a relation is uncertain.
[snip]Our findings also have possible implications for phenomena with broad social impact. For example, because burdensome levels of credit card debt and insufficient retirement savings may stem in part from higher DD (Angeletos et al., 2001; Bar-Gill, 2004), individuals with lower intelligence may be more prone to these financial hardships. Forthcoming work by Benjamin, Brown, and Shapiro (2006) supports this possibility with evidence that individuals with lower intelligence tend to have lower levels of financial asset accumulation, controlling for income. Therefore, DD may represent a critical variable through which intelligence influences important economic outcomes (cf. Heckman, 2007).
In summary, individual differences in the tendency to prefer smaller, sooner rewards to larger, later ones are associated with intelligence. This result also suggests that DD reflects not only motivational processes, but also cognitive abilities that critically influence the formation or integration of preferences. The consistency and magnitude of the association evince the necessity for further work to determine its bases. Although we explored several moderators, the range of possible reasons for the relation underscores the need for empirical tests. We hope that the present investigation will prompt such research, guided by the findings that we have presented.
Black-white differences in general cognitive ability (aka “intelligence”) within the United States are well established, even if there is dispute over the causes (nature vs nurture), but there is also direct evidence for time-preference differences between racial groups. In fact, even controlling for cognitive ability and SES, these differences remain significant.
Most importantly, even controlling for risk, boys and black children have significantly higher discount rates. Note that, as suggested by Anderson et al. (2008), controlling for risk preferences reduces the estimates of elicited discount rates. The coefficient estimates in column 3 are roughly a third of the size of the estimates in column 2. Nevertheless, controlling for risk does not alter the relative differences across sex and race: boys and black children have significantly higher discount rates.
A final robustness check controls for socio-economic background and measures of cognitive ability in math and reading (Table 6). Cognitive ability may play a role in determining discount rates, as well as in our ability to measure them accurately through an experimental procedure (Benjamin et al., 2006; Burks et al, 2009; Dohmen et al., 2011). Indeed, if cognitive ability makes people more patience, then including cognitive ability on the right-hand side would bias our results on sex and race towards no effect.
[snip]Only the covariates for male, black and math ability are statistically different from zero (children with higher math scores have smaller discount rates). The coefficients on male and black are smaller than in the first set of regressions, consistent with cognitive ability biasing estimates downwards. The census variables are insignificant.
In sum, our main results that boys are more impatient than girls and black children are more impatient than white children are robust to controls for risk aversion, cognitive ability and socio-economic characteristics.
[snip] We find a high degree of heterogeneity in children’s preferences, but more so among black children who are overrepresented among children with extremely high discount rates.Most importantly, our research shows that experimentally-elicited measures of time preferences are correlated with disciplinary referrals, even controlling for other covariates such as demographics, measures of cognitive ability and school effects. Disciplinary referrals have been show to predict economic outcomes, such as dropping out of school and lower wages later in life. A one standard deviation increase in the discount rate increases disciplinary referrals in 9th grade by 14.3%. To our knowledge, this is the first experimental work on time preferences among children that provides evidence of a relationship between preferences and outcomes.
source
20. There are significant differences in typical LTVs and debt-to-income ratios in mortgage borrowing


source
Blacks are significantly to more likely to make small down-payments and have higher loan-to-income ratios despite worse average credit records and less stability of income.
21. Black employment tend to be shakier

source
Summary of existing data
These are just some elements that are apt to make blacks and, especially, “black neighborhoods” statistically worse credit risks, especially for mortgage lending given its larger exposure to community externalities (a confluence of factors). Much of this can be explained with readily observable differences in individual and neighborhood characteristics (e.g., income, social characteristics, historical neighborhood patterns, cognitive ability, etc), but most analyses claiming racial discrimination on the part of lenders fails to take these issues very seriously.
The legal theory of “disparate impact” allows government regulators and non-government plaintiffs to successfully sue lenders if their policies are found to have a disparate impact on minority groups (especially blacks). Plaintiffs do not need to prove the lenders had intended to discriminate. It does not even much matter if the lenders can demonstrate that their risk-models are accurately pricing risk within and across groups. Therefore, pointing to settlements as evidence of racial discrimination is a mistake because the evidentiary bar is very low, litigation is very expensive, and the federal government (in particular) has a big war chest. So long as the government/plaintiffs can establish disparate impact, settling is often the only rational course.
My data analysis of zillow’s data
With all of this in mind, I would expect there to be a strong relationship between racial demographics and housing market characteristics nationally. For example, racial demographics should explain a substantial fraction of the variance in loan-to-value (LTV) statistics at a neighborhood-level nationwide even today and this difference should also be robust to controls for socio-economic status.
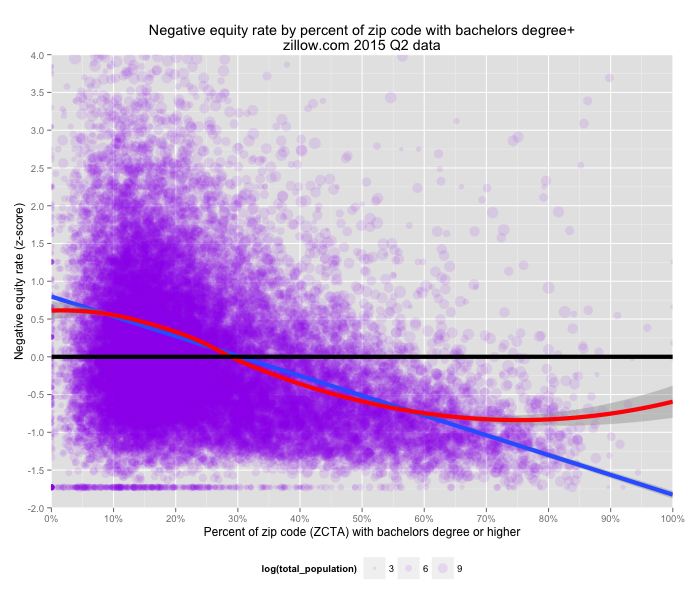
I can do this with zillow.com’s data for negative equity rates (fraction of housing in each zip code that are “underwater”) and various LTV threshold percentages at a zip code level (2015 Q3) along with recent census demographic data at a zip-code tabulation area level (ZTCA, a census concept that generally mirrors zip codes well for these purposes). Zillow.com doesn’t cover 100% of all zip codes (mostly seems to exclude some rural areas with small populations) but the combined data allows me to get a decent snapshot of the vast majority of the country’s housing market (especially in dollar terms).** According to the 2010 census estimates zillow’s set of zip codes comprise 93% of the US population, so it’s safe to say that this is generally representative of the vast majority of the United States housing market.
Descriptive statistics


With the negative equity rate (“NER”) the strongest weighted correlations are, in rough order: family structure, unemployment, percent black, education (bachelor degree rate), followed by the various measures of income.

There is a roughly linear and continuous relationship between percent black and negative equity rates. Transitioning from 0% to 100% black corresponds to a bit more than a two standard deviation increase in negative equity rates (using weighted regressions). This suggests that race-alone has tremendous practical significance.
We find much more modest associations with latinos despite their broadly similar economic profile and general “minority” status (at least we do prior to controls!).

Asians are associated with substantially safer LTV levels (larger equity cushion).

Whites, likewise, but to a lesser degree than asians.

Although these correlations are potentially mediated by other variables (e.g., state/regional differences, income levels, etc), they are very much consistent with the sorts of behavioral patterns I mentioned above.
I will also briefly plot some of the stronger predictors to give a better sense for the relative magnitude of the impacts of racial demographics here.


Modeling exercises
In this first set of models I scaled both the dependent and independent variables. In model 1 I control for black alone and find that 1 SD increase in black is associated with a 0.37 SD increase in negative equity rates. In model 2 I introduce other major racial groups into the mix (latinos and asians) with similar results.

Adding further controls for poverty (model 3), single-mothers (model 4), and both together (model 5) reduces the association with black by ~46 percent.
However, single-motherhood is a stronger predictor than percent black in scaled terms and it’s a stronger predictor than the poverty rates too. I mention this because I also found it to be a stronger predictor than race for “causal” economic mobility, school suspensions, homicide rates, and more.
In fact, let’s briefly compare these two variables side-by-side:

As you can see, single-motherhood alone is a significantly stronger predictor than black and mediates much of the association with black here too.
Now let’s try some with more traditional SES variables like education rates, poverty, income, employment rates, etc.

Even in model 4, race (especially black) is still very much significant despite the fact that people in other contexts might accuse me of “over-controlling”. On the other hand, single-motherhood, mean household income, and poverty rates lose much of their potency in model 4 (education and unemployment rates seem to be doing much of that work).
The addition of state fixed effects to account for regional/state differences in real estate markets, as in model (2), actually increases the association with percent black and significantly improves the model fit.

In the next table I will leave the race variables unscaled to compare their effective magnitudes (as in, how much does an X percentage point increase in black over white increase negative equity rates?)

In model 1, which controls only for race/ethnicity, transitioning from a 100% white to a 100% black zip code corresponds to about a 2 SD increase in expected negative equity rates (or at least it did in Q2 2015). In model 3, with extensive controls for income, education, employment, ownership rates, family formation, and state fixed effects, I find this gap is cut almost in half. However, that still leaves a bit more than a 1 SD black-white gap. The same is true for latinos but the magnitude of these differences are quite a bit smaller.
You might also note that in the model 1 there is a large white-asian gap (asian being associated with stronger housing markets) and that there still remains a statistically significant difference in model 3. I don’t think the “model minority myth” is apt to explain this and these ordinal patterns in the residuals, i.e., asians > whites > latinos > blacks, are consistent with a great deal of other data like credit scores, default rates, banking habits, income, cognitive ability measures, school test scores, school discipline, crime, and much more.
The results with the effective negative equity rate (LTV >80%) are pretty similar (albeit noisier).

If I inspect higher LTVs (>=140%) though the patterns are even more pronounced.

Zillow’s market health data provides some clues as to why we find these patterns (albeit with about half as many zip codes in that set).

The relationship between percent black and delinquency rates appears to be roughly linear and 100% black zip codes can be expected to have delinquency rates almost 2 standard deviations above average.
Foreclosure ratios (z-scores) also increase significantly.


These differences are practically significant. If we setup a reasonable model to “predict” mortgage delinquency risk without the use of race (or other variables that are thought to be particularly strongly associated with the black community), one without state fixed effects (1) and the other with (2):


In both cases, it is clear that black still predicts significantly higher risks and that it does so in a generally linear and continuous fashion.
Since some people have trouble interpreting the trend lines in scatterplots, you might think of it this way: if we divide the zip codes into intervals of percent black, every 20% (0.2), and take the population weighted average of those values, those average values will generally hue closely to the trend line above given the relatively large number of zips in most of these sets. While noise and other unobserved differences may leave us with plenty of uncertainty in the individual case or when n is small, as n increases the observed means will tend to converge on the expected value fairly quickly.

Lenders, insurance companies, and the like do enough transactions where their reality is much more akin to the plot above, i.e., even subtle differences in known risk profile are very likely to produce systematically better or worse aggregate outcomes for their bottom line in practice. While this is not a true forecast, it nonetheless remains the case that these black neighborhood perform much worse than expected (probably even more so if this were a true forward-looking prediction).
It’s highly unlikely that lenders incorporate race into their models because it is illegal (high risk of getting caught with steep consequences) and because it is deeply politically incorrect. However, they do not need to discriminate on race to end up with “disparate impact”. If their models are more sophisticated than this toy model and they have access to more data (surely the case) they are apt to pick up on things like historical experience in the area or mean current LTVs in the neighborhood (not to mention individual characteristics). Employing these sorts of predictors without reference to race is apt to have a “disparate impact” on blacks and reflect actual risk profile differences that would be borne out in reality without ever actually making any reference to racial demographics in model design (never mind the more obvious complaints that can be easily explained by individual characteristics, like credit scores, that are generally recognized, in principle, as being reasonable!).
It might be helpful to illustrate this with a specific state to see that this works at finer scale too. (note: I picked Maryland here because the article I linked to above talks about the greater Baltimore area and because it happens to have a large black population).


As you can probably tell, there is a fairly high degree of correlation between percent black and delinquent mortgages. These correlations are not limited to “inner city” (poor, urban, black) parts of Baltimore (city).

Much of it is in Prince George’s, Charles, and other generally suburban or, at least, non-inner-city parts of Baltimore and Washington (not to mention parts of the eastern shore).
While some of this racial correlation can be explained by SES measures (mean household income, poverty rates, education levels), surprisingly little of it actually is:

In fact, percent black “explains” the residuals (which are non-trivial) better than the SES-based predictions themselves:

This tends to suggest that this isn’t working mostly through the observable SES components themselves (and, mind you, I used recent, post-crash, income and poverty measures, i.e, after most of these loans were made…. so the downturn’s effect on income isn’t apt to explain it much either).
And let’s do California using a national multi-racial + median age model for grins:


Conclusion
Despite the abundance of data like this, despite the fact that approval rates are fairly similar, despite the existence of profound economic and educational differences, and despite the fact that the recent cohorts of black borrowers are generally somewhat greater credit risks across several obvious observable measures (e.g., credit scores, LTVs, loan-to-income, etc) there are still many presumably well-intentioned people demanding that our nation’s institutions expand credit to blacks and black communities much further still even today! They apparently believe that lending ought to closely reflect the population without regard to the proportions of even modestly qualified borrowers or the stability of the neighborhood the envisioned borrowers are apt to want to buy homes in.
Take but one example from this genre:
Whites in Baltimore City are approved for home purchase loans at a much higher rate than those in other racial groups; white borrowers receive 210 percent of the lending that their population size suggests they should. This is in stark contrast with African Americans, who received just 37 percent of the loans that they should have given their majority position in the population in 2013. But home lending is often more about the neighborhood than the borrowers themselves, and in Baltimore we find that the composition of the neighborhood is critical to understanding where lending happens.
[snip]Race was consistently the most significant predictor of mortgage
lending patterns in Baltimore City. The percentage of white residents of a neighborhood was significantly and positively correlated, while the percentage of black residents in a neighborhood was significantly and negatively correlated with the amount of loans approved in Baltimore between 2011 and 2013. In a regression analysis of demographic and socioeconomic factors including indicators of race, ethnicity, education and wealth, the percentage of white residents in a neighborhood was the most important factor in the prediction of lending volume, while percentage Asian and the median home value were significant, though less important, predictors in the model.
source
They include a crude multi-regression table to support their arguments:
You might note that they omit regression coefficients entirely and that they exclude many obviously relevant variables from the models (e.g., individual and neighborhood statistics on income, education, employment, etc, not to mention individual credit scores, LTVs, etc etc etc). I don’t want to get into the weeds with this particular “analysis”, but the point is simply this: there are a lot of crappy analyses out there that are being used to push the notion that lending bias is pervasive and that we need to vastly increase loans to blacks (and other “minority” groups) to fix this.
These misguided notions were particularly disastrous in the most recent housing bubble for minorities (especially blacks and hispanics). They make even less sense now. Whatever the long-term potential of the black and hispanics populations with respect to wealth, education, income stability, etc, it makes little sense to extort (or bribe) lenders into lending to poor credit risks just because they happen to be minorities. Tolerating high LTVs, high loan-to-income ratios, bad credit scores, shaky employment records, minimal liquid net worth, making loans in unstable neighborhoods, and so on even more than we already do is a recipe for disaster. That these poor credit risk individuals/communities happen to be disproportionately black or hispanic/latino does nothing to make the economic calculus more favorable for anyone (if anything, arguably, somewhat the reverse–see less stable employment etc).
Of course many people want to see blacks build wealth and generally adopt lifestyles more like the majority, but in order for comparable rates of home ownership to be a viable path to successful wealth building they first need to be much more comparably qualified than they are today. To do otherwise, to put the cart before the horse again (even further), will ultimately hurt minority groups far more than it is apt to help on aggregate. The loosening of standards to accomodate minority groups is also likely to spillover on to poor credit risks in other groups because these policies tend to have broader implications (i.e., they are often not narrowly targeted at particular minority communities).
Note:
** I used a cross-walk dataset to match (postal) zips to ZTCA and took the mean values just in case there were one-to-many relationships between ZTCAs and zip-codes. However, it turns that none of zillow’s zip code data have this potential issue.
Some food for thought


source


(Note: Even though these estimates are made with considerably less information than lenders have, the probability of blacks receiving a higher priced conventional loan was just 6% in 2006 after controls for individual and lender characteristics…..hardly the sort of difference that could explain disparities in delinquencies, defaults, etc)
