On the relationship between negative home owner equity and racial demographics

There are a large and growing number of popular media articles alleging racial discrimination in the mortgage market.   It is simply assumed that if lenders are less willing to extend credit to blacks or make loans in “black neighborhoods” as often or with similarly favorable terms as they do whites or “white neighborhoods” that this apt to be explained by explicit racism or (subconscious) bias.  These naive arguments persist despite tremendous evidence that there are observable and unobservable differences that have profound effects on credit risk.

I will briefly describe some of this evidence before making my own modest contribution using data from zillow.com and the US census. You can click here if you are familiar with this literature already and wish to skip ahead to my analysis.

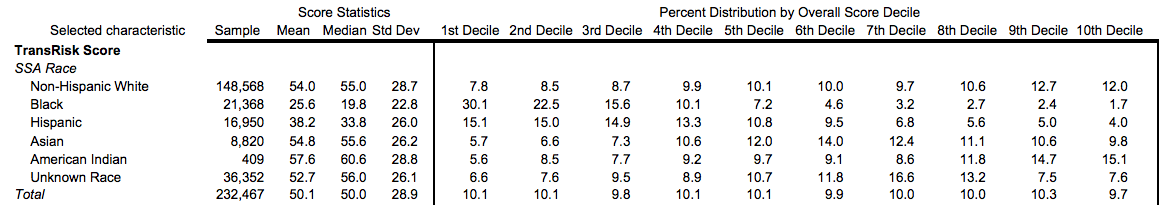
1- Blacks have much lower credit scores (e.g., FICO) 

Google Chrome.png

source

The difference in between the white and black means is about 1 standard deviation.

Racial differences in homicide rates are poorly explained by economics

There are large racial differences in the homicide rates in the United States.  The FBI and other government organizations are not always forthcoming with detailed data, but you can quite readily estimate it (approximately) with the victimization/mortality data from the CDC and other sources (most crimes being committed intra-racially)

avg_hom_rate_nat

The black homicide rate is about 10 times higher than the white rate. It has been this way for quite some time (i.e., even as the rates have changed the differences themselves have remained fairly stable).

Google Chrome


Similar patterns can be found elsewhere, but I find the homicide statistic useful and interesting for many different reasons, namely:

On a recent Brookings blog post hyping economic inequality as a predictor of well-being

I recently came across a Brookings Institution blog post regarding the relationship between economic inequality and various measures of well-being.

Setting aside the lack of statistical controls and probable confounds, the practical significance implied by their own plots was actually rather trifling.

Small update to prior post on school suspension rates, comparing racial/ethnic differences with national aggregates

In my last post I displayed a plot showing a striking correlation for single-motherhood rates and out-of-school suspension rates between racial/ethnic groups using national averages.

nat_by_sm

I am well aware that aggregating linearly correlated variables will tend to produce (much) stronger correlations than you’d see with more granular data (e.g., state, county, family, individual, etc).  On the other hand, I am familiar enough with these statistics to know that you will see substantially weaker correlations here with other common predictors.  Hispanics/latinos, for instance, tend to be worse off than than blacks by many economic measures, rarely appreciably better off, and yet their discipline problems are much less (even, interestingly, less than whites in California controlling for median family income).  Likewise, the distance between asians and non-hispanic whites tends to be modest on economic dimensions, but their suspension rates are roughly half the non-hispanic white average.

For the benefit of others, I decided to generate some plots of predictors aggregated at a national level for comparison’s sake (note: I reversed the x-axis to keep the graphic relationship the same where necessary).

On the relationship between school suspensions, race, single-motherhood, and more.

As a follow up to my prior post on single-motherhood and mobility and in response to various assertions of discrimination against blacks in the school system, I decided to take a data-driven look into the relationship between race and school suspension rates.


There is, of course, ample evidence that discipline rates vary dramatically between racial/ethnic groups.

Microsoft Excel

Blacks get suspended at vastly disproportionate rates whereas “asians” (census/OMB definition), on the other hand, are about half as likely as whites are to get suspended.  Contrary to conventional wisdom, though, this pattern tends to be pretty consistent nation wide and the south is not notably “worse” with respect to disparities here.