
I recently came across a Brookings Institution blog post regarding the relationship between economic inequality and various measures of well-being.
The average incidence of worry is higher in more unequal metro areas: https://t.co/uWvYFMQnpY pic.twitter.com/A3vYX1SXXV
— Brookings Econ (@BrookingsEcon) November 8, 2015
Setting aside the lack of statistical controls and probable confounds, the practical significance implied by their own plots was actually rather trifling.
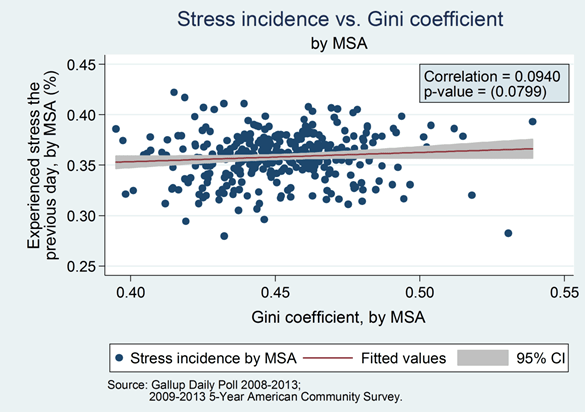
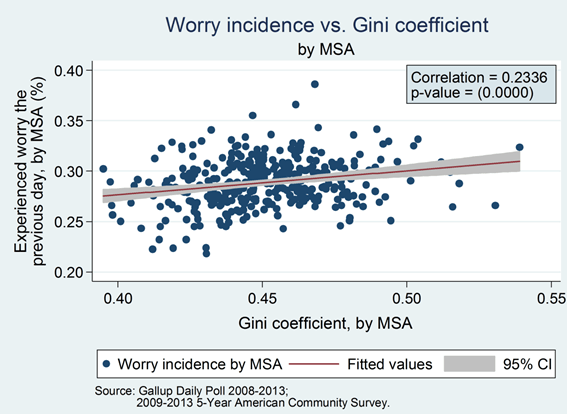
This implies that reducing inequality by 0.13 points (gini), roughly the distance between the United States and Sweden, corresponds to about a 3 percent point decrease in Gallup’s “worry incidence” measure and roughly a 1-2 percentage point decrease in the “stress Index” measure. Even if this association is 100% causal, that strikes me as barely worth spilling ink over given the efforts that would be required to bring about that sort of change.
However, I was curious about Gallup’s data (hadn’t heard of it before) and suspected that most, if not all, of the inequality association has little to do with inequality itself, so decided to take a look for myself. Gallup’s public well-being index appears to contain similar data for 189 metropolitical statistical areas (MSAs) with various measures of well-being.


This public data isn’t exactly the same, but it’s capturing similar trends (with weights) and it’s very likely that they correlate reasonably well with the measures the people on the Brookings blog post reported.
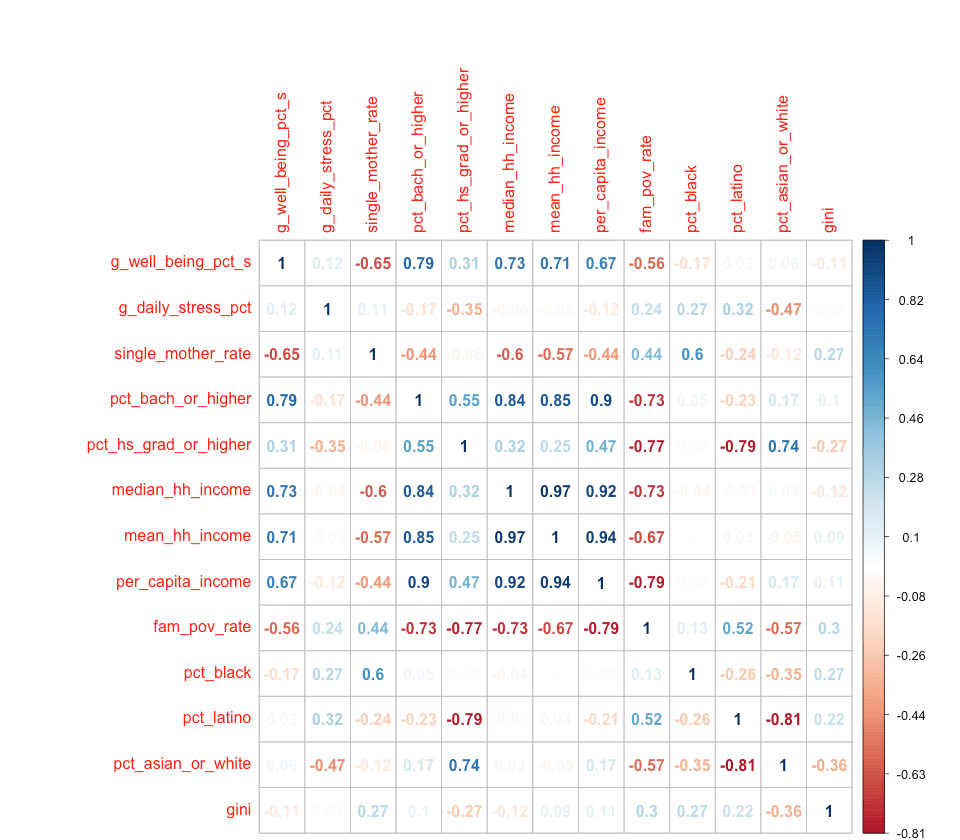
population-weighted correlations matrix
 correlations matrix without weights
 The “well being” measure is much more strongly associated with race/ethnicity, SES-like measures, and the single-motherhood rate than gini. Likewise, the stress measure is relatively strongly associated with race/ethnicity, education, and other measures. All of these measures are fairly well associated with gini, so it appears likely that they mediate these associations.


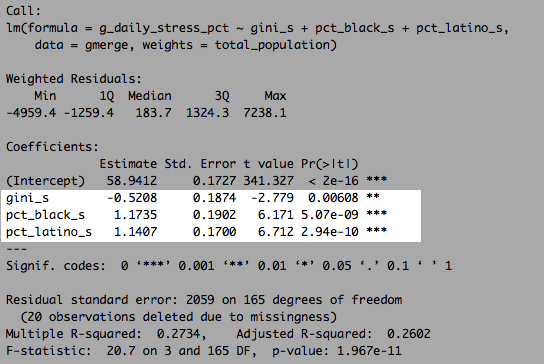
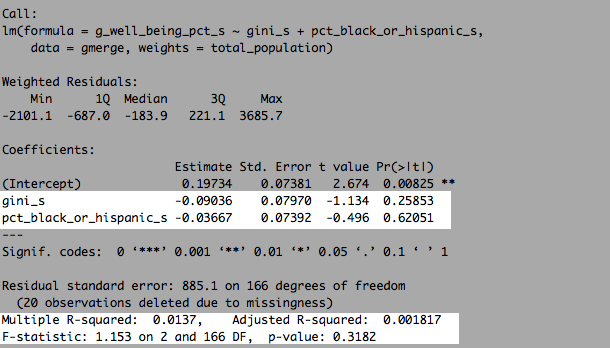
If we so much as include percent black and percent latino into a linear model, the positive relationship between inequality and stress disappears and the sign actually flips (i.e., more inequality is associated with less stress with rudimentary controls)
Likewise, although it’s a terrible model, race/ethnicity effectively neutralizes the relationship between gini and worse well being index outcomes.
If we go a step or two further and include some of the stronger predictors above, the model tightens up dramatically.
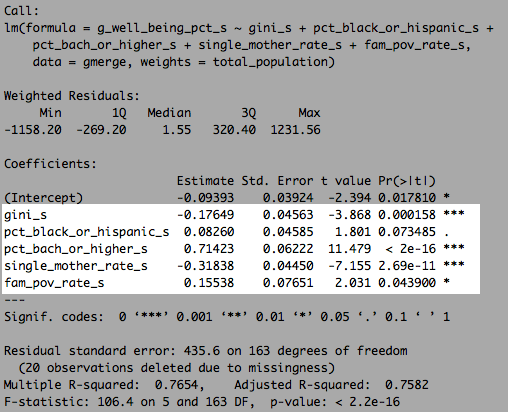
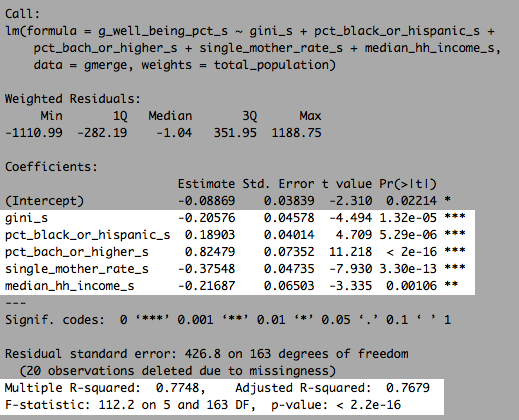 The gini coefficient is still significant here, though it’s about half the effect of single-motherhood and race loses its negative association here entirely (similar result if I specify black and latino separately). This is true even if I specify poverty rates in the model instead.
Given that this well-being index is a composite of several lifestyle variables (e.g., smoking rates, eating habits, etc), in addition to “stress” and the like, and given its particularly strong association with education rates relative to various economic measures, I suspect this association with gini has more to do with unobserved or, at least, poorly observed differences in social capital and financial means than actual causation through jealousy, direct economic effects, etc.
Below I ran some multi-variate regressions on the components that Gallup shares with non-subscribers (public-data)
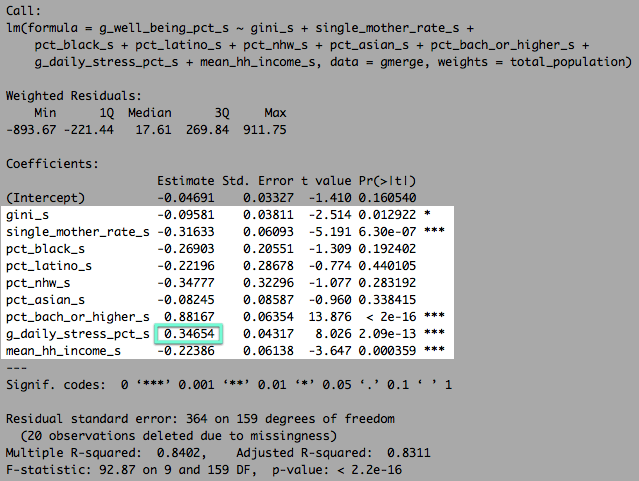
daily stress (lower is better)
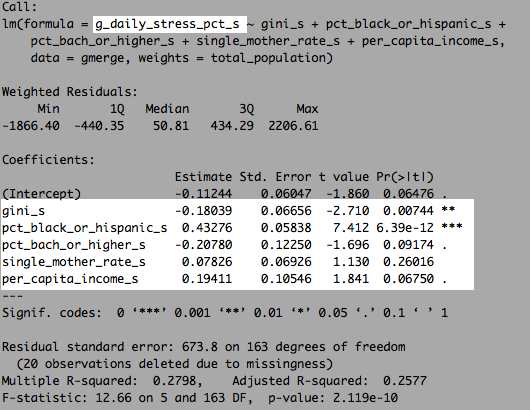
Like I pointed out earlier, gini is (still) inversely correlated with stress, i.e., more inequality is associated with less stress controlling for covariates like race, economic metrics, and the like, and I get similar results if I use other controls (e.g., poverty rates, mean HH income, median income, etc). This is an example of Simpson’s paradox.
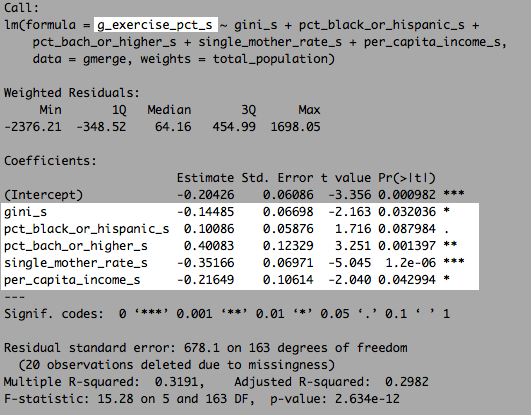
exercise rates (higher is better)
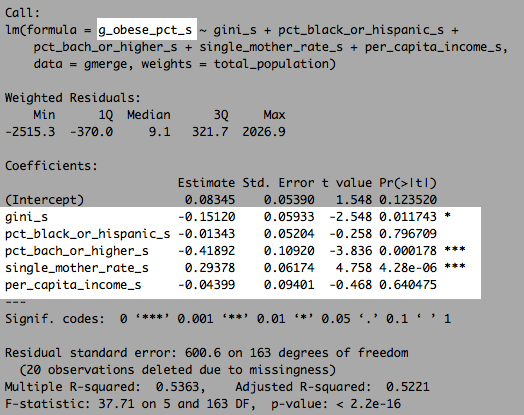
obesity rates (lower is better)
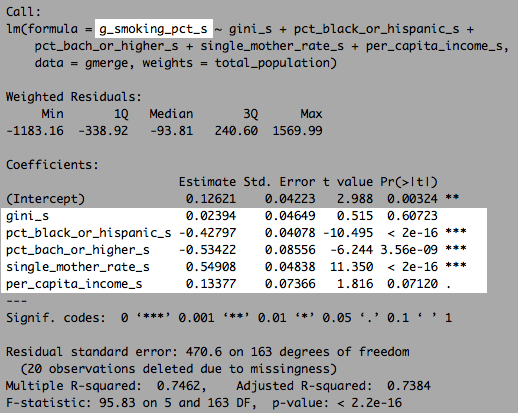
smoking rates (lower is better)
eat produce rates (higher is better)
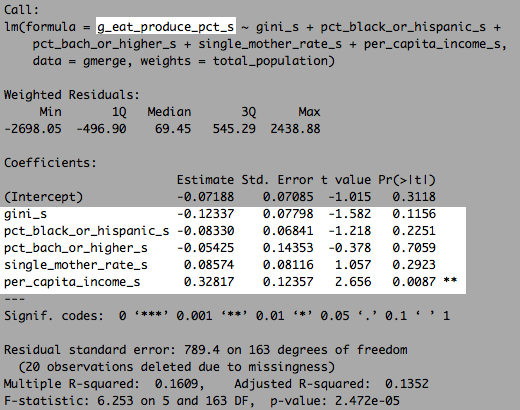
Unlike with the stress measure, several of these lifestyle measures are associated with inequality, even with obvious controls in place. However, I still suspect that there are unobserved differences contributing to both of these, i.e., differences in innate behaviors, culture, social capital, and the like influence both inequality and lifestyle behaviors.
I wish Gallup would describe the well-being formula in detail so I could (directly) tease apart the relative impact of behaviors like exercise from other measures, but I’ll just to leave it at that for now.

Regarding the association between well-being and gini:
- It is still quite modest in practical terms (much smaller than most progressives seem to believe)
- the association is weaker than other predictors that get much less attention (e.g., single-motherhood rates, racial/ethnic demographics, etc)
- may well be spurious, especially given that this is composite of several measures that are not all well correlated…. which cannot be controlled for all that well in a single equation (i.e., the underlying components have different weights and even different signs).
- it doesn’t work like progressives seem to believe given the inverse (controlled) correlation between self-reported “stress” and gini. In fact, if I include stress directly in the regression equation:
…. (4 cont’d) the association falls further still. The model suggests that (more) stress is positively correlated with well-being! That is rather counter-intuitive, but would at least partially explain why these gini correlations move in opposite directions. Incidentally, this odd pattern is found without any controls too.
