
Philip Cohen, a sociologist that blogs at Family Inequality, recently argued, in response to the proposition that single-motherhood is strongly associated with economic mobility, that the single-motherhood effect is “entirely in the % black effect”.
Dear world: The single mother effect in Chetty is all in the % Black effect he left out: https://t.co/p78zHR7CbL pic.twitter.com/4ZDLMTVdwB
— Philip N. Cohen (@familyunequal) October 22, 2015
While I do not necessarily disagree with the notion that racial demographics are strong predictors (albeit probably for different reasons than he does) and I do not necessarily believe that the single-motherhood association is (mostly) causal, his strong language is clearly at odds with the data. In fact, his statements are not even well supported by his own stats.
For his analysis he took just 100 of the largest commuting zone (CZ) from Chetty’s 2015 “causal mobility” study data, weighted them for population size, and then argued from statistical insignificance in his model combining both variables (model B) to imply that the effect is negligible.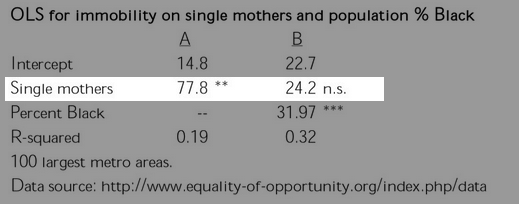
At the very end of his blog post he qualified his argument a bit, by saying (emphasis mine):
This shows that the association between single motherhood rates and immobility is reduced by two-thirds, and is no longer significant at conventional levels, when percent Black is added to the model. That is: Percent Black statistically explains the relationship between single motherhood and intergenerational immobility across U.S. labor markets.
The “reduced by two-thirds” bit is quite a bit different than his statement on twitter and other things he highlights. Moreover, it should be obvious that lack of statistical significance does not mean that the actual effect is actually insignificant, especially not with his selected observations.
His top-100 CZ excludes ~30% of the population (based on year 2000 Census), ~86% of the observations available in Chetty’s commuting zone (CZ) data, and is far from random (e.g., likely quite a bit less white than the national average). Moreover, no other statistics from his sample were provided. He did not compare the correlation coefficients head-to-head or try to model percent black alone…. all of which would have been useful for those interested in understanding the relative strength of the arguments.
I attempted to reproduce his results based on his brief description, but could not do so precisely. His regression algorithm may have been implemented slightly differently, he may have scaled the variables differently, he may have used a different population weights, or something, but I came up with something pretty close to 50/50 with the top-100 CZ subset and, for what it’s worth, the (scaled) single-mother coefficient was usually larger.
This is not surprising given the fact that the correlation coefficient was practically identical in the top-100 CZs

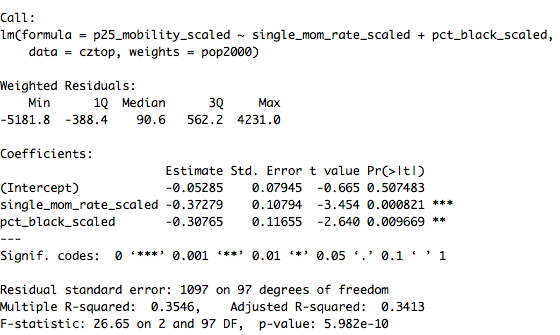
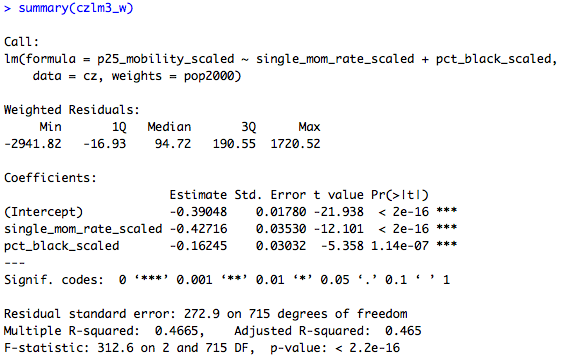
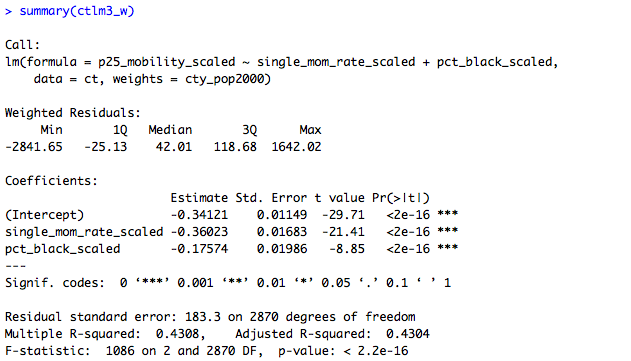
linear-model, with population weights
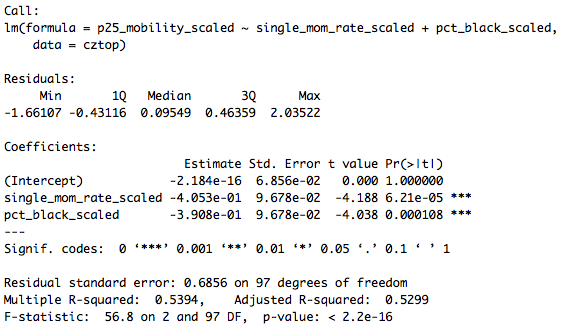
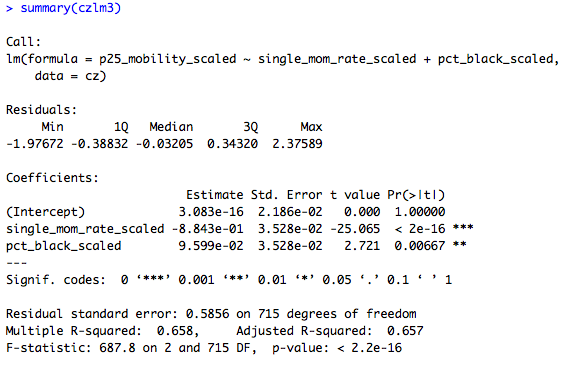
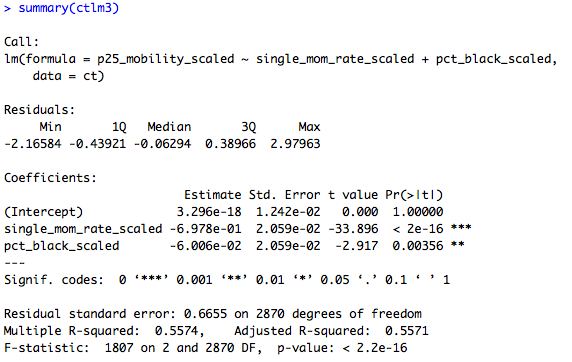
linear-model, without weights or interaction effects
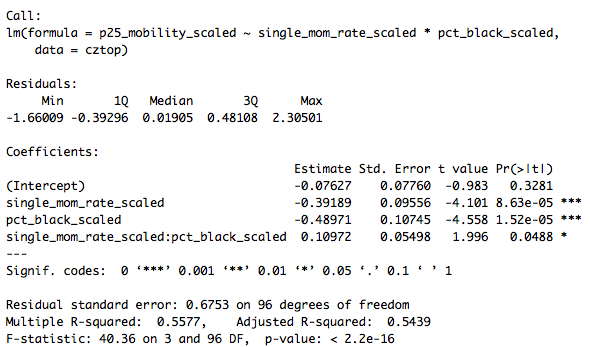
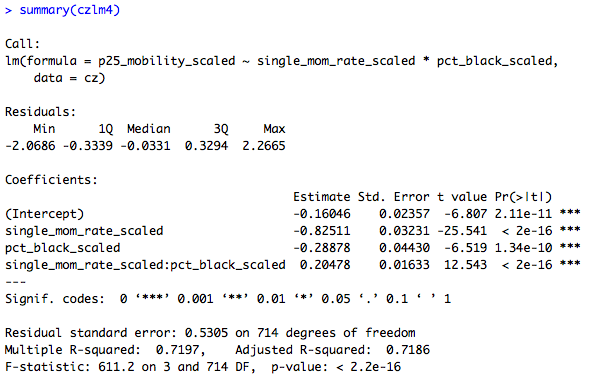
linear-model, without weights, and with interaction effects
I would be highly reluctant to argue either one was obviously more significant based on the top-100 CZ data and different assumptions one might make. However, my analysis of the full set of observations at the CZ-level and at the county-level suggest that percent single-mothers is truly a substantially stronger predictor than percent black (or any of the other covariates I found). Moreover, I found that single-motherhood correlated more strongly with other covariates that are well correlated or even (presumably) causally associated with economic mobility (e.g., income inequality, income-adjusted test scores, segregation indexes, etc).
Community Zone (CZ) analysis (all observations)

You might note that percent single mother (SM) correlates with 25th percentile upward mobility at -0.81 vs -0.60 for percent black. You might also note that it correlates better with several other key covariates here.
Below I’ve attached some screen shots of the top-100 CZ linear multiple regression models.
without interaction effects and without weights
with interaction effects and without weights
without interaction effects and with population weights
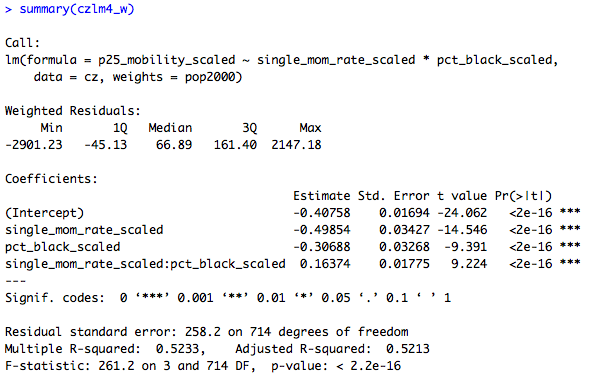
with interaction effects and with population weights
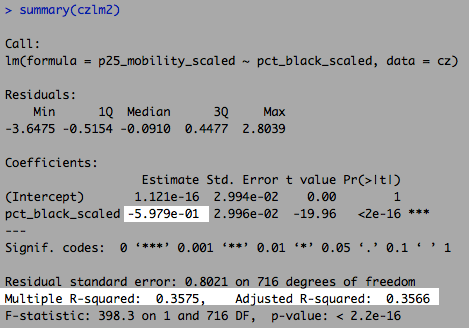
Although it should be obvious from the correlation coefficients above (assuming linearity!!!), if we try to model this with percent black alone, we get a relatively weak model and a smaller coefficient. If the effect were even mostly (never mind “entirely”) in percent black this simply should not be true.
Whereas if we model it with single-motherhood alone:

It’s helpful to see some key plots of the data to better understand the relationships.
Upward mobility by single-motherhood rate

Upward mobility by percent black

Percent single-mother by percent black

Percent black by percent single-mother
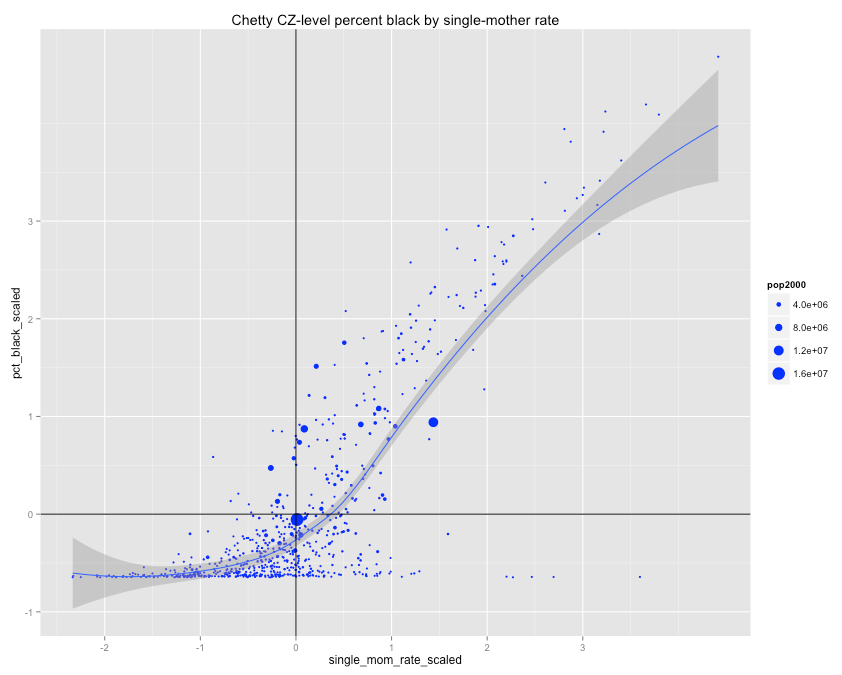
Although the percent single-motherhood and percent black are obviously fairly well correlated for much of the distribution, we can clearly see that they are far from perfectly correlated and that the relationship is not linear.
If we fit a loess regression with percent single-mother to 25th percentile mobility (r=0.85) to deal with obvious non-linearities in this data and then plot the residuals (over-prediction) by percent black, we find little evidence that black is systematically associated with all much worse outcomes than we’d expect based on the single-motherhood statistic alone.

On the other hand, when we attempt to reverse this, i.e., fitting % black to mobility (r=0.66), plotting and then plotting the residuals against single-motherhood, we see some evidence to suggest a systematic relationship here (especially on the left side of the plot).

I suspect single-motherhood operates mostly as a proxy here for (mean) SES, social dysfunction, time preference, and other variables of interest.
Quite contrary to Cohen’s assertion that single-motherhood predicts because it is associated with blackness, I actually find that the association is notably stronger in less-black (usually whiter) counties and commuting zones (CZ).

It is not likely that to going from ~0 to 0.27% black “causes” several SD of “causal mobility” (unless you assume massive spillover effects….). If different racial/ethnic groups have different ideas about single-motherhood (not unreasonable imo), its predictive power as an area-wide proxy likely varies somewhat in proportion with the areas racial/ethnic demographics. This, incidentally, is why I included interaction effects in the OLS models (it also improves the fit). Also note the overlapping nature of these predications vs observations despite no overlap in percent black.
County-level data
I find very similar patterns at the county level. While commuting zones (CZ) arguably better capture the broader economic region, there are many more counties, counties are generally more granular and capture a wider absolute range of covariates (e.g., mostly suburban vs mostly urban counties), thus are probably better for these purposes. At the very least, it’s useful to compare at different units of analysis…

without interaction effects and without weights
without interactions effects and with population weights
with interactions effects and without weights


As I did with the CZ data above, below are predictions from loess regressions with percent black and percent single-mothers.


The pattern here is the same as with the CZ data above. The higher the decile the larger the percentage point difference within each decile due to the skewed distribution. If percent black itself has some independent role here, as I’d expect and as the interaction models suggest, the slope should increase in higher deciles, other things being relatively equal, not decrease. This is clearly not what we observe.
Although it should be obvious from the correlation coefficients and OLS estimates, it might be useful for skeptics to invert the variables in the above plots, i.e., compare the loess predictions from percent of county black grouped by quartile or decile of single-motherhood.


Once we crudely control for single-motherhood the association between percent black and mobility is vastly reduced. None of this proves that race isn’t somehow important (obviously these measures are well correlated), but it does suggest that the issue has less to do with race per se than what race is associated with.
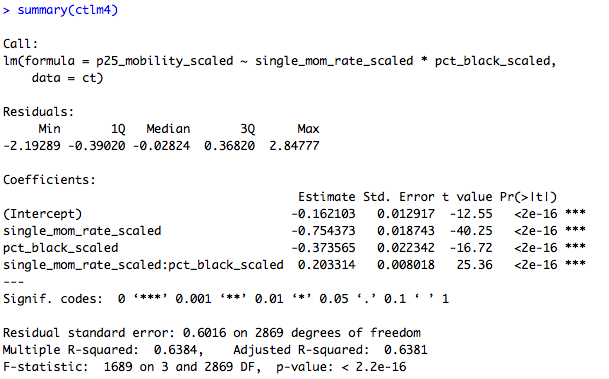
If you dislike my use of loess regressions, we can try it another way using the linear interaction model I showed earlier (ctlm4).
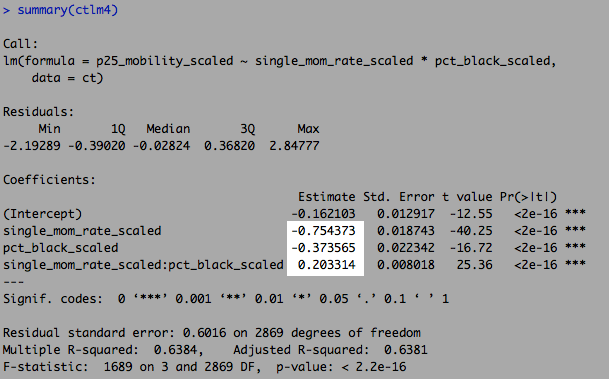
This method does not perfectly capture the non-linearities in this data, but it’s good enough to demonstrate my point.
Now compare these linear model predictions by decile of county black plotted.

Or by deciles of single-motherhood rates

It ought to be pretty clear by now single-motherhood is capturing something quite powerful and that, contrary to Cohen’s strong assertions, it is not well explained by race. If anything, single-motherhood mediates the black association much better than the reverse.
If anyone is interested, here is the R code I used to produce this analysis
Are there a similar analyses not on mobility, but on other aspects (crime and race/single motherhood, suicide rates and race/single motherhood)?
Not that I’m aware of off the top of my head, but I’m working on some analysis along these lines (e.g., school suspensions).
fyi-i just make a new blog post touching on homicide rates and its association with single-parent families