Since I have heard more than a few complaints about disparities in school suspension rates, I thought I’d extend my prior analysis of data from California public schools to better understand the patterns here.
UPDATE: I realized after the fact that I botched the asian rate data a bit because California reports Filipinos as a separate group for some strange reason, i.e., they’re not included in the reported suspensions/numerator, and my denominator uses the normal federal/OMB definition, which includes doesn’t put filipinos in a separate category. Filipinos are about 1/4th of the (federal) Asian category in CA schools and probably have a higher suspension rate than east asians (which is extremely low). I don’t think it’d alter the between group differences all that much, especially not in ordinal terms, but I don’t feel like re-doing these all plots right now, so keep that in mind.
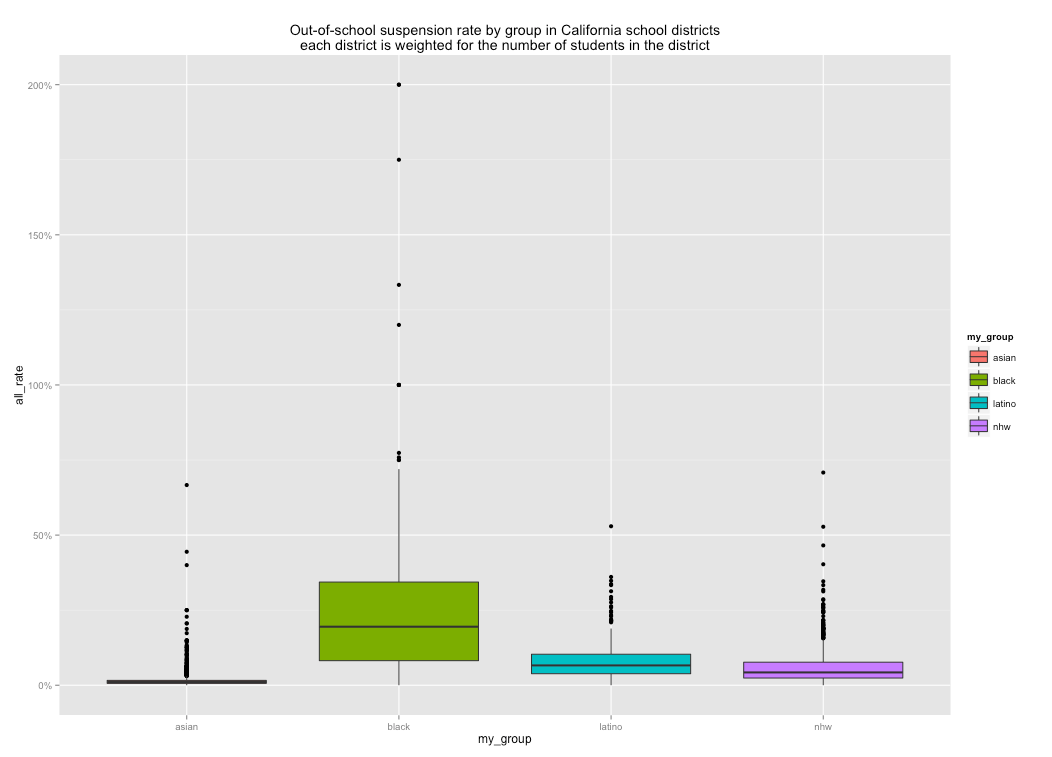
Out-of-school suspension rate (“(OOOS”) by district (weighted)
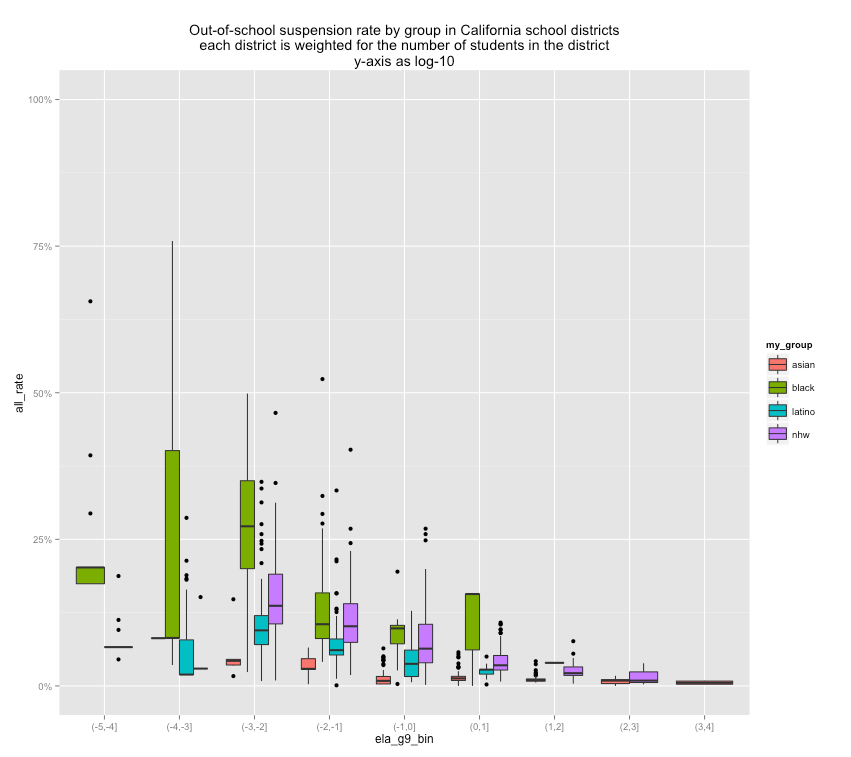
OOSS by district (weighted), y-axis as log-10
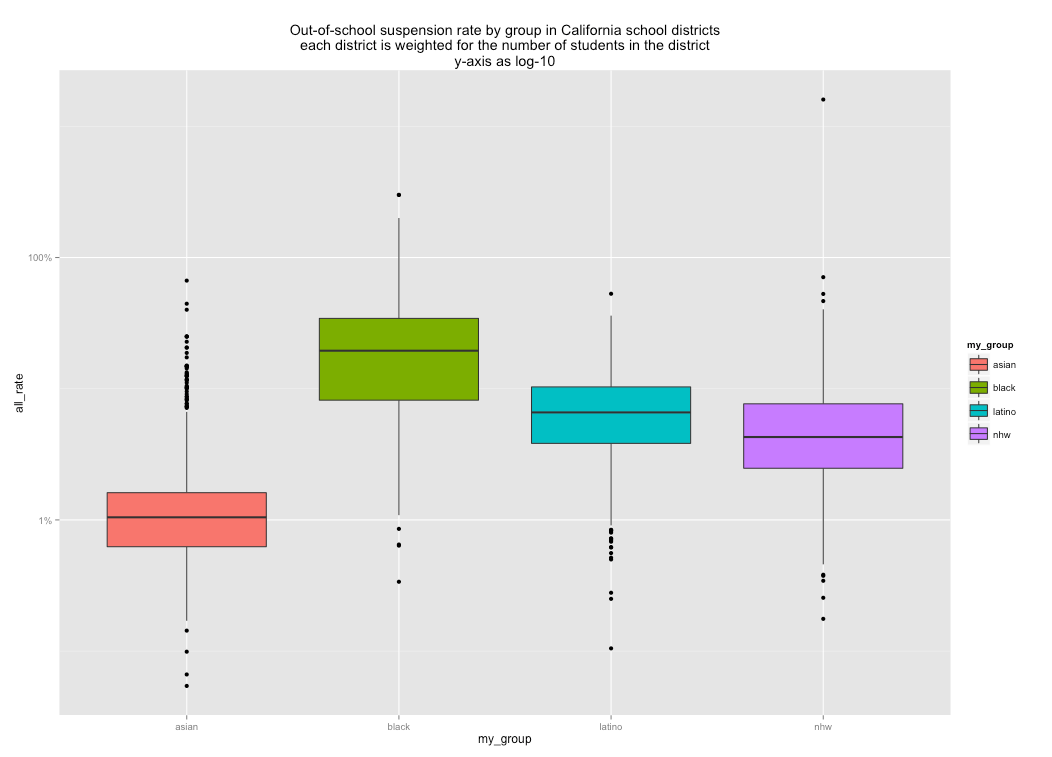
Observation: There are clear racial/ethnic patterns here that cut across many different school districts.
OOSS by median family income

OOSS by poverty rate

OOSS by education level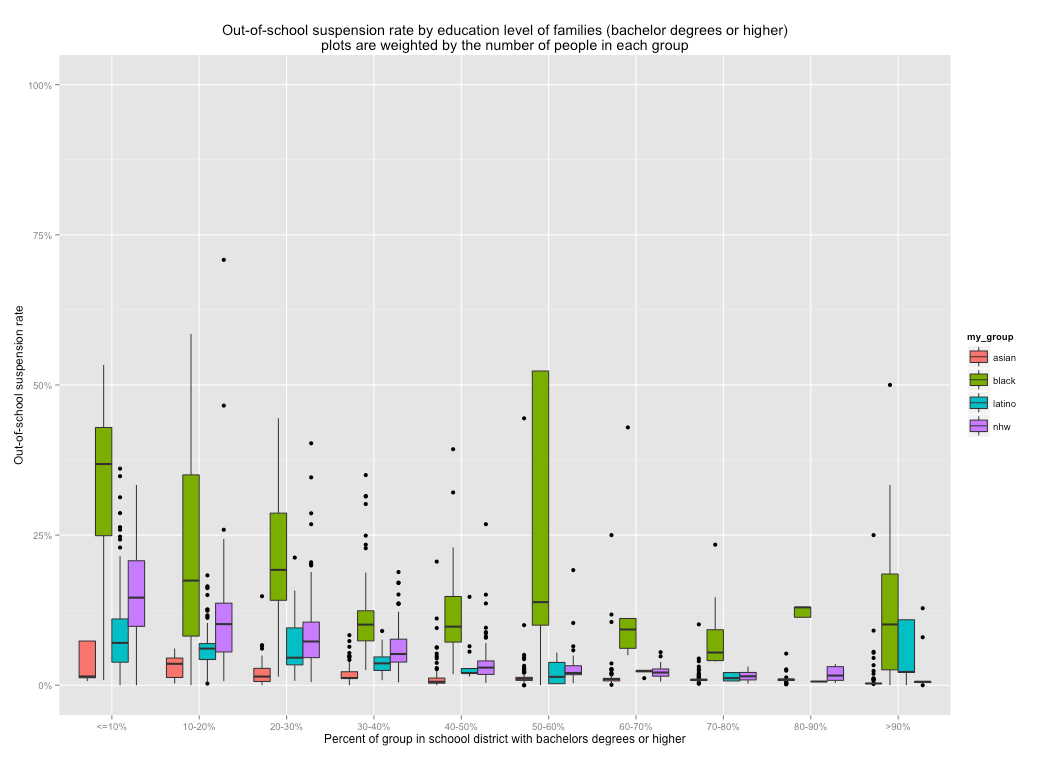
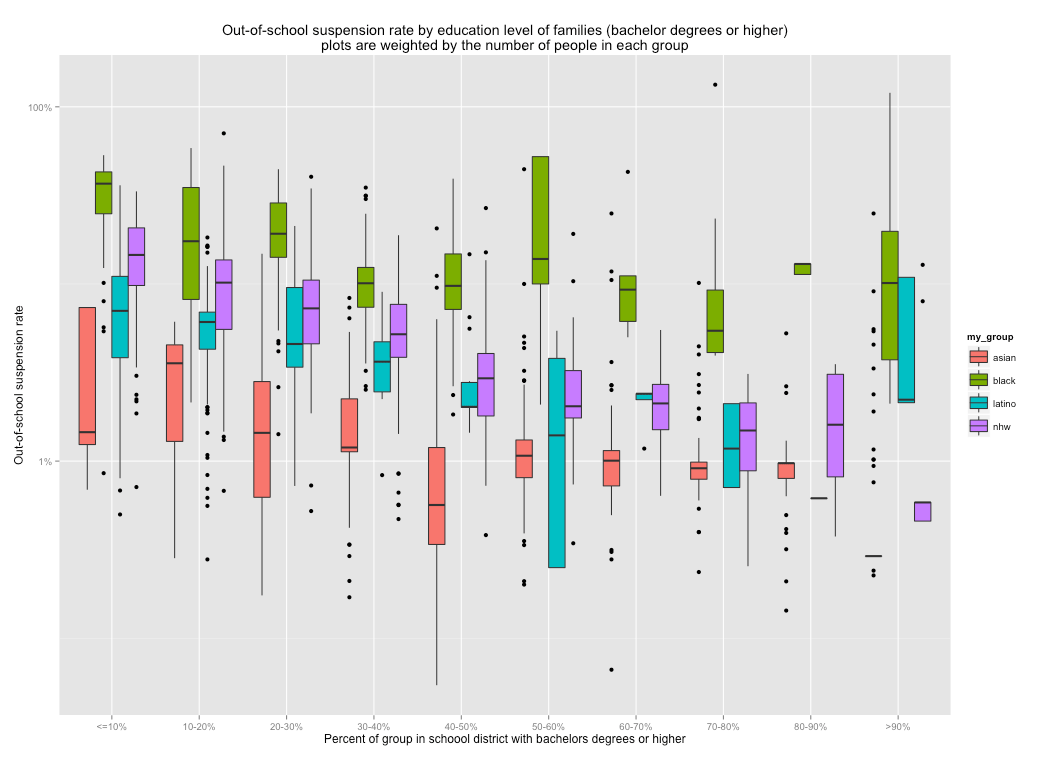


Observation: There appears to be a non-linear relationship between socioeconomic status and suspension rates.
Comparison with test scores
English Grade 9 w/ linear Y axis

English Grade 9 w/ log 10 y-axis (local polynomial trendline)

English Grade 9 w/ log 10 y-axis (linear trend line)

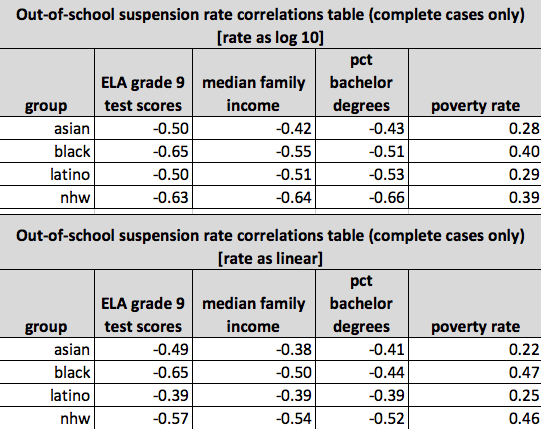
Test scores are generally a better predictor of suspension issues within and between groups than socioeconomic measures are. In the table below I compared the strength of these various correlations for complete cases only, i.e., only districts with all of these measures available (to prevent, say, elementary school only districts from skewing the stats).

Comparison of different reasons for suspension


Despite some of the outliers below, we can pretty clearly see that there is a fairly strong linear relationship between violence and defiance. Communities with higher rates of violence suspensions are apt to have similarly high rates of defiance suspensions.


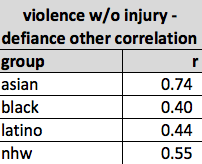
The overall correlation across all of the above as separate items without grouping is 0.55.
Conclusion
I think it’s pretty unlikely that the reason blacks are suspended at disproportionately high rates is substantially the result of being unnecessarily suspended due to “cultural differences” or “racism” because:
1: The overall out-of-school suspension rates are well correlated with test scores, i.e., it “explains” much, if not quite all, of the between group differences (especially W-B). Lower test scores predicts lower IQ, which predicts much increased behavioral problems, worse judgement, and so on. Underperforming students are also less likely to be engaged in school and presumably have less to lose if they get suspended (or at least they may believe as much).
2: We see the same patterns in other (major) suspension categories, most of which are (arguably) more objective and more obviously “serious”.
3: We don’t see nearly the same problem with poor asians or poor latinos. Lower income whites are actually suspended at higher rates than similarly low income latinos, which is much higher than low income asians (generally speaking). If we’re not willing to presumptively label these differences the product of racism or bias, why should we presume otherwise for black-white differences?
4: These patterns are generally consistent across many different school districts. This isn’t just a problem found in a few big cities or just in poor communities.
Extra Plots


