Warning: This is long somewhat meandering post and a work-in-progress
My intent here was to compile the evidence in a narrative fashion. There are more detailed and more technical sources for much of the information I presented here, but much of it is scattered and much of it is targeted at people that are both knowledgable and willing to invest the time. My approach here was to present the information in a relatively accessible, top-down fashion, i.e., first identify the magnitude of problem, then characterize it, then present evidence that the favored environmental explanations do not add up, and then (briefly) touch upon some more controversial hypotheses….
One of the first things that clued me into the fact that school systems and socioeconomic status cannot explain the black-white (B-W) academic achievement gaps was seeing SAT data like this:


The obvious pattern here is that high socioeconomic status (SES) blacks do no better (and often worse) than low SES whites, whether measured by their parents’ income or their parents’ educational credentials. This is really hard to explain away as being mainly a product of poverty, bad schools, and things of that sort either.
Roland Fryer and Steven Levitt wrote a paper on this subject that shows that the academic achievement gaps start before black children enter first grade and that, even after an exhaustive set of controls, the gap grows by approximately 0.1 standard deviations per year through the 4th grade. They point out that these gaps exist in the same schools, same classrooms, and with the same teachers, i.e., differences in the education inputs in the form of segregation, funding, tracking, or the like cannot “explain” more than a tiny fraction of the observed difference.
Since these models can be a bit complicated (they are susceptible to assumptions) and some people have made some silly complaints about the SAT and the like, I am going to (tediously) document that differences of similar magnitudes can be found much earlier, i.e. K-12 academic outcomes, and that the usual proffered explanations simply do not stand up to even modest scrutiny (using less complicated methods with nation-wide data).
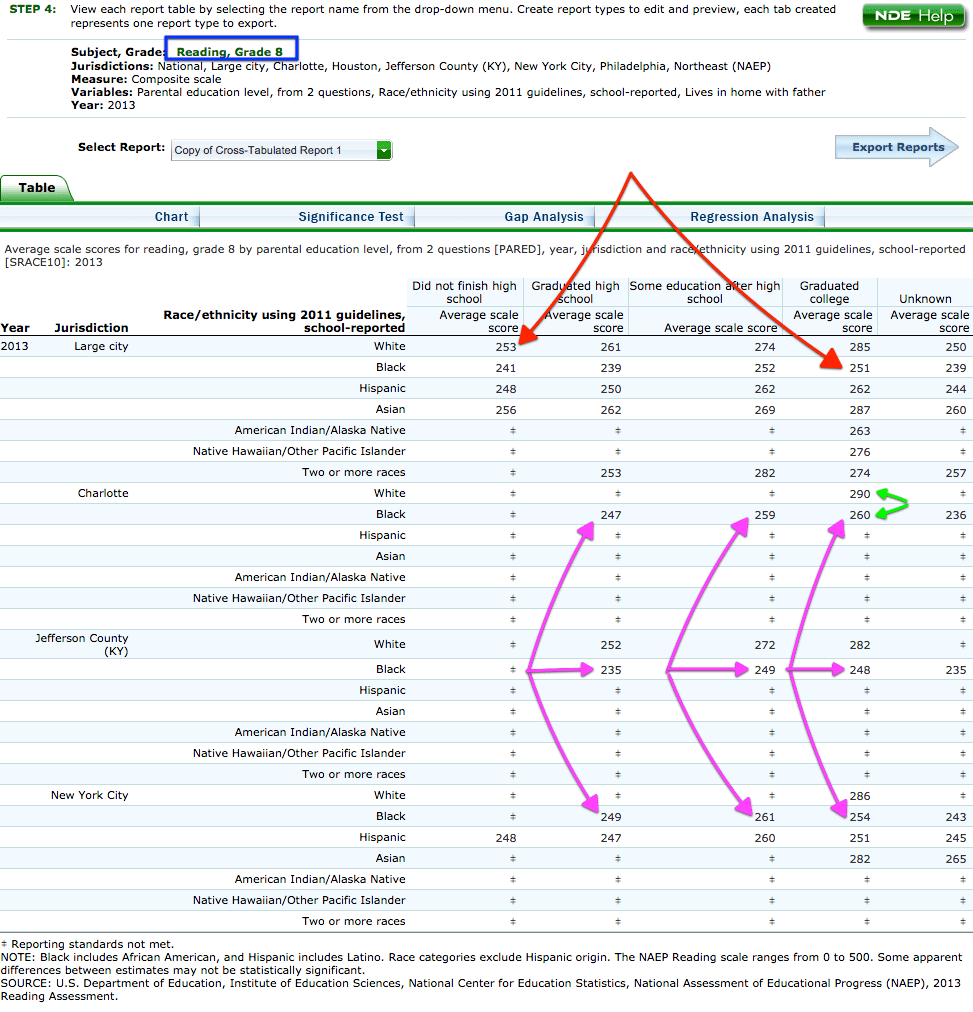
Take a gander at this data from the department of education’s NAEP data explorer.

White kids whose parents did not even graduate high school do as well as black kids with college graduate parents.

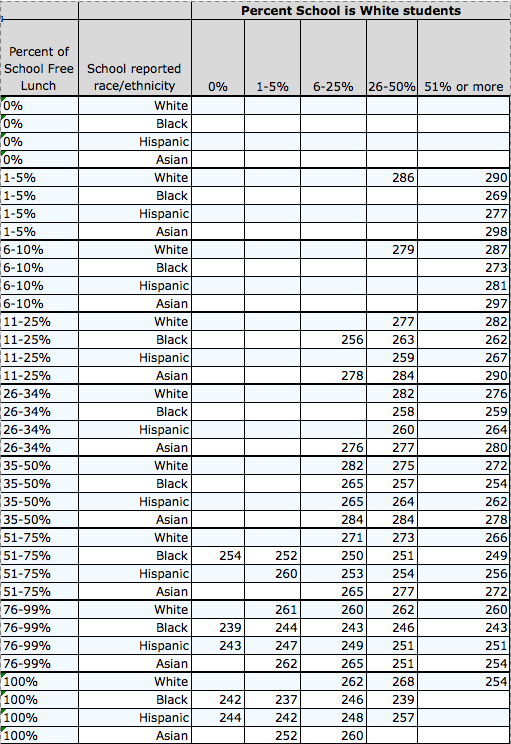
Similar patterns are found even after you control for school poverty. Kids in low poverty schools (using school lunch eligibility proportions as a reliable proxy) tend to be much higher SES than their presumably similarly educated counterparts in high poverty schools. The academic rigor and grading standards of schools tend to reflect the demonstrated academic performance of the community.
Moreover, low SES groups are more likely to attain less demanding credentials (as measured by SAT scores, academic rigor, choice of major, etc) in higher ed and beyond (see illustration below for this concept). “College graduates” in low SES or predominantly URM communities are far more likely to be of the community college or non-competitive variety than “college graduates” in high SES communities (low school lunch eligibility).


Put differently, the parents’ nominal educational credentials, as reported in these sorts of statistics, do convey meaningful information (especially within community differences), but they are still fairly crude proxies for the things we care about (as in, actual abilities, actual academic curriculum/education, etc) and cannot be assumed to allow 1:1 or apples-to-apples comparisons between substantially different communities by race/ethnicity, SES, or even in significantly different places [Note: this is one of the huge mistakes made by observational studies that use these observables overly literally to impute strong causative effects to “poverty” and other measures of economic well being]

Blacks at majority white schools do not perform dramatically better. White kids in majority black schools don’t do dramatically worse either (controlling for just parental education, which is crude). There is a general consistency to these racial/ethnic gaps within all of these various units of analysis.

Not much changes if we look at the proportions of the school that are black either.

Or latino proportions.
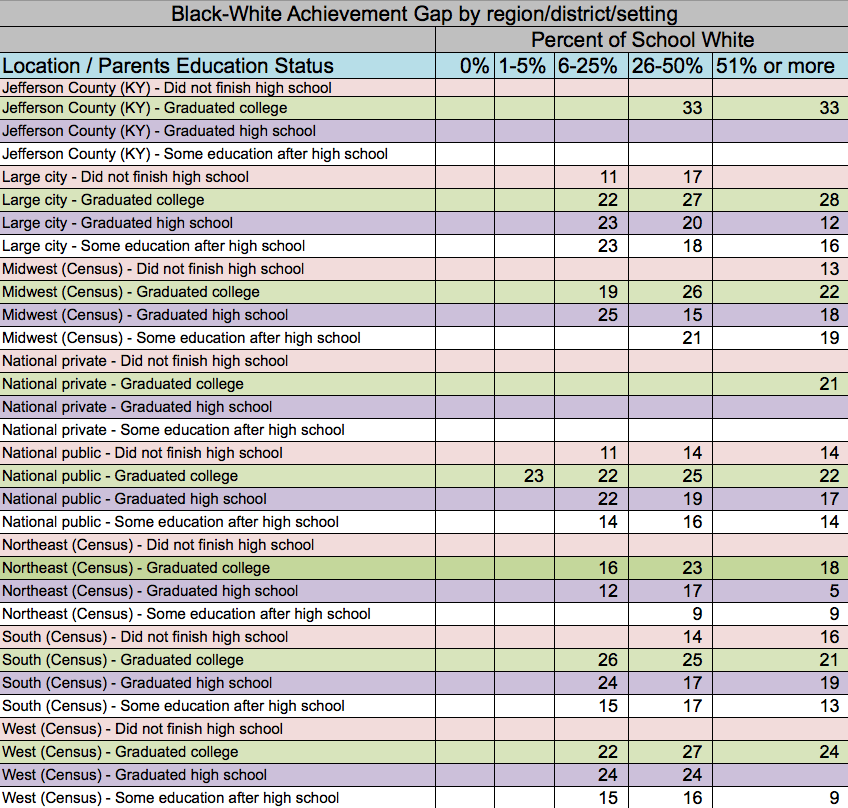
Of course, most of the apparent racial proportion effect is driven by its correlation to the schools’ demographics (including SES). Schools with large proportions of black or hispanics tend to be relatively low SES all over. You can see that most of these relationship evaporates if you compare school-wide free lunch proportions vs percent of school white.
Or using the NAEP regression analysis tool to crunch the individual data directly (using school lunch eligibility percentages AND percent of white students):
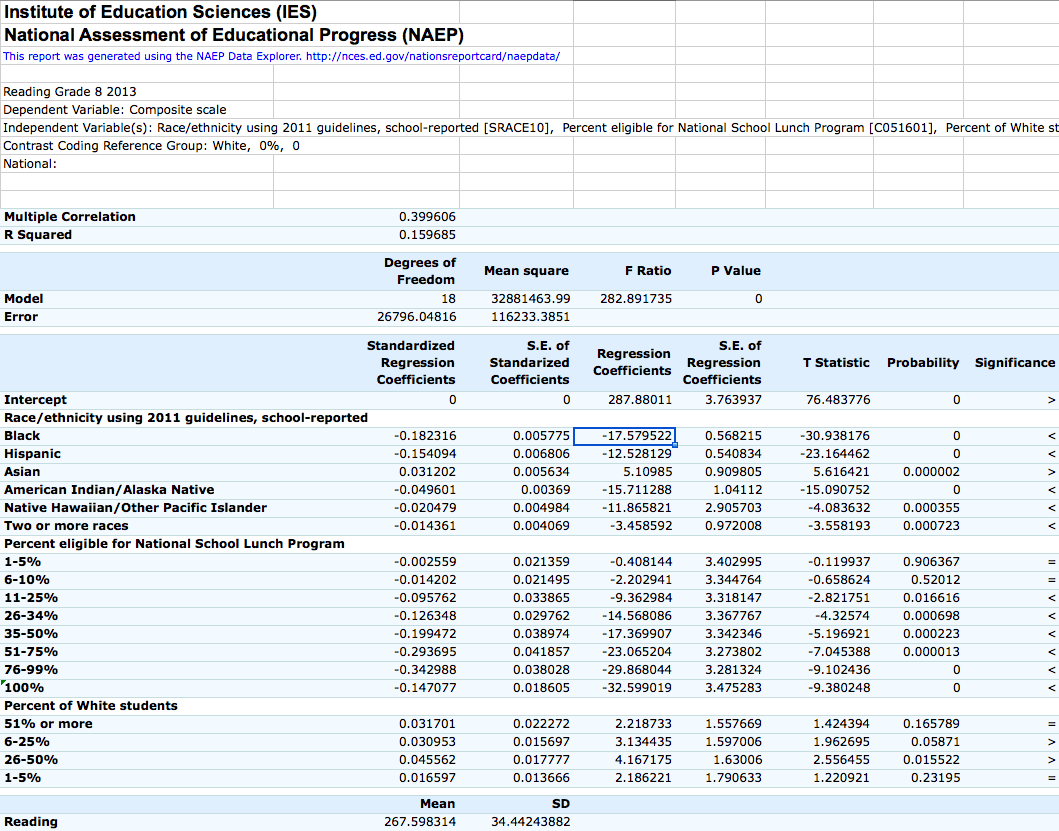
Note: the small regression coefficient between 0 and 51+ percent white is just 2.2 points using just race/ethnicity and school lunch program eligibility (about 0.05 standard deviations and much smaller than the coefficient for blacks, latinos, etc). It certainly does not look to me like there is any large or consistent effect in whiter schools for any group. The data explorer program only allows 3 measures at a time, but I’d bet with more variables (e.g., parent education) it’d be even smaller.
Also note that the school setting (urban/rural/suburban) seems to have little effect along these lines too.
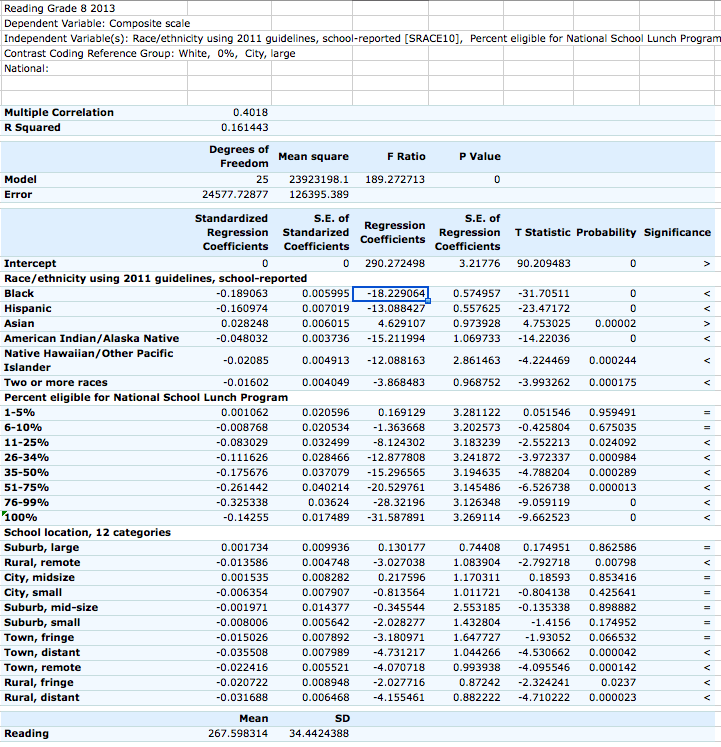
The much mythologized “suburbs” do not systematically outperform large cities once you account for school characteristics like national school lunch program eligibility proportions and the individuals own race/ethnicity (as reported by the school). Moreover, small towns and rural settings, where whites are much over-represented, do somewhat worse than we’d expect with these sorts of controls in place.
We find broadly similar results if we control for the students’ parents’ educational credentials instead.
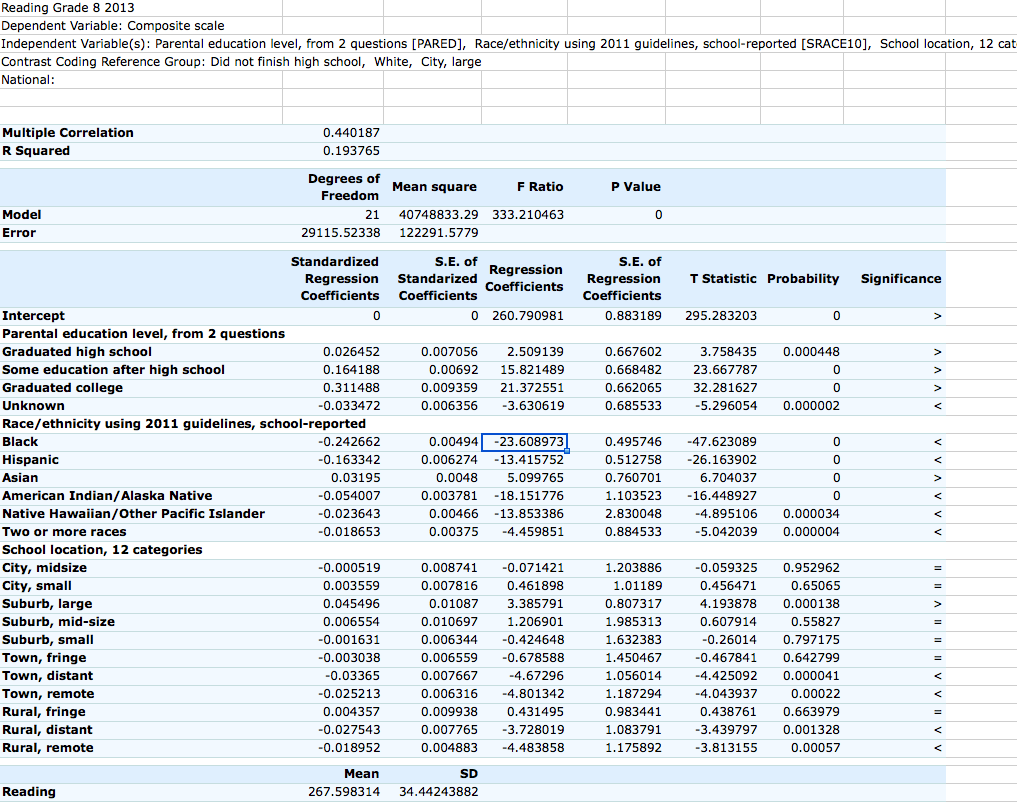
My point here is that the students’ individual race/ethnicity, students’ individual parents education credentials (despite the above mentioned flaws), and school SES/poverty more broadly are much better predictors of individual student outcomes than urban/suburban/rural or school racial/ethnic proportions per se. Although the “data explorer” product won’t allow me to evaluate more than 3 measures at a time (one of which is race/ethnicity) to evaluate this directly, it’s unlikely that adding school setting or racial proportions will add all that much incremental power based on this analysis.
Of course even in the same school districts we routinely find results that seem to vary strongly according to the proportions of the “minorities” in the schools.
NYC school level “college readiness” as proportion black or latino

Many people mistaken believe that this must be because the schools are underfunded, have much worse teachers, etc etc, but the reality is that this can be predicted quite well by looking at the race/ethnicity of the individual students and better measures of individual SES (school SES tends to correlate for obvious reasons). Schools that are predominantly URM schools are also predominantly low SES. We know that both low SES and black (or latino) status predict much worse average outcomes (as a general rule) even in the same schools, classrooms, and the like.
Thus it is not surprising that when we actually look at much bandied examples of school integration “success” like Louisville, KY (Jefferson County school district) or Charlotte, NC, we see precious little evidence of equalized of outcomes within the schools or even appreciably better minority results as compared to other areas nationally. These presumably exemplary school districts appear to do worse by blacks than the “highly segregated” NYC schools.
By parental education level:
Simple means:

In reporting unit B-W gaps
Note: These comparisons are only possible where they provide the data. If the n falls below some very conservative threshold number they mask the data to prevent individuals from being conceivably identified.
Two parent households
It does look like there is a modest correlation between two-parent household status and outcomes using school SES or parent educational credentials. However, it does not eliminate the B-W gap and it is probably at least partially confounded by the fact that higher SES groups are more likely to get (and stay) married these days (put differently, these proxies for SES are crude enough that there is still likely to be significant residual power left in markers like marriage).


These differences do not just show up in test scores alone
Despite the fact that there is substantial systematic variation in academic rigor, grading standards, and course selection across schools nationwide, these patterns are visible in raw GPA and related in-school measures. Even without test scores or adjustments for academic rigor, it is quite obvious that there are large differences in GPA between racial and parent education groups.
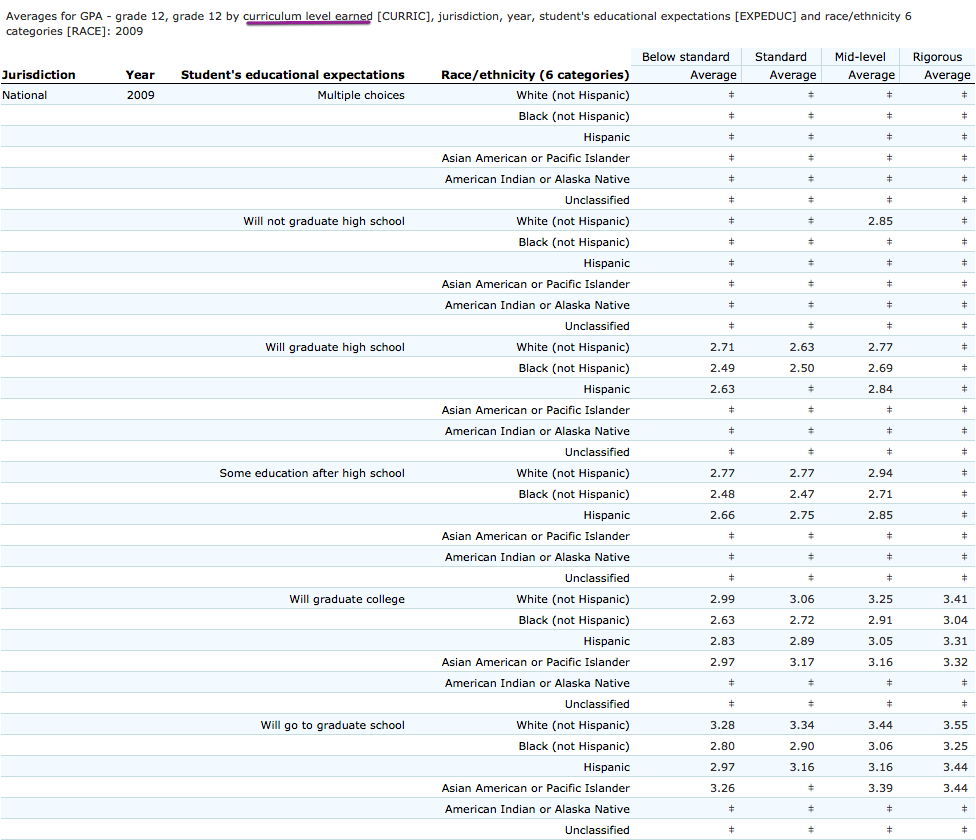
12th grade GPA by race and overall school GPA percentiles

12th grade GPA by race, parents’ education, and school GPA percentiles

The B-W differences are actually larger amongst high SES groups than low SES groups and high SES groups generally earn higher GPAs.
If you go further and look within the reported curriculum level achieved (academic rigour) the differences between groups grow even further and they better approximate the patterns we find in standardized testing.


These patterns are similar even in high vs low minority schools.

There are also large differences in post-HS expectations. Curiously, blacks have actually have notably higher academic expectations at any given GPA / academic rigour level (affirmative action likely plays a large role here!).
This despite the fact that they have lower rates of credential attainment in absolute terms.

The differences in HS “completion” are even larger if you exclude GEDs and the like.

Long story short, these standardized test score differences represent real, objective, and meaningful gaps in academic ability and academic achievement.
A brief exploration of cultural explanations
While I personally believe that “cultural” differences (broadly defined) probably play some role in this, there is not much direct evidence for it in practice.
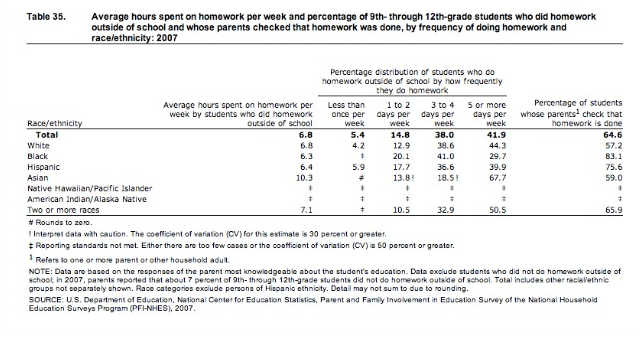
Reported homework hours, for instance, seem to pretty similar between blacks and whites (though I take self-reports with a HUGE grain of salt).
Media consumption is reported to be significantly higher amongst blacks as compared to whites. There does seem to be a correlation between the two, but whites whose parents just graduated HS and report watching 6+ hours outperform blacks whose parents graduated college and watch 1 or fewer hours…

Likewise, differences in reported homework hours don’t seem to “explain” these differences either.


Likewise, while I think there is something to the “acting white” argument (in some sub-groups), we, again, observe large differences in metrics that should be a fairly decent proxy for this sort of thing.
White HS grad kids who supposedly strongly agree with the proposition that friends make fun of people that try to do well in school do about as well as black college grad kids who strongly disagree (and certainly better than their white counterparts with the “same” nominal credentials)

Similar patterns are observed with reported parental involvement with school studies (and there are large differences within groups according to this measure).

Likewise if we look at reading scores according to reported beliefs about learning through reading:

If these self-reports have are remotely honest, then the gaps are much too big, in my opinion, to be explained by plausible differences in subjective views or small differences in forthrightness between the groups. I can believe that there is some difference, which makes 1:1 comparison impossible, but when we observe differences this profound across radically different ends of the distributions it strongly suggests that something more profound is at work.
Objective differences in adult literacy levels
There are similar large objective differences in adult literacy levels as measured by the OECD PIAAC.
Adult literacy by race (& ethnicity) and highest educational credential (detailed)

Adult literacy by race and highest educational credential (collapsed)

Adult literacy by current work requirements education level

and by age group…

Adult literacy by race and income decile

Adult literacy by race and economic sector

[I should have added educational credentials into this!]
Adult literacy by race and hours per week at current job

These adult literacy differences are not explained by parent educational credentials either
Adult literacy by RE & father’s education level

Adult literacy by RE & mother’s education level

It is not just a literacy problem
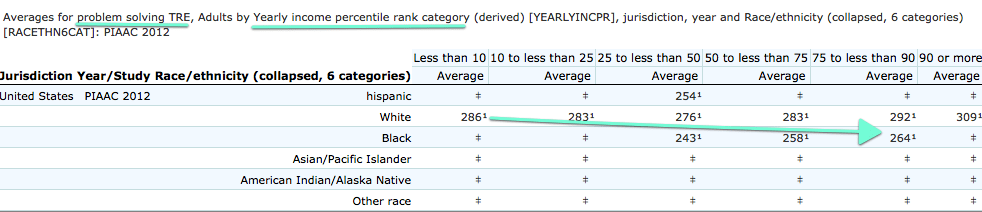
Technology problem solving
Numeracy by income level

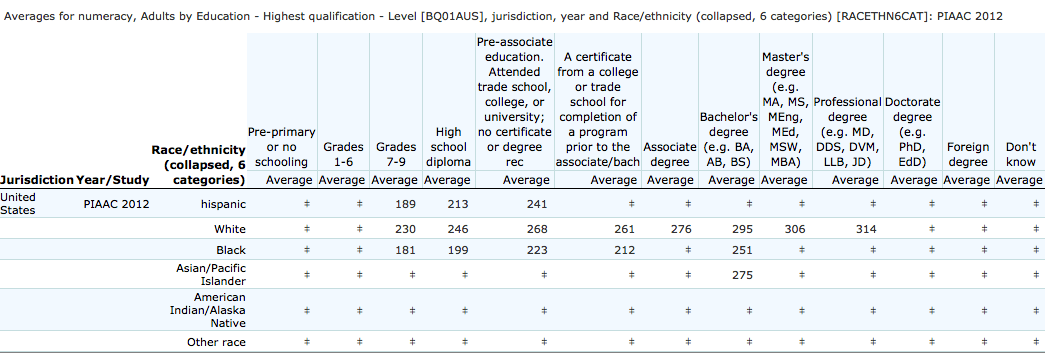
Numeracy by education level
The reason why school/neigborhood SES predicts student outcomes is that parent SES is well correlated with ability and people don’t move at random
There is a strong relationship between SES, as measured by education or income (and especially both combined), and cognitive ability, literacy skills, numeracy, and so on and so forth. That is to say that there are differences in fundamental skills that the vast majority of children today are exposed to in the primary and secondary school. These differences persist well into adulthood.
Adult literacy scores by detailed educational credentials (all race/ethnic groups)

Literacy score by income percentile

Literacy score by income and age group

[Note: There are age specific income patterns due to income mobility and educational pipelines. Also there is a documented decline in fluid cognitive ability as people age…]
Mean income by IQ decile (white men age 40-50)

The point here is that neighborhoods and schools are substantially sorted by ability, conscientiousness, actual acquired education/knowledge, occupational interests, and more. The proxies that we use to try to assess individual SES (e.g., binning nominal educational credentials into broad categories) are, in many ways, less powerful indicators than this same information aggregated at a community or school level.
URMs are typically not held to the same academic standards and tend to produce their credentials and income differently
A significant reason why we see such large differences between people of the “same” SES largely has to do with: neighborhood specific grading standards in primary & secondary schools; affirmative action; “disparate impact” laws and torts; quotas in government and gov’t contractor hiring; individuals sorting into less cognitively demanding occupations (e.g., sales instead of engineering); and so on and so forth. These systems/issues/flaws are not enough to fully offset the underlying problems in URM communities (i.e., most of them are still poorer, less credentialed, etc), but they are enough to strongly skew the statistics when we try to make apples-to-apples comparisons between groups based on educational attainment or income levels.
Put differently, the apparent disconnect between nominal measures of parent SES and childhood academics has less to do with regression to the mean than the fact that very few of the parents ever achieved at comparable academic or cognitive levels as their white or asian peers.


Of course, most progressives assume that childhood cognitive abilities and academic achievement are somehow purchased through better nutrition, better schools, poorly specified “enrichment” activities, and so on and so forth, but this is generally wildly at odds with the evidence or, at least, has little in the way of empirical support behind it. We clearly see that even the highest income and/or highest credentialed blacks fail to perform appreciably better than generally poor and/or uneducated whites (and especially most asian groups here).
These differences start from a very young age
Differences in language processing skills and proxies for cognitive ability are found in children as young at 18 months of age along SES measures–long before differences in school systems have a chance to have an impact.


Note: The low SES groups are approximately where the high SES groups were 6 months earlier in accuracy and reaction time.
There appear to be large differences in some early childhood parenting practices by SES
It appears that there are large differences in verbal engagement and parenting practices by SES.


Of course, correlation does not imply causation!
These differences exist between blacks and whites at a young age
Observed raw verbal IQ scores by age (months)

These differences cannot be explained by SES:
 High SES blacks are performing worse than low SES whites as early as 36 months of age, much like we see in the various test scores later in life.
Early childhood intervention programs have failed to demonstrate significant long-term positive cognitive or academic gains
Not one of the studies that has suggested long-term positive impacts of center-based early childhood programs has been based on a well-implemented and appropriately analyzed randomized trial, and nearly all have serious limitations in external validity. In contrast, the only two studies in the list with both high internal and external validity (Head Start Impact and Tennessee) find null or negative impacts, and all of the studies that point to very small, null, or negative effects have high external validity. In general, a finding of meaningful long-term outcomes of an early childhood intervention is more likely when the program is old, or small, or a multi-year intervention, and evaluated with something other than a well-implemented RCT. In contrast, as the program being evaluated becomes closer to universal pre-k for four-year-olds and the evaluation design is an RCT, the outcomes beyond the pre-k year diminish to nothing.
I conclude that the best available evidence raises serious doubts that a large public investment in the expansion of pre-k for four-year-olds will have the long-term effects that advocates tout.
This doesn’t mean that we ought not to spend public money to help families with limited financial resources access good childcare for their young children. After all, we spend tax dollars on national parks, symphony orchestras, and Amtrak because they make the lives of those who use them better today. Why not childcare?
It does mean that we need public debate that recognizes the mixed nature of the research findings rather than a rush to judgment based on one-sided and misleading appeals to the preponderance of the evidence.


Interventions do not seem to work in primary or secondary school either
Experimentally designed studies, like “moving to opportunity” (MTO), wherein whole families are moved to much lower poverty neighborhoods with better schools find no evidence of lasting significant academic or cognitive gains as compared to the control (intent-to-treat) groups.

 If there are any real academic or cognitive gains they are apt to be very very modest.
The effects of winning the lottery (exogenous income/wealth shock) do not seem to cause significant lasting gains
A study of Swedish lottery winners found similar null results for academic and cognitive outcomes (although this is not exactly an experimental design, the random income/wealth shock gets us very close to it).

And yes, despite the fact that Sweden has a very large welfare state and is more homogeneous than the US (historically), there are still large differences at birth in academic, cognitive, health, and numerous other outcomes.

Quantitive and quantitive data from some of the best open enrollment schools in the country points in a similar direction
Some people argue that experimental designs like MTO don’t mean anything because the neighborhood change wasn’t that dramatic enough (never mind that the data shows that it was very significant). Presumably they think that the “best” schools with the highest test scores are that way because they spend a lot of money…. or something.
To this I say, take a look at Lower Merion in suburban Philadelphia and this 2006 article on academic outcomes of (relatively middle class) blacks there:
With an average household income of $86,373, LMSD can spend $19,392 per pupil annually, more than twice as much as the majority of Philadelphia’s schools and more than nearly every other American public school district. Lower Merion High School, one of the district’s two high schools, was one of the Wall Street Journal’s top 60 high schools in April 2004, public or private, and given that the median Lower Merion home costs $334,500, it is unsurprising that 94 percent of graduates attend college. District schools routinely win some of the most prestigious state and national competitions, such as the National Science Olympiad. Eighty percent of the district’s students are proficient or better in math and reading on the Pennsylvania System of School Assessment (PSSA). But what the white Main Line sees as a source of pride infuriates South Ardmore, where most of LMSD’s few blacks live. Only 27 of LMSD’s 500 black students are identified as gifted; for whites, 790 out of about 6,000 make the cut. (That’s five vs. 13 percent.) One in four blacks is in special ed.
Most alarming, 60 percent of black students are not grade-level proficient in reading and math in a school district flush enough to provide many staffers with snazzy digital organizers and to test-drive a global positioning system to track its school buses. Which is why, at that highly charged January meeting, Mosley also said, “We are particularly enraged that this district dares to take credit for being one of the top school districts in the state, even the nation, at the same time that it allows our African-American students to stagnate!”
One district, two very different realities–that much is clear. What we don’t know is whose fault it is that Main Line children are doing so poorly–whether the school district is to blame, or whether, as Bill Cosby has pointedly suggested in recent remarks, much of the fault may lie with black parents and students themselves.


The black students at lower merion are (at worst) lower-middle class, neither rich nor poor, whereas the whites are mostly upper-middle class. Most of them went through the same schools as everyone else starting in kindergarten and their neighborhood (south ardmore) is not a crime-ridden “ghetto”. And yet, not only do they perform worse than their mostly high SES white peers, they perform worse than the state average. Clearly their deficit cannot be explained differences in school quality.
Many people seem to forget that the parents of these “rich” schools are (mostly) highly educated by national standards. Intelligent well educated people are far more likely to have children that are also intelligent and well educated (both genetic and cultural).


Similar patterns are found in other “good” schools with substantial black proportions, especially when there are significant SES differences. The reason why “good” schools are “good” on aggregate has much, much more to do with the sorts of students in them than the inputs associated with the schools themselves (e.g., per pupil spending, teacher credentials, class size, computer labs, etc). There is little, if any, systematic relationship between “good” in the marginal, value-add, sense of the word and good aggregate performance. Predominantly high SES white schools (like Lower Merion) are good mostly because the students are smarter and more motivated than average. Different groups perform differently mostly because they are different, not because of the school “quality” for the most part.
A brief analysis of Pennsylvania’s PSSA test results

[blacks perform much worse than their white peers in the same schools in general]

[white scores are uncorrelated with URM proportions, whereas black scores appear to be modestly correlated]

[overall scores are well correlated with economic disadvantage]

[but different groups clearly experience different outcomes in the same schools. Whites and asians significantly outperform blacks even in significantly disadvantaged schools]

[Predominantly URM schools are more likely to be poor, but there are still many “white” schools that are poor too. It’s not surprising the URM proportions correlate with underperformance for blacks, in particular, for this reason]

[White outcomes correlate somewhat with economic disadvantage proportions]

[Black outcomes correlate better with economic disadvantage than URM proportions.]

[When we compare directly by score, we find that whites and asians are much more likely to reach “advanced” attainment levels than their black peers]

[Likewise for whites and asians versus latinos, albeit to a lesser degree]
The SAT and the PSSA correlate strongly…


Note: The “effect sizes” of parental education are generally much higher than parental income.
Data from interracial families
It appears that black children with white mothers experience approximately intermediate cognitive and academic outcomes. See this study by Peter Arcidiacono et. al.

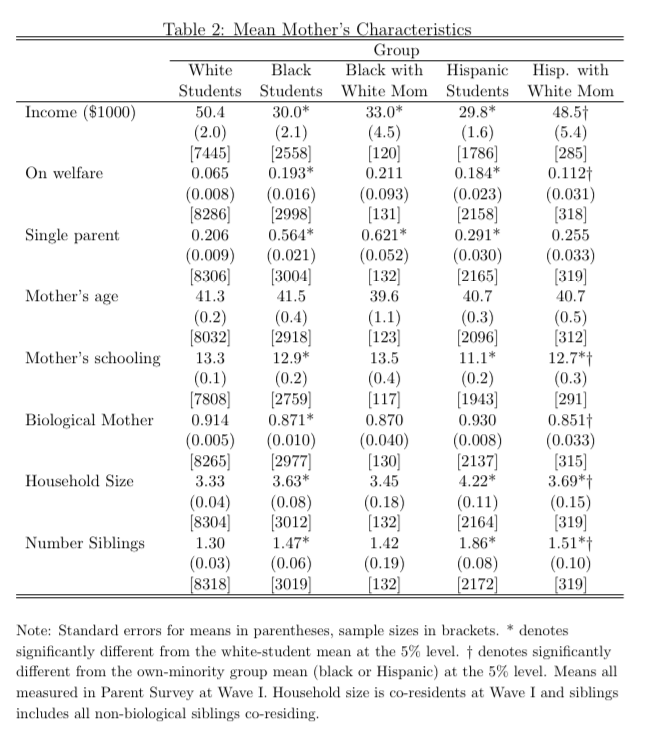
Note: The family characteristics of the black children with white mothers is, by many measures, worse than their black counterparts-see income, single parent, welfare status, etc.
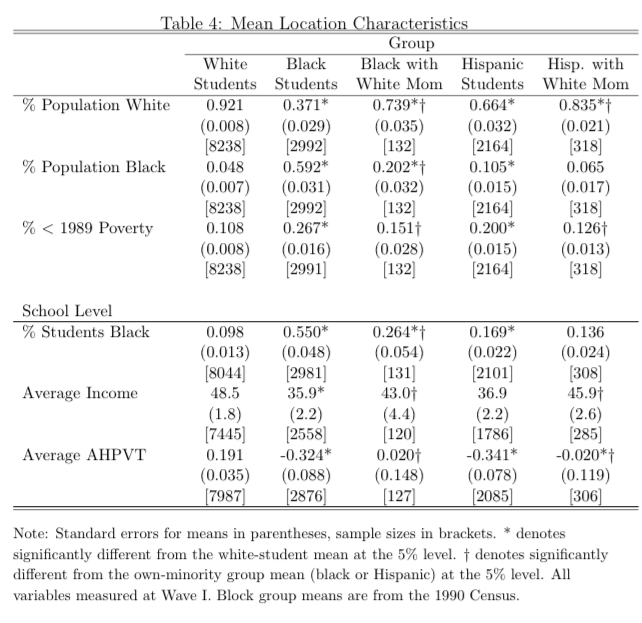
Note: The black children with white mothers lived in somewhat “whiter” neighborhoods and attended “whiter” schools, but the economic characteristics of the neighborhoods and, especially, the schools are pretty similar otherwise.

Note: They report that both the mother and father typically have similar mean IQ scores, scores that are about half way between the overall white and black means. Also, the black fathers appear to be less involved in day-to-day childrearing in the interracial case.
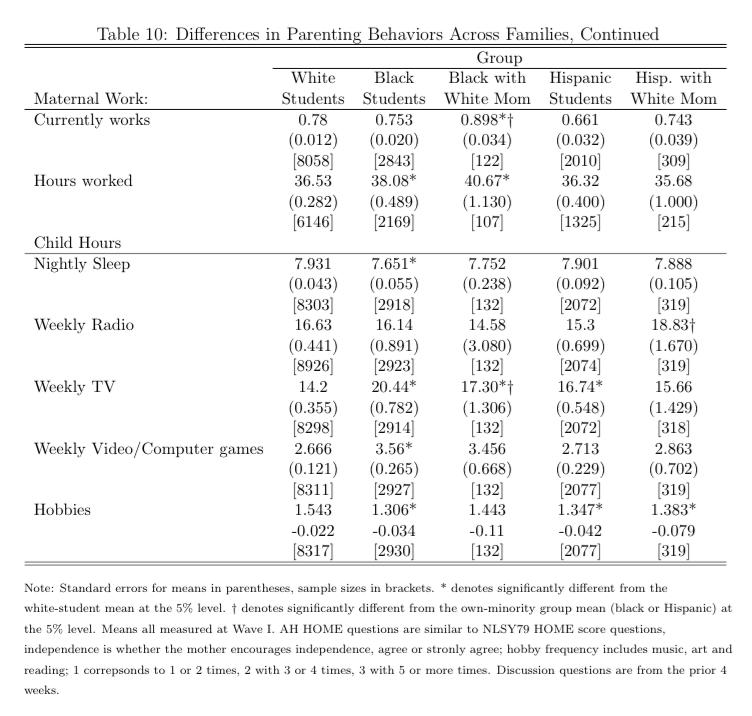
Note: Small differences in media use, sleeping, etc. The white mom’s of black children are more likely to work and work longer hours.
Regression analysis for black boys (mixed and otherwise).
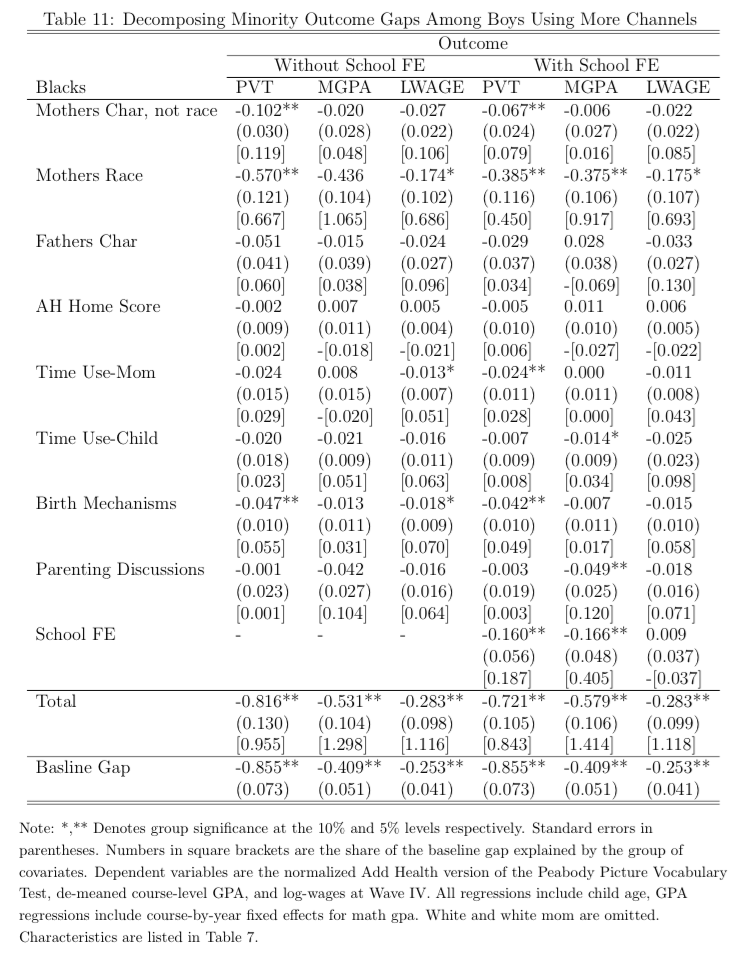
Note:
Mother’s characteristics: income, on welfare, single parent, mother’s age, mother’s education, and biological mother.
Father’s characteristics: child knows anything about, child lives with, child ever lived with, child speaks to weekly, HS diploma, some college, college degree, no child support requirement, missing race, missing education, and monthly child support payment.
Their baseline IQ GAP is 0.86 SD and the mother’s race with assorted controls accounts for 0.57 SD without school fixed effects and 0.36 SD with school fixed effects. Those gaps are still significant and that is with a fairly generous set of assumptions regarding the arrow of causation and the comparability of educational credentials…
The authors of this paper rule out genetics early on with nary any thought and then go on to argue that socially defined race or skin color gaps can be almost entirely explained by “observables” (which includes the mother’s race, amongst others).
 Moving from model 1 to model 3 (more controls) causes the apparent effect of the students “race” (black or hispanic) to fall to below the level of statistical significance. This would appear to suggest that once you control for the race of the mother and her educational credentials that the race of the child, her income level, and the like are of relatively little importance.
Note the large gap between the effect of the mother’s educational credentials and the father’s educational credentials. The mother’s college degree accounts for ~0.3 SD but the father’s college degree is only worth ~0.1 SD. Likewise, the mother’s HS degree is worth ~0.1 SD whereas the father’s is worth ~0.03 SD. This ought to jump out at people.

We do not see these sorts of patterns when we look at the national data within racial/ethnic groups. The mother’s and father’s education credentials are about equally predictive and they appear to be quite additive.
The regression analysis shows much the same thing:

We do, however, observe familiar and pronounced differences across racial/ethnic groups in the matrix. Black kids whose parents both graduated from college score just 5 points (~0.15 SD) better than white kids whose parents both failed to graduate from high school.