My response to the NYTimes article on school districts, test scores, and income.

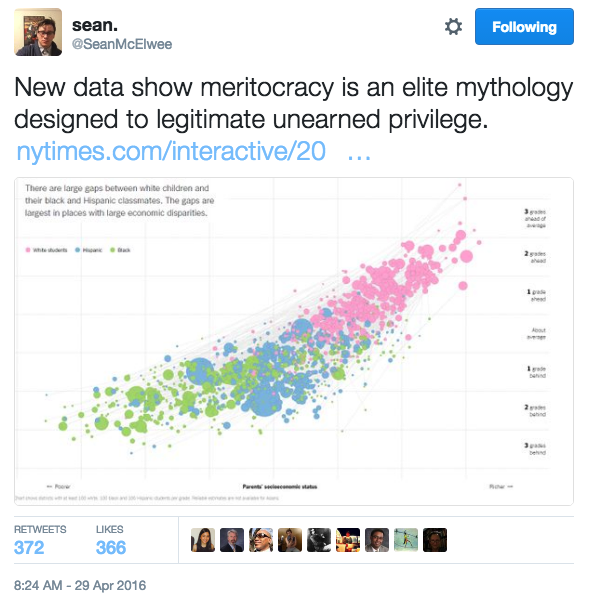
On April 29th the New York Times posted a nominally data driven article on school districts, test scores, and socioeconomic status.   Though it contained some useful data, the analysis was terribly misleading and it excluded a tremendous amount of pertinent information.  Many progressives took the article as proof that the system is “rigged”.

screenshot_450.png

The NYTimes did not help matters by conflating the measures of socioeconomic status (SES) with income.  Although every one of their plots used a composite SES measure on the x-axis, the article itself and various annotations give a strong impression that money/income/wealth are the primary drivers of this:

screenshot_449.png

The words income, economic, wealth, money, rich, poor, and other related words were littered liberally throughout the  article.  Not a single mention was made of other predictors or even of the composition of the SES index they used, save for an easy to miss footnote at the end of the article.

The SES measure they used was defined in the SEDA archive as:

the first principal component factor score of the following measures: median income, percent with a bachelor’s degree or higher, poverty rate, SNAP rate, single mother headed household rate, and unemployment rate

[emphasis mine]

These non-economic dimensions actually exert significant influence on the correlations, are not directly tied to income/wealth/etc, and show marked racial/ethnic differences even at the same income level (e.g., single motherhood rates are much higher in the black community at any given level of income)

Rather than focus too much on what is wrong with this specific article (this sort of article is practically a genre unto itself these days), I will instead systematically address misperceptions here and attempt to shed more light on the nature and underlying causes of these patterns.   I will argue that (1) these gaps are mostly genetic (2) they generally have little to do with systematic differences in parental economics (3) they have even less to do with the school systems themselves (4) these patterns are not unique to the US.

I will use some data from the Stanford Education Data Archive (SEDA),  the same used by the NYTimes article, to help make some of my points but, unlike some of my other blog posts, I will try to cover each point in just enough depth to convey the gist of it (linking out for more in-depth analysis for those that are interested in the particular point).  I will also bring together good deal of supporting evidence that is buried in different academic articles, government databases, think-tank research, and so on.

No, the SAT doesn’t just “measure income”

I started this post to refute some specific arguments, but I changed my mind midstream and decided to add a lot more material than I initially envisioned. This is best viewed as being akin to a FAQ (Frequently Refuted Objections – FRO?) relating to the standardized tests and their use in higher education.

SAT and income are not perfectly correlated

The SAT is certainly modestly correlated with parental income, but it is simply not true that the SAT is nothing more than a measure of family income.

I will briefly plot the 2011 SAT reading scores by income level to illustrate that the r**2 is considerably less than one.

There is significant overlap across the entire income distribution:

satv_boxwhiskers.png
Box and whisker plot of simulated test scores
satv_distribution_by_count.png
Simulated distribution by actual test taker counts

On the relationship between negative home owner equity and racial demographics

There are a large and growing number of popular media articles alleging racial discrimination in the mortgage market.   It is simply assumed that if lenders are less willing to extend credit to blacks or make loans in “black neighborhoods” as often or with similarly favorable terms as they do whites or “white neighborhoods” that this apt to be explained by explicit racism or (subconscious) bias.  These naive arguments persist despite tremendous evidence that there are observable and unobservable differences that have profound effects on credit risk.

I will briefly describe some of this evidence before making my own modest contribution using data from zillow.com and the US census. You can click here if you are familiar with this literature already and wish to skip ahead to my analysis.

1- Blacks have much lower credit scores (e.g., FICO) 

Google Chrome.png

source

The difference in between the white and black means is about 1 standard deviation.

On the effects of wealth on the B-W gaps, a response to questions posed by a commenter

Max, a commenter, asked:

Could you do an analysis on racial differences in educational outcomes after controlling for parental education, parental occupation, household wealth, neighborhood wealth, neighborhood education, single parent status, native language etc.? I’ve seen you control for family income and parental education (and occasionally both), but I’ve never seen you control for more beyond that (perhaps I’ve missed something!). In Chapter 16 of Affirmative Action for the RichThe Future of Affirmative Action, Dalton Conley of New York University used the Panel Study of Income Dynamics to show that parental wealth (not income) and parental education are the best predictors of college completion, which means that they may also be good predictors of other educational outcomes. He also discussed the data showing that racial wealth gaps are much larger than racial income gaps, which implies that wealth could account for a larger portion of the achievement gap than income. Could you do a similar analysis for IQ? The reason I’m asking for all this is that Carnevale and Strohl control for all of these factors and are left with a very small race effect: http://www.tcf.org/assets/downloads/tcf-CarnevaleStrivers.pdf

I have heard this bit about wealth before.  I am deeply skeptical that wealth can mediate much, if any, of the B-W gap.

Before I dig into this though, let’s take a very brief look at some of the studies Max cited (see here and here) :

A quick post on gun related homicides

While I am personally ambivalent about gun ownership and suspect it plays an incremental role in relative differences between countries/regions/etc (holding other things roughly equal), I thought I’d add some perspective into this argument about the presumed causality of gun ownership on homicide rates.

Mother Jones analysis includes gun suicides and makes no attempt to correct for even course-grain racial/ethnic confounds.


I downloaded the 2009-2013 data for gun-related homicides by race/ethnicity from the CDC’s WONDER database  and compared it to the gun ownership rate data via wikipedia.

gundeaths_by_gunownership

I do not feel like doing a lengthy analysis here and now, but suffice it to say that once you remove suicides and race/ethnicity from the equation the case gets much weaker.

There is no evidence of a positive correlation here for blacks and hispanics (if anything somewhat negative).

There is a positive correlation for non-hispanic whites (r=0.45), but it pales in comparison to the racial/ethnic differences here.  To put this into perspective, amongst non-hispanic whites (the bulk of the gun owners in most states), states with the highest gun ownership rates have just 1 death per 100,000 more than states with the lowest rates (on average).

On SAT, ACT, IQ, and other psychometric test correlations

Although I touched on this topic briefly before, I seem to have forgotten some relevant plots and data and don’t feel like editing the last one, so this post is somewhat redundant…

Both the SAT and ACT are quite well correlated with IQ tests, so much so that you can make good guesses about someone’s IQ if you know their SAT/ACT score and vice versa.

sat_composite_by_asvab_iq

asvab_by_sat

On sex differences within California public schools

A year or two ago I read an article which demonstrated that sex differences in math and reading achievement are inversely related within and across countries on the PISA tests.  The smaller the male-female math gap, the larger the verbal gap and vice versa.  This tends to support the view that there are innate underlying differences in average abilities and interests between the sexes that strongly influence these patterns.


Google Chrome


Google Chrome

On educational attainment rates and income as a causative factor

As I mentioned to Robert VerBruggen in his latest piece on educational attainment and income, I do not believe that economic concerns are a major cause of differences in education attainment rates by income.

I previously analyzed this and related issues using the ELS:2002 data, but I decided to extend my analysis with NLSY97 and clarify my views, now that I have marshaled a fair amount of data to support my arguments.

First

Although the IQ (ASVAB) is an excellent predictor and generally mediates these differences fairly well, there are other systematic differences that are not fully accounted for when you control for IQ.   High SES people, whether measured by income or educational attainment, typically have higher GPAs even with the same test scores.

gpa_by_asvab_income_b5

hsgpa_by_asvab_fed

(these differences would likely to be larger still if I did this as a composite SES index using education, income, occupational prestige, etc)

IQ, test scores, GPA, income, and related correlations from NLSY97

Diving into the NLSY97 dataset a bit right now and I thought I’d share some plots pertaining to IQ/achievement tests, income, GPA, educational attainment, and more.   Nothing here is particularly novel, if you’ve looked for this sort of data before, but sometimes it’s nice to have additional independent analysis or alternative presentations of the data.


High school GPA-test score relationships

HS GPA by ASVAB in percentiles (IQ test)

gpa_by_asvab_q25

HS GPA by PIAT (Peabody Individual Achievement Test, IQ test admin. in early childhood)

gpa_by_piat