Although it may not seem like it at first blush, given the apparently modest correlations, the socioeconomic figures that I blogged about earlier largely agree with the published data on economic mobility.

They are measuring income (or earnings) whereas I am measuring with the ELS SES index (which is an equally weighted average of the respondents own earnings as of 2011, educational attainment, and occupational prestige), but the systematic income differences between classes (however measured) are almost certainly virtually fully mediated by this more comprehensive SES measure.
ELS data, students 2011 SES by 2002 SES of parents

The correlation between parent SES and child SES is 0.35. This may not sound like much, but if you bin child SES and parent SES into quintiles the mobility estimates are very similar to the widely publicized economic mobility estimates.


The average person born at the top of the SES distribution has little chance of ending up at the bottom and vice versa, but there is clearly a great deal of mobility that happens amongst less extreme groupings.
[Note: I didn’t correct these figures for oversampling, so I won’t claim they’re a perfect representation of reality, but they are generally pretty close in practice and they still are good for illustrative purposes.]
Mobility delta (child SES – parent SES) by parent SES

On average, as compared to their parents, high SES people are downward mobile and low SES people are upward mobile. This may seem counter-intuitive to some, but this makes sense because r < 1, i.e., there is non-trivial mobility, and this must be true for there to be meaningful relative mobility. Of course, just because there is mobility doesn’t imply that all people have an equal chance of ending up in any place in the SES distribution.
As I mentioned in my last post, there are other differences between groups besides just propensity to end up in particular SES bins and many of these differences are highly predictive of mobility — see test scores, HS GPA, etc. Indeed, they almost fully mediate outcomes, so talking in terms of “mobility” here can be a bit misleading because relative starting position (parent SES) tells you relatively little about what is likely once you have better information (e.g., test scores, HS GPA, etc).
Quantifying the differences in test scores and high school GPA
2002 composite test score by parents SES

Histograms of HS GPA by parent SES decile

Histograms of test scores by parent SES decile
Predicting mobility with 2002 test scores and HS GPA
I setup a linear model using just the 2002:ELS composite score and the 9th-12 grade GPA (which is binned into 0.5 increments, unfortunately).

The correlation of this HS-era predictor with 2011 SES is 0.52. As compared to parent SES-child SES correlation of 0.35 or the parent income-child SES correlation of .28, it is very strong.
The predictor variable (here on “academic index”) values, in turn, are far from equally distributed.
Academic index histograms by parent SES decile

Low SES groups have notably lower test scores and lower HS GPA than higher SES groups.
It is surely not a coincidence that the SES mobility plots look very very similar.
2011 child SES histograms by parent SES decile

Less than 5% of people in the bottom deciles have academic index factors in the top decile and less than 5% end up in the top decile as “adults” (actually slightly more than would be predicted). The predominant reasons why some groups end up where they do is hardly mysterious (at least not at the intermediate level, i.e., test scores and HS academic performance). We can make good expected value estimates of adult SES by the time people graduate from high school, regardless of their socio-economic status, and we can explain most all of the systematic differences in eventual SES (not just “mobility”) with these same measures. Individuals in low SES groups that post high test scores and have high GPA clearly experience substantial SES mobility on average, much the same as what we would predict from medium to high SES groups with the same (crude) stats.
That’s not to say that these imperfect measures alone explain everything though….

It looks like there is a roughly 0.5 SD gap between the predictions of the 1st and 10th decile. Keep in mind that (1) HS GPA variable is not continuous (2) grading standards aren’t the same across all schools (3) this makes no account for academic rigor (4) parent SES is heavily weighted towards parental education (it’s much more than just income). In other words, HS GPA, as measured, is surely net-net a bit biased against high SES groups here on average.
Also, as I mentioned in a prior post, low-stakes 10th grade test scores aren’t a perfect reflection of adult cognitive ability. Some residual is to be expected and this residual will tend to ‘favor’ high SES groups (I have, myself, observed similar effects consistently in other analyses, e.g., high SES groups perform better in 3rd grade, but this gap increases throughout school)
If we group by parent SES deciles and plot the average (“adult”) 2011 SES by the HS academic based prediction, we can get a better handle on the relationships here.
Average adult SES by average high-school era academic index prediction

Without any systematic error the points should fall closely on the diagonal line. There is clearly some systematic error here. That error, however, is obviously present for all points and it’s pretty clearly linear. In other words, it’s not as if the top decile tear off above what you’d expect from the trend, as we might expect if we thought that “pull” or “connections” have particular explanatory power for mobility. To the contrary, it’s very much inline with the other deciles.
As I mentioned in my prior post, we can improve the predictions by adding parental education levels into the model (r=0.54) and practically eliminate this error at the same time.
Grouped by parent SES decile

Obviously parent SES includes their education levels, but the results are fairly similar for parental income levels too.
Grouped by family (parents) income level

Likewise for occupational category/status:
Group by father’s occupation

Grouped by mother’s occupation

Grouped by race
Grouped by race and sex

To change perspectives for a moment….
Another way of understanding this is to look at the high school era profile of the resulting SES groups.
2002 test score histograms by 2011 (“adult”) SES decile

There’s about 1.5-2 (national) SD difference between the means of the 1st and the 10th decile (eyeballing it).
HS GPA histograms by 2011 SES deciles

Most people in the top decile obtained at least a 3.5 in high school whereas very few people in the bottom decile did.
If we combine HS GPA and test scores together, the overlap between the 1st and 10th decile are exceedingly small.
Academic index (HSGPA+test scores) by 2011 SES deciles

Academic index and parent education prediction histogram by 2011 SES deciles

My point here is that there are, on average, large objective differences between these SES groups. Two neighboring SES groups may be relatively similar in profile, but by the time you compare across 5 or more deciles these differences are profound (even as observed with these imperfect measures!).
This has implications for the probabilities of an individual with a particular set of attributes (e.g., intelligence, conscientiousness, motivation, etc) ending up in particular SES groups and, from a genetic and/or cultural point of view, their offspring’s eventual mobility probabilities. If there was much more overlap in practice, if the differences between groups was mostly one of luck or nepotism, the genetic influences on mobility would be much smaller than they seem to be and we probably wouldn’t expect to observe stark differences in high school (or even elementary school!). If, on the other hand, we observe large average differences between working adults in these groups (we clearly do), we can expect substantial, if not quite as large, differences between their offspring given what we know about the genetic heritability of intelligence and other phenotypes of interest.
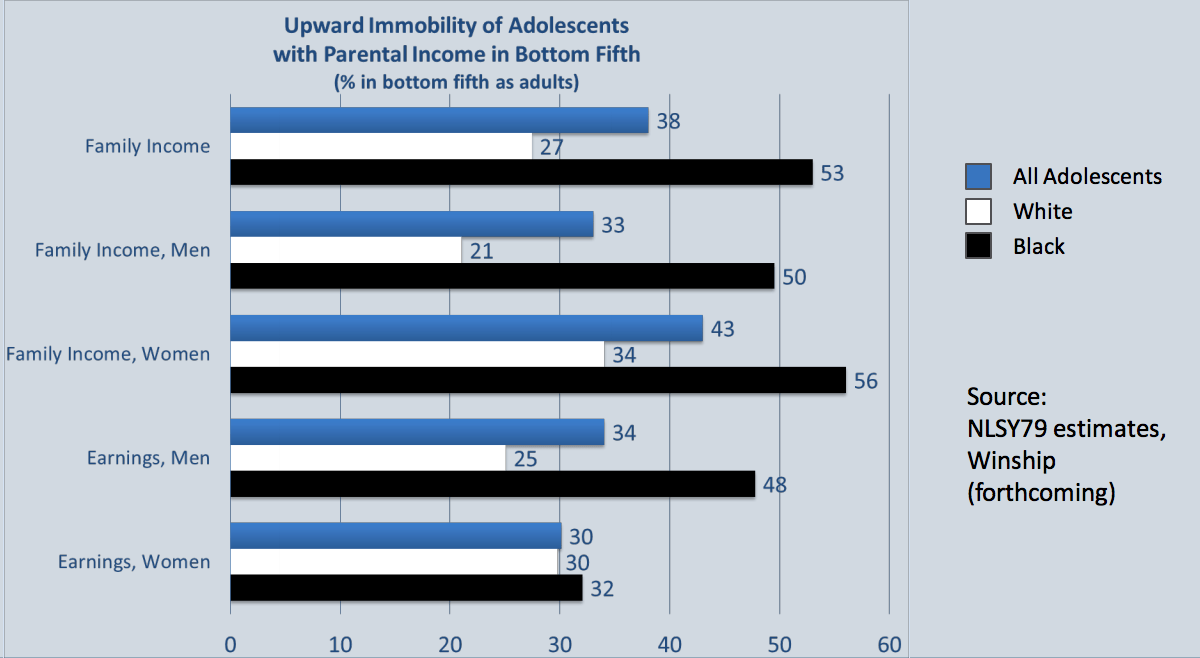
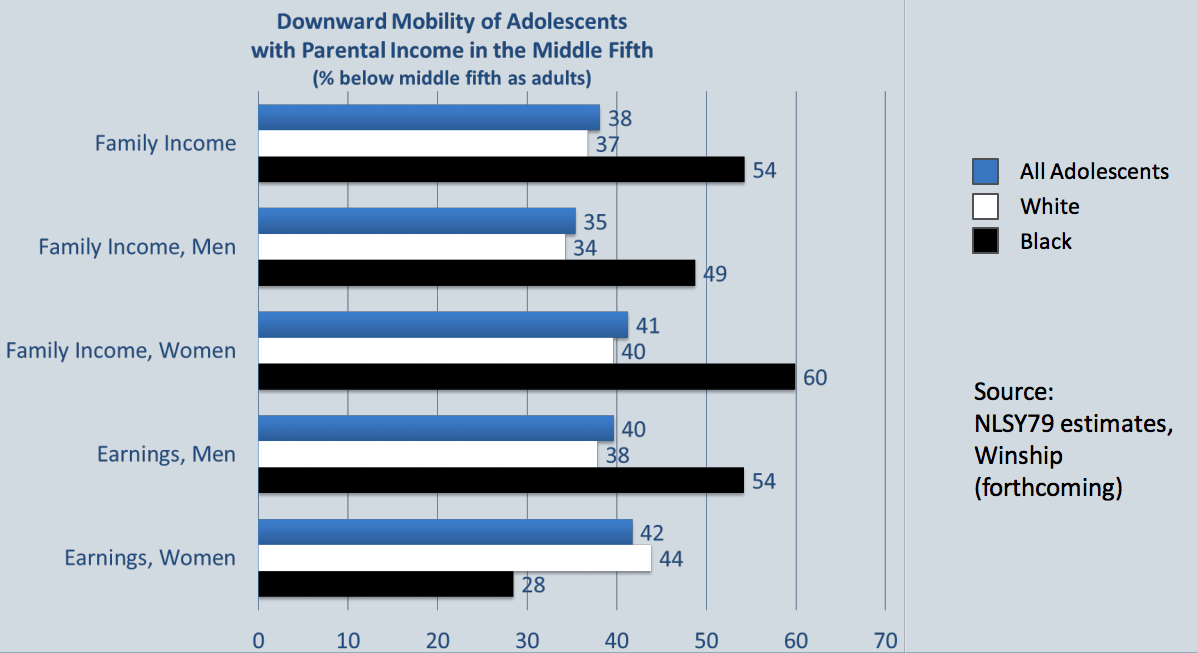
Relative mobility by parents SES

(ignore the typo please 🙂
Relative mobility by parents SES (grouped by race/ethnicity)

Relative mobility by parents SES (grouped by parents SES decile)

Relative mobility by parents SES quintile

Relative mobility by parents SES (grouped by race)
[You might notice that asian mobility is generally greater across the entire distribution, especially lower SES parts. Blacks, conversely, perform well below average….]


This one is a bit hard to read and isn’t perfect because of binning effects (not to mention the above mentioned issues with HSGPA comparability and the like), but it nicely summarizes much of the actual observed patterns in the data (!!!)….

Observe:
- People born in the bottom SES quintile with the top quintile academic index (HS GPA + 2002 test score) experience rapid upward mobility [see bottom left corner]
- People born in the top quintile of SES with bottom quintile academic index experience rapid downward mobility [see top right corner]
- Generally speaking, each cohorts histogram looks more like their ability groups in other SES groups than their own SES group at other ability levels (and this masks some underlying differences in ability too)
Of course, the mode for each group is masked by the density plot mode. If we instead plot this data by the actual observed count across childhood SES, the reason for the generally observed mobility differences become quite apparent, i.e., there are proportionally very few high ability (5Q) first quintile SES people and very few low ability (1Q) 5th quintile SES people.

Conclusion
We live in much more of a meritocracy and there is more churn than many people today believe. It may be something less than perfectly fair and there may be some element of serendipity, but the evidence strongly supports the view that most of the systematic differences between groups (race, class, etc) can be predicted based on very reasonable predictors like HS GPA and psychometric test scores. That mobility is less than some people may prefer is largely a function of actual demonstrable differences in the abilities of people, whatever the cause, although there are apt to be a large genetic and probably, to some degree, social capital/cultural element to this as well that have relatively little to do with economics, nepotism, and the like.
To preemptively answer some possible objections/questions…
1: The parent SES index and parent income groups are well correlated (r=0.70). 
2: The student SES and earnings are well correlated (r=0.65)

[Keep in mind that it’s early days for many of these students as relatively recent grads and some people may forgo some early market returns for additional education or higher prestige jobs with better income potential]
3: There are good, first principle, reasons to expect this SES index differences to be a good predictor of future earnings differences. Students that have some combination of higher (current) earnings, higher occupational prestige, and higher educational attainment will almost certainly have higher average earnings in the future. [If high SES ~25 year olds don’t have higher average earnings, higher average occupational prestige, or higher average educational attainment by then, exactly when is this signal supposed to emerge? By what mechanism? Conversely, if low SES people way above average high educational attainment, high occupational prestige, etc at ~25 years of age, what, pray tell, is going to stop their mobility past that point??]
4: The mobility relationships are consistent with broadly reported economic mobility statistics.

In other words, it is not as if I am completely contradicting the actual quantitive findings reported! Rather I am characterizing it, putting a whole lot more detail behind it, and describing methods to predict mobility
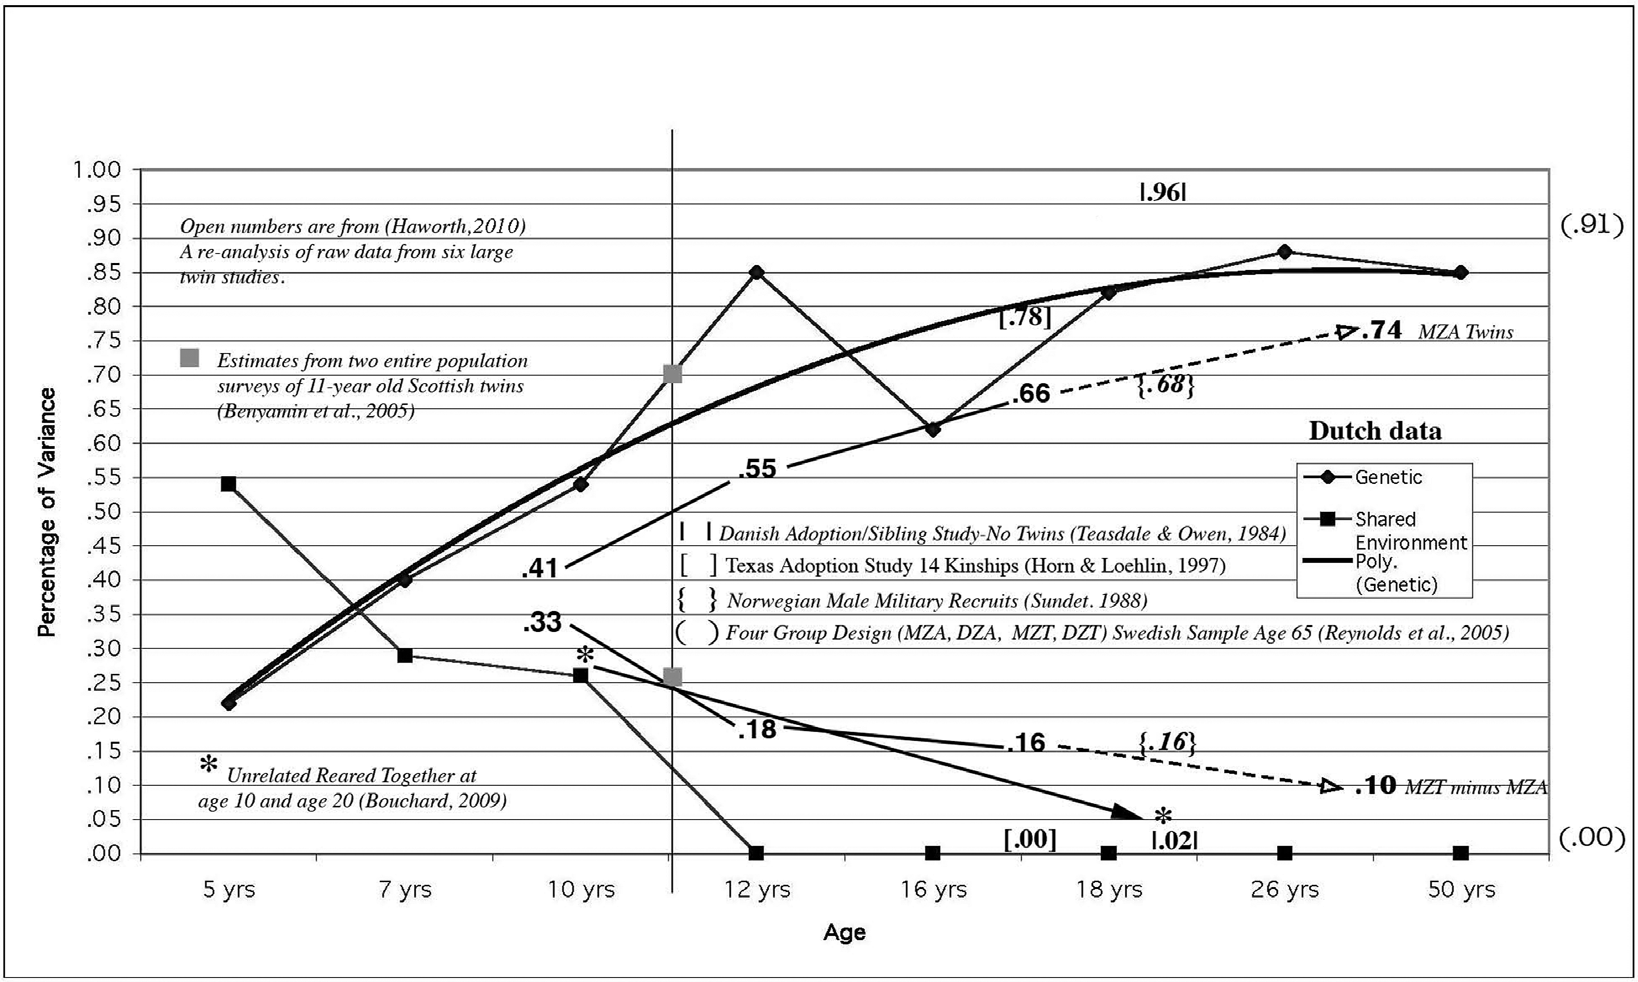
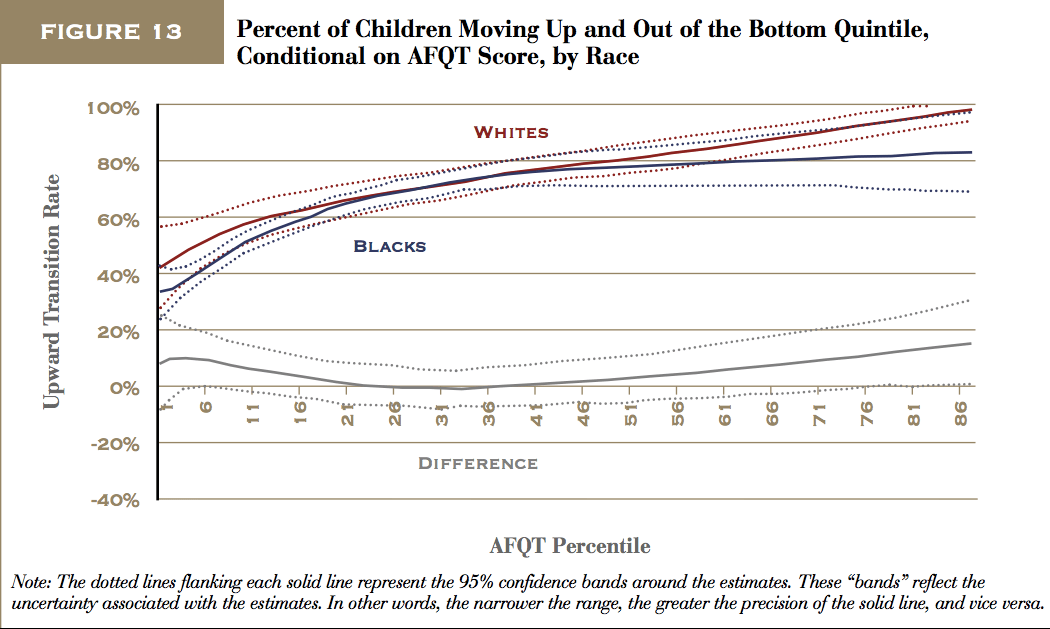
5: Other studies have reported that psychometric tests (e.g., AFQT) are strong predictors of both earnings and (relative) mobility. They have also reported that these sorts of tests mediate the mobility gaps between racial groups.
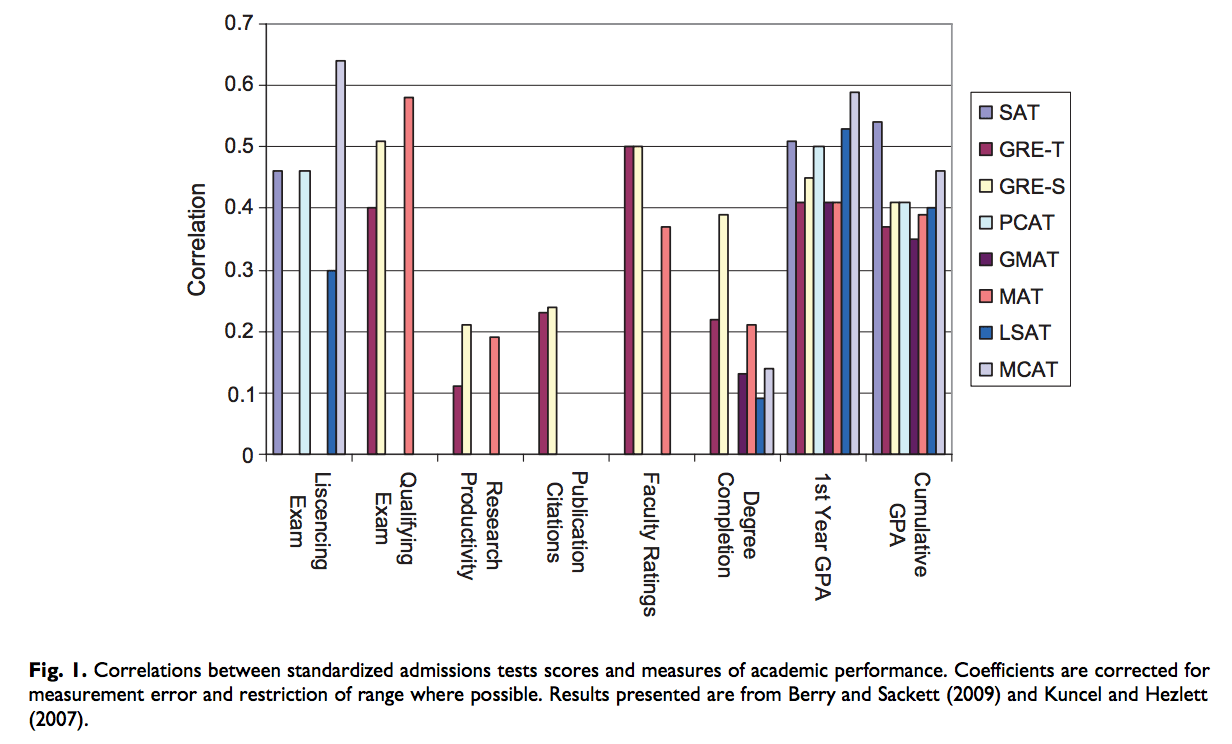
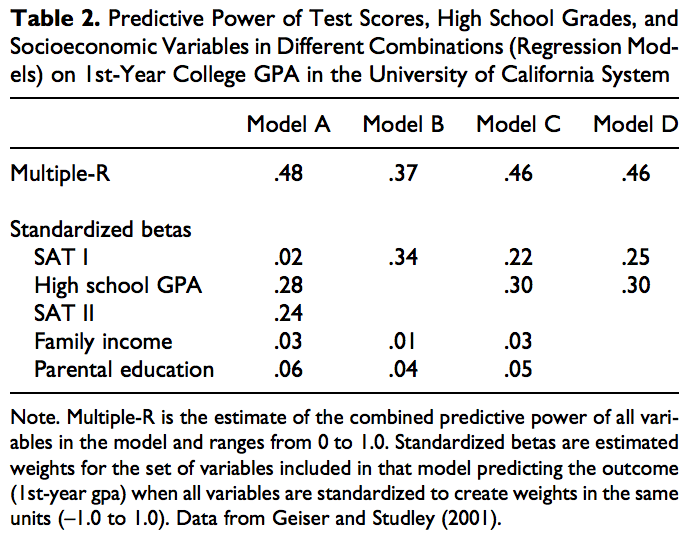
6: The predictive validity of psychometric test scores in universities and beyond is well validated, especially when used in combination with HS GPA.

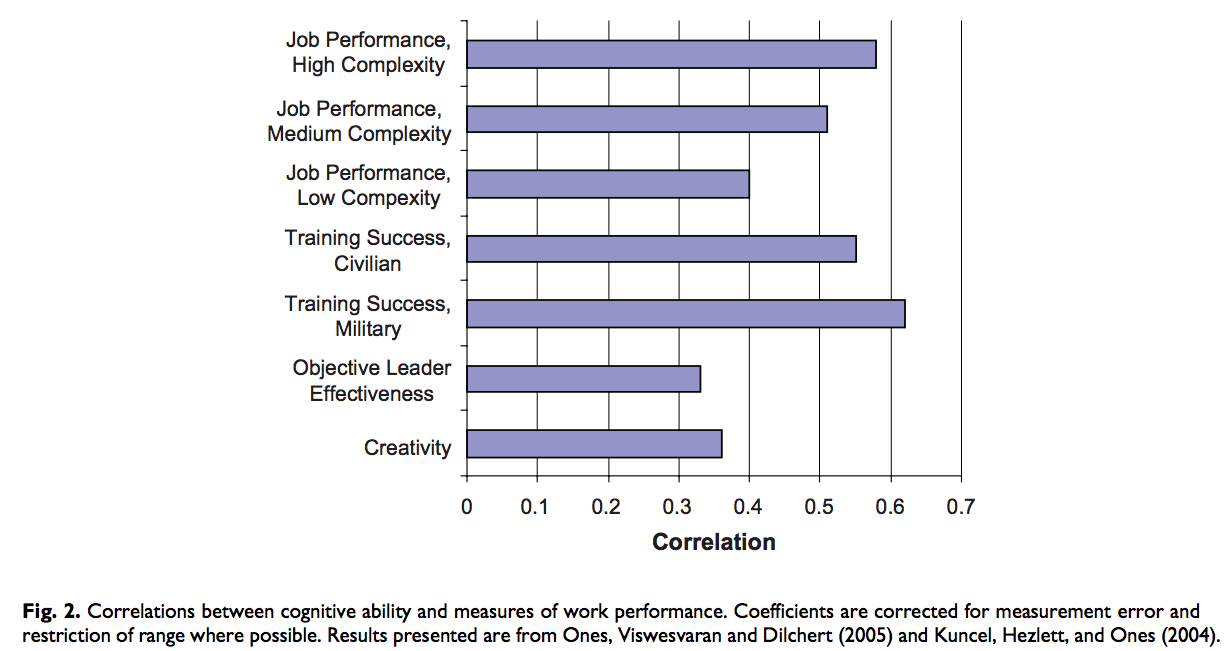
7: Other sources have validated the relationship between IQ and income.

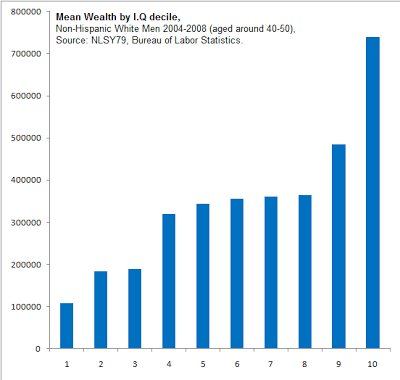
8: Other sources have also demonstrated that IQ is a superior predictor of long run wages relative to SES.

9: Test scores almost fully mediate the relationship between family SES and academic outcomes.
[You may also note that, here too, parental education is far more predictive than family income]
10: Many analyses, my own included, strongly support that notion that any SES effect is almost certainly mediated by parental education, i.e., neither income nor wealth are apt to play a large causative role. Family income (or wealth, or poverty, etc etc etc) are correlated with outcomes largely because income is correlated with intelligence and other traits of interest, which are usually reflected reasonably well by educational attainment (not perfectly). Once you control for educational attainment, the correlation with income largely disappears (or see this)

11: Intelligence and many other important traits (e.g., conscientiousness) are highly heritable and this heritability is likely to play a large causative role in economic mobility (or lack thereof) patterns.
12: The evidence tends to suggest that systematic differences in “school quality” plays a minor role, if any at all. Likewise for “concentrated poverty”.
13: Although people tend to sort into school districts and into specific schools on the basis of SES to varying degrees, large differences between groups are routinely observed by parental educational attainment and by race within the very same schools (see data by average scores or reference group). In other words, actual differences in school quality (even independent of economic inputs, class size, etc) are apt to be modest and not explain much of the observed disparities between groups.


14: If meaningful economic mobility is a myth or the differences between groups just have to do with school quality, then how did it come to be that asians dominate academically? Why do they have higher educational attainment? Why are asians the highest earning racial group in the country today? (Likewise for Jews in earlier generations) Why haven’t the gaps between whites and blacks closed appreciably over the past few decades, despite massive increases in school funding, reduced discrimination, etc etc?

[It seems to me that there is much willful ignorance of the the facts from a certain breed of progressives today. Instead of recognizing facts, like actual consistent patterns in test scores and objective measure of academic accomplishment, between SES groups and between racial/ethnic groups, they instead blind themselves to these facts and invent a lot of fairy tales to explain away these sorts of patterns….]
15: The evidence strongly supports the view that SES per se is a much stronger predictor of offspring educational attainment and economic mobility than direct economic measures. Ergo, even if the educational attainment and occupational prestige aspects of the SES index are distribution-ally different than income to some important degree, it is highly likely that these measures will predict what happens in the future better than income does, even with respect to earnings alone.
16: The relative mobility patterns depending on starting positions (parent status) are broadly similar whether measured by income or SES, i.e., top SES people are similarly downward mobile whether measured by income or a broader SES index (in my analysis) incorporating educational attainment and occupational prestige.


Incidentally, r=0.37 for parent-child SES percentile. If we want to be ridiculous (for a moment), we can always point out that parent SES only “explains” ~14% (r^2) of the rank order variance (much like people frequently do with standardized test score predictive validity and the like :-).
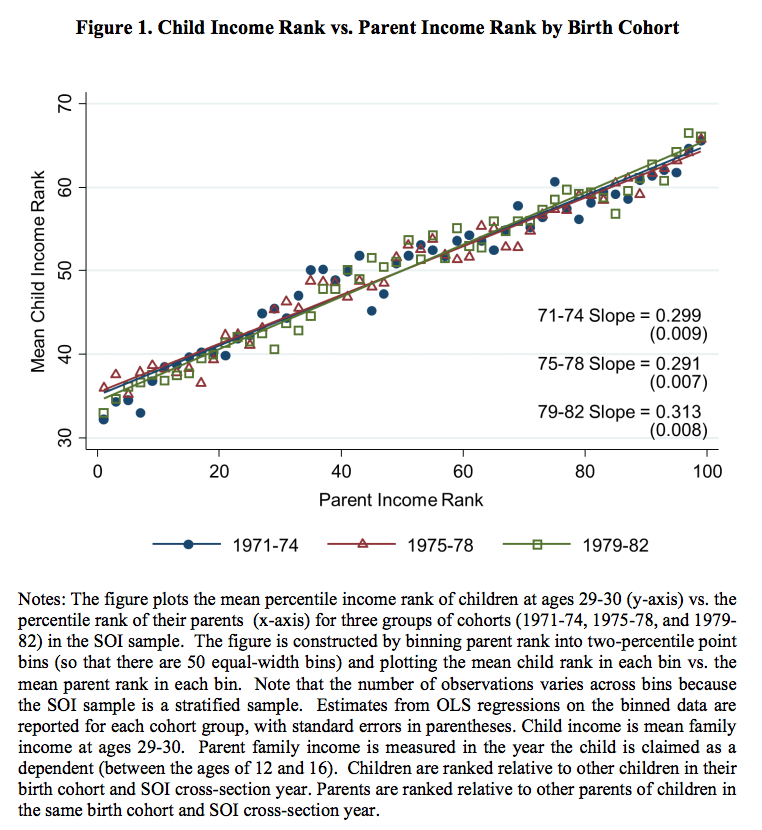
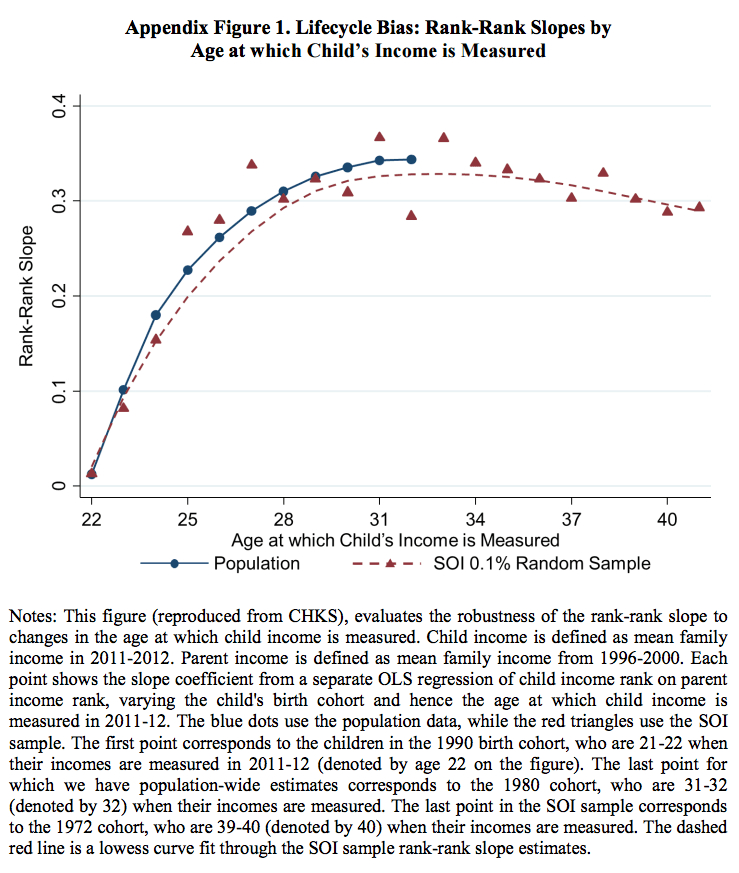
17: I’d have analyzed the income mobility directly in this analysis, but the correlations aren’t nearly as strong as SES (about 0.15 with the categorical parental income measure and continuous child earnings in 2011). This is largely to be expected from other studies. It is worth pointing out that the earnings measure is about what we’d expect if we can rely on Chetty et al. rank-rank income data by age.
18: Income and education are quite well linked.
This is particularly true at a community level (data taken from PA school districts/ACS analysis)

Or, if we look at individual 2011 (“adult”) SES….


[Translation: It ought not to be surprising that the offspring of high income or high SES grownups are more capable on average than low income/SES]
19: Large racial/ethnic differences in economic mobility have been documented elsewhere
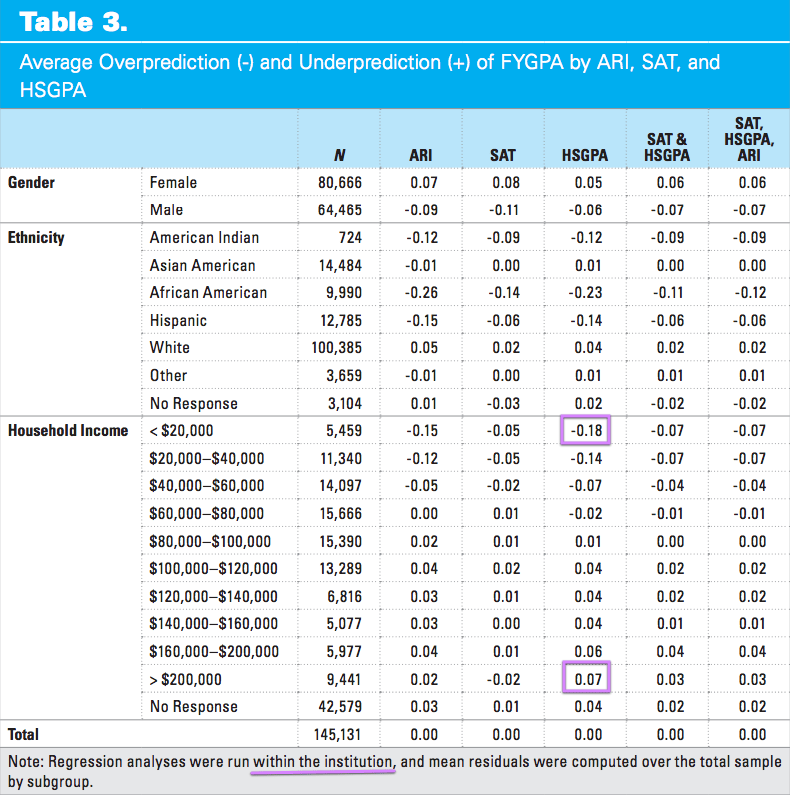
20: With respect to my incorporating parental education into one of the linear models (in addition to test scores and HS GPA), it is pretty well established that grading standards vary systematically by SES due to differing grading standards and differing levels of curriculum intensity.
For instance, the college board (the creators of the SAT) found that the HS GPA over/under prediction delta between the lowest and highest income groups within the same universities is equal to about 0.25 GPA in college (the difference in the broader population, including majority of the bottom income groups that don’t make it to college, is apt to be larger still).
Extra Information & Plots


Okay perhaps I have posted too many questions here. I was thinking of posting some more, but I did not want to spam you with questions. So here’s the one question that I want you to answer above all else. What is the level of income inequality within each race? We hear about this issue quite often, and we are told that the increase levels are a problem. I am curious about 1) within race inequality and 2) the extent to which increased diversity has contributed to more overall inequality. It would be quite interesting if you found that within race inequality is very similar to European levels.