I am going to share a little analysis I’ve done by combining Pennsylvania’s PSSA test scores, Census ACS data, and Department of Education statistics to refute a few popular progressive notions about education, namely, that:
1: The SAT/ACT only “measures family income”:

2: This is somehow being caused by more and better test prep efforts amongst the more affluent.
3: Higher income school districts are actually better because they spend more money.
***
Income metrics are well correlated with family education
This shouldn’t be surprising, but median family income and related income/economic measures are well correlated with parental education levels. This is particularly true when we aggregate them at a school district level.
To simplify this analysis and sidestep potential arguments about racial inequalities (e.g., school funding, teacher quality, etc) throughout this post I am going focus entirely on non-hispanic whites (“NHW”) except for tests where data by race/ethnicity is not available.

Aggregation tends to hide meaningful variance


As you can see, as we aggregate this same data together the relationship between median family income and average parental education statistics at the school district level, the relationships become very strong and appear to be practically linear. No doubt I could make similarly misleading statements about the strength of the correlation between these highly aggregated statistics, like Catherine Rampell did for the SAT aggregates: “R2 for each test average/income range chart is about 0.95“. Nevertheless, we can clearly see that neighborhoods with high family incomes tend to similarly above the national averages by family education levels and vice versa for low income districts.
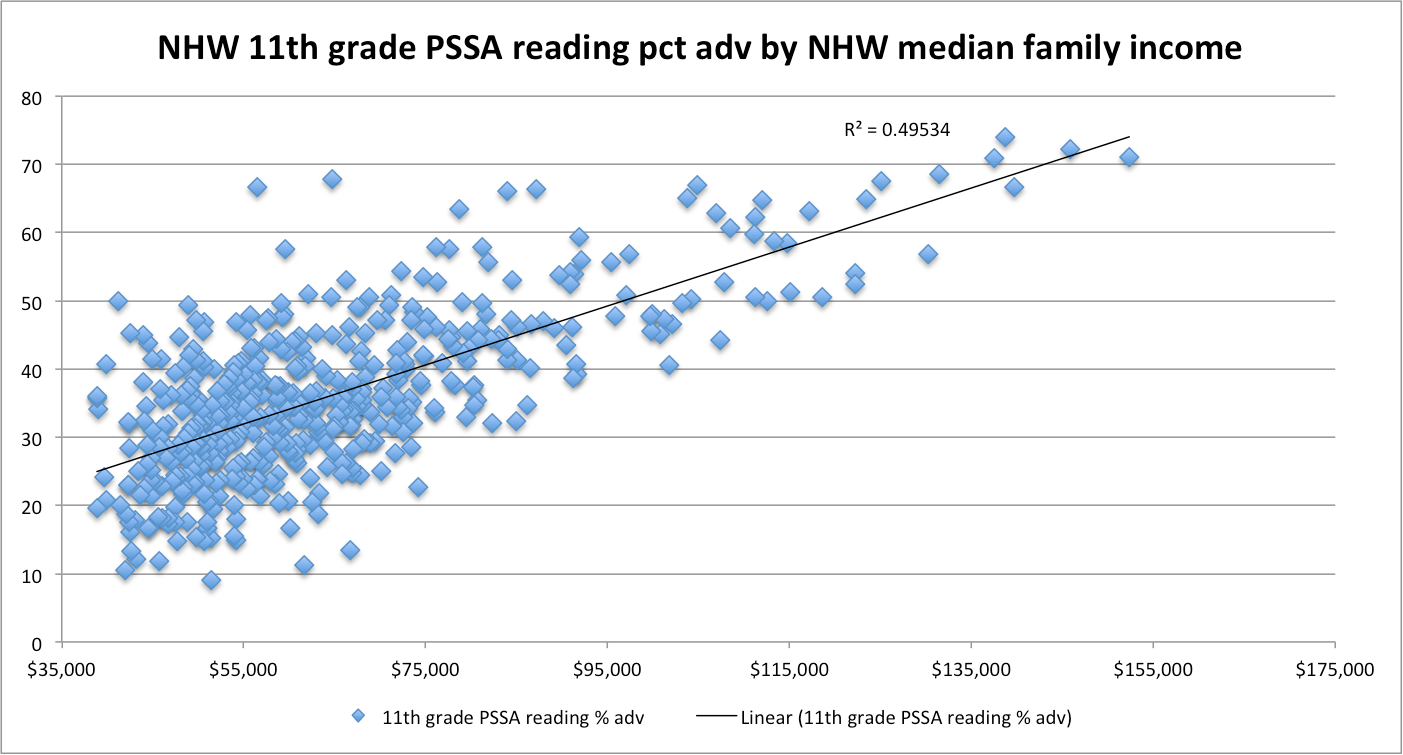
The same goes for test score aggregation


“r**2=0.96!!!!”
So, presumably, PSSA tests just measure family income too, right? 🙂

Using this rationale, median family income just measures how well educated the families are too!
Clearly this is all nonsense. These statistics are obviously fairly well correlated, but when you aggregate on one dimension (e.g., income) the other sources of variance (e.g., random chance, regional economic drags, etc) tend to get averaged out, which invites an exaggerated impression of the strength of the underlying relationships.
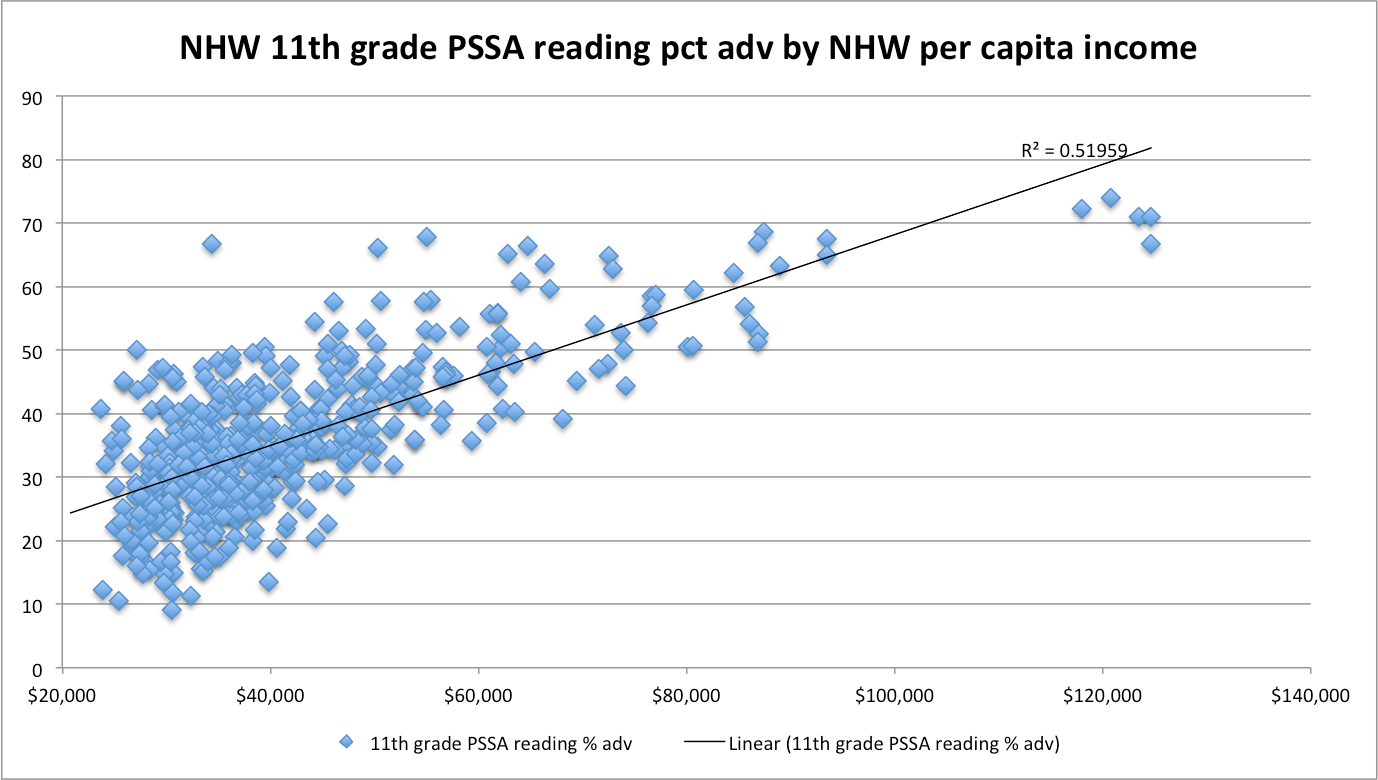
Family education is a much better predictor than family economics

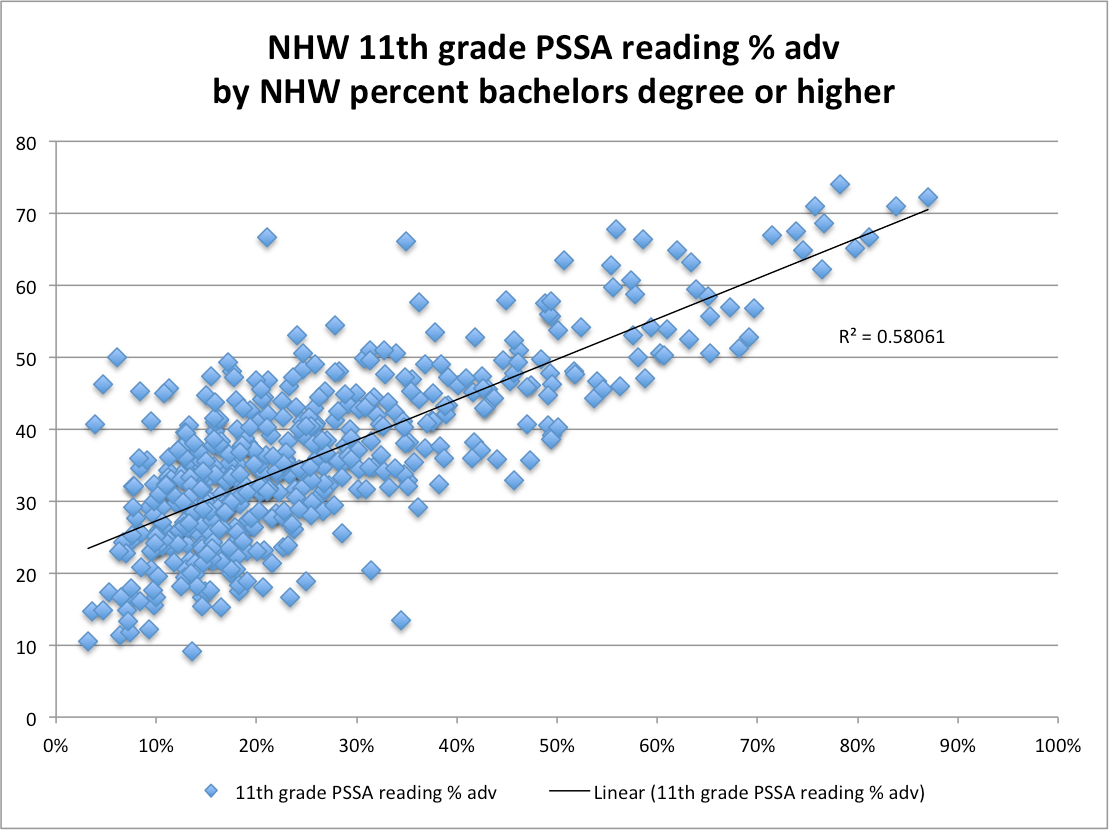
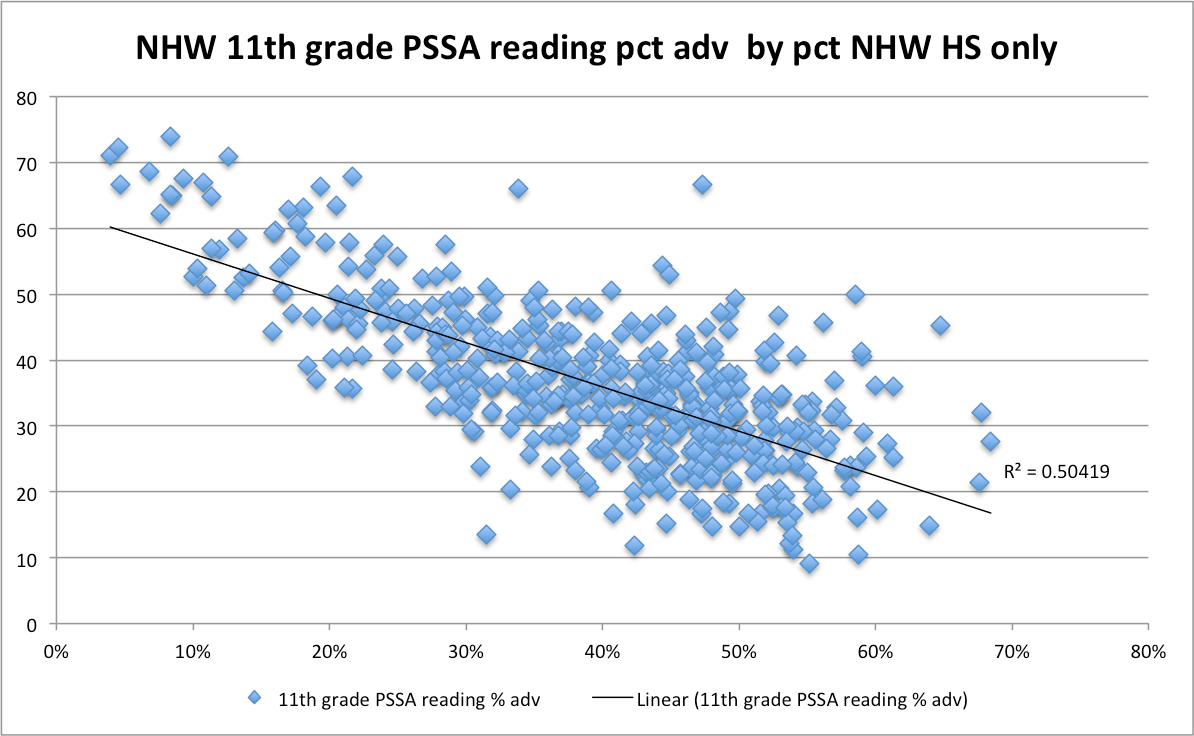
[Note: HS only excludes the less than HS category — it’d be significantly stronger with both]
The strength of these economic-outcome correlations varies according to how well correlated they are with family education levels.

Very little incremental power with economic measures
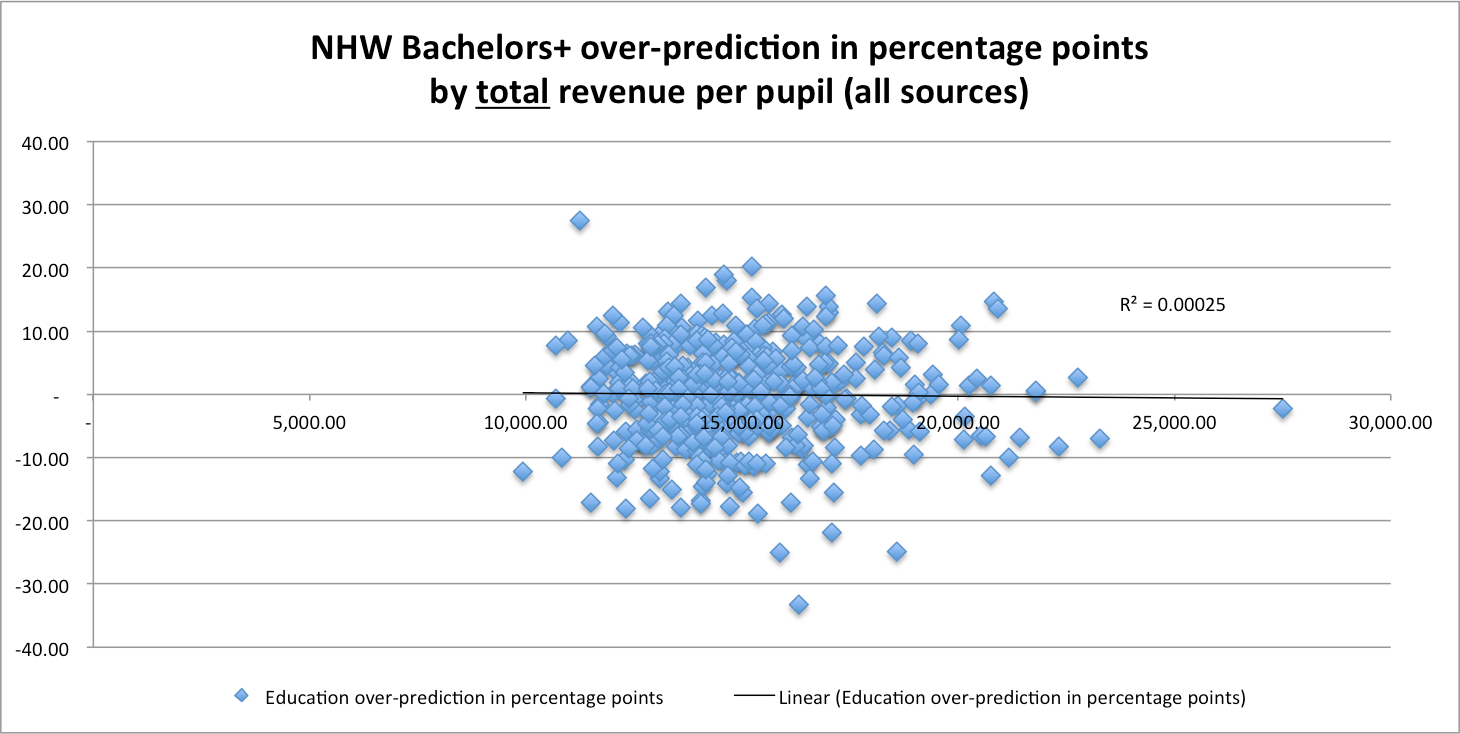
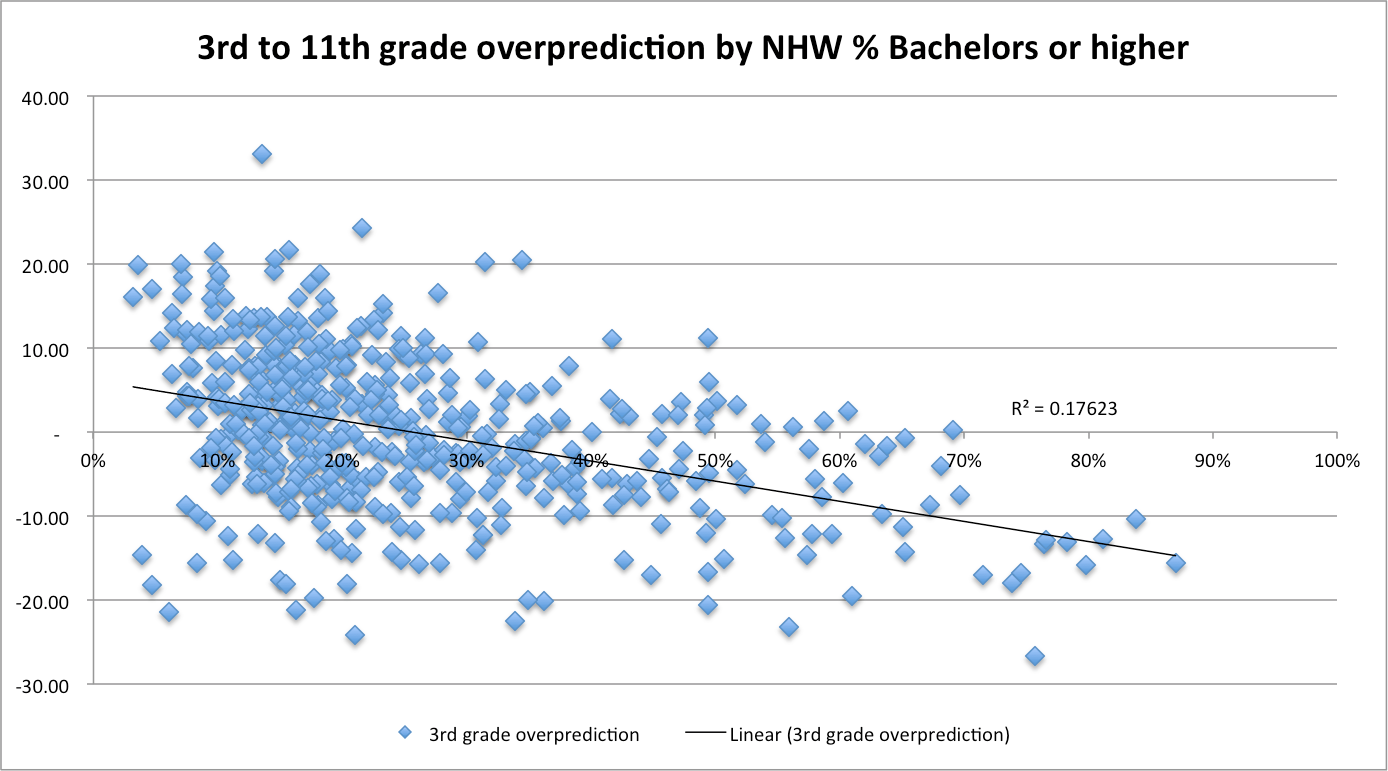
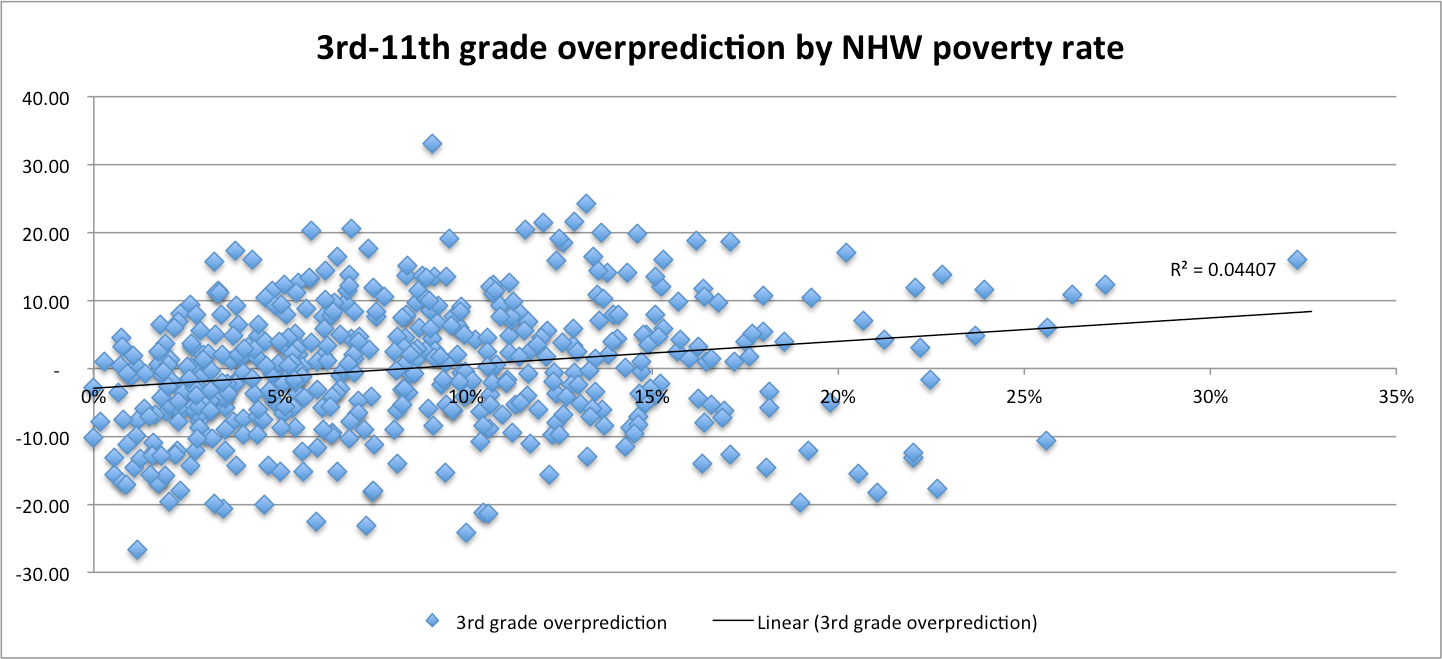
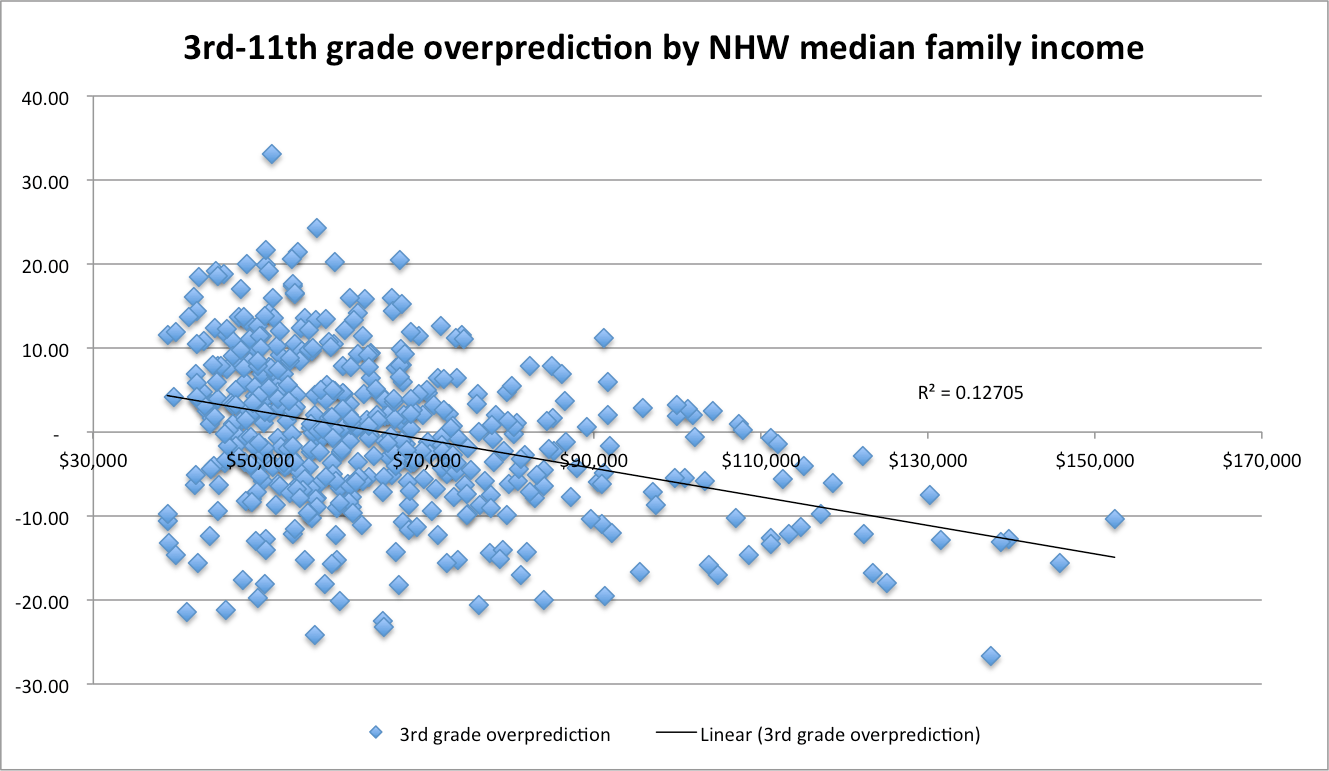
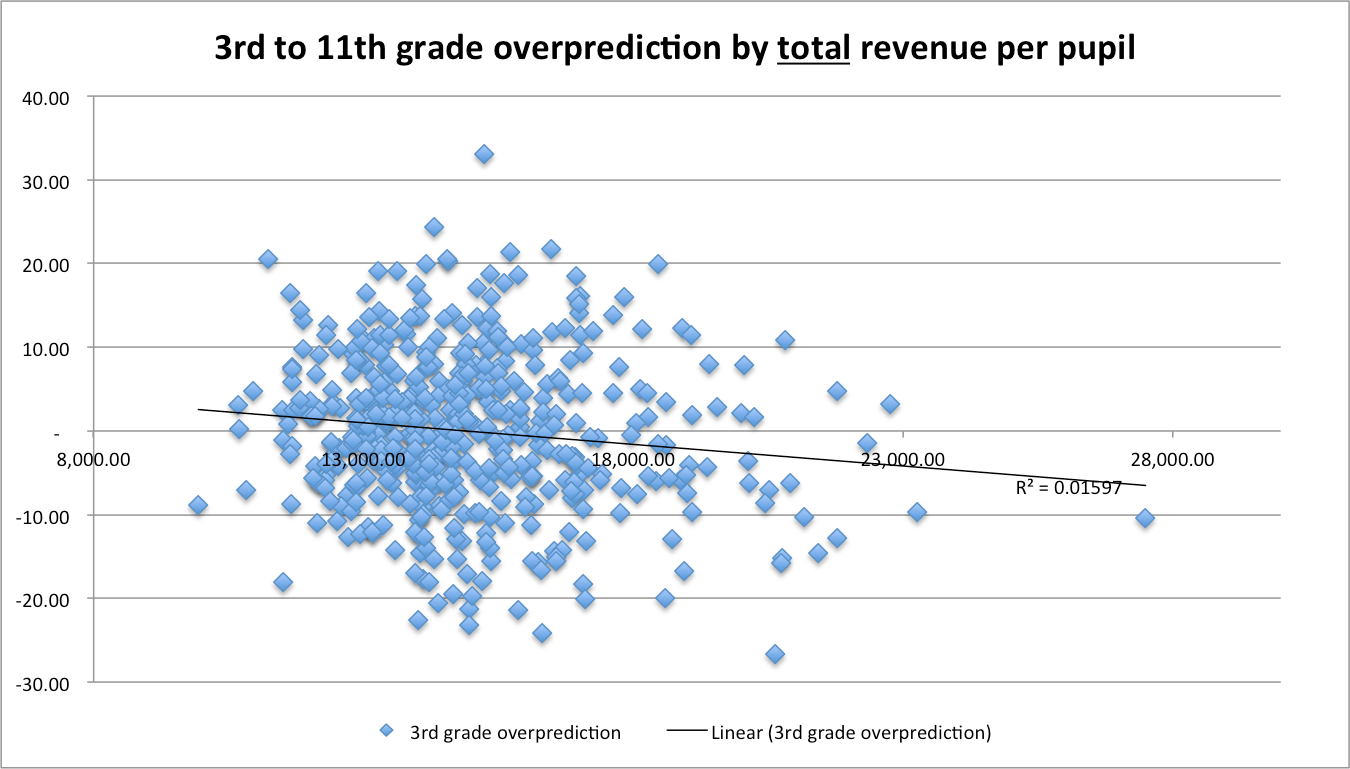
Below is a comparison of the over-prediction for non-hispanic white 11th grade reading scores (“% advanced”) based on the percentage of NHW school district families with bachelors degrees or higher, expressed in percentage points, by family economic measures. Negative values imply that the school district performed better than expected (under-prediction) based on % of NHW families with bachelors or higher alone; positive values imply over-prediction.


As you can see, there is some variance from the prediction, but there is little to no evidence for systematic variation with family economic measures of this sort (or, at least not above and beyond that which correlates with family education levels).
I suspect I could tighten the education model up better by adjusting this further for districts that have larger or smaller shares of less educated groups (<HS, HS-only, associate-degrees) than would be expected by the BS+ percentage alone, especially in more heterogeneous districts.
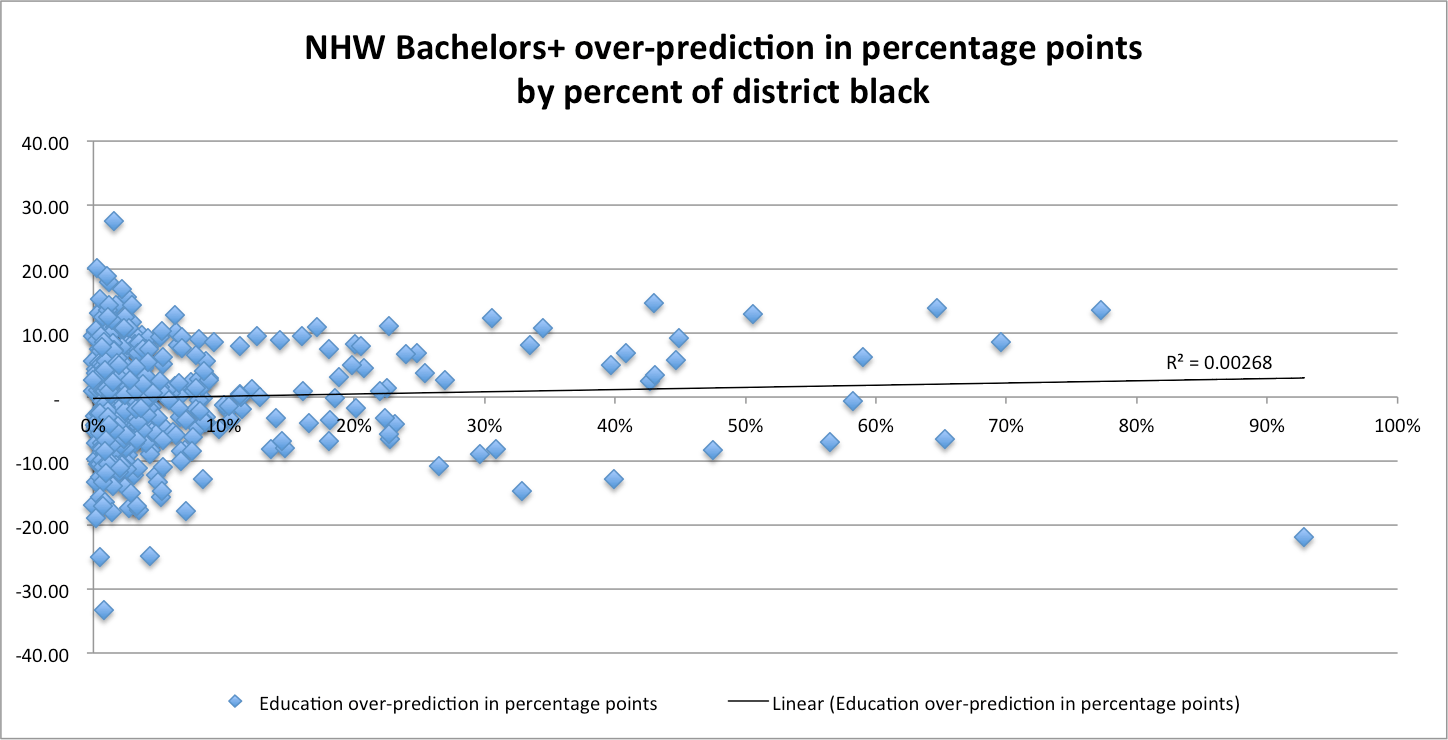
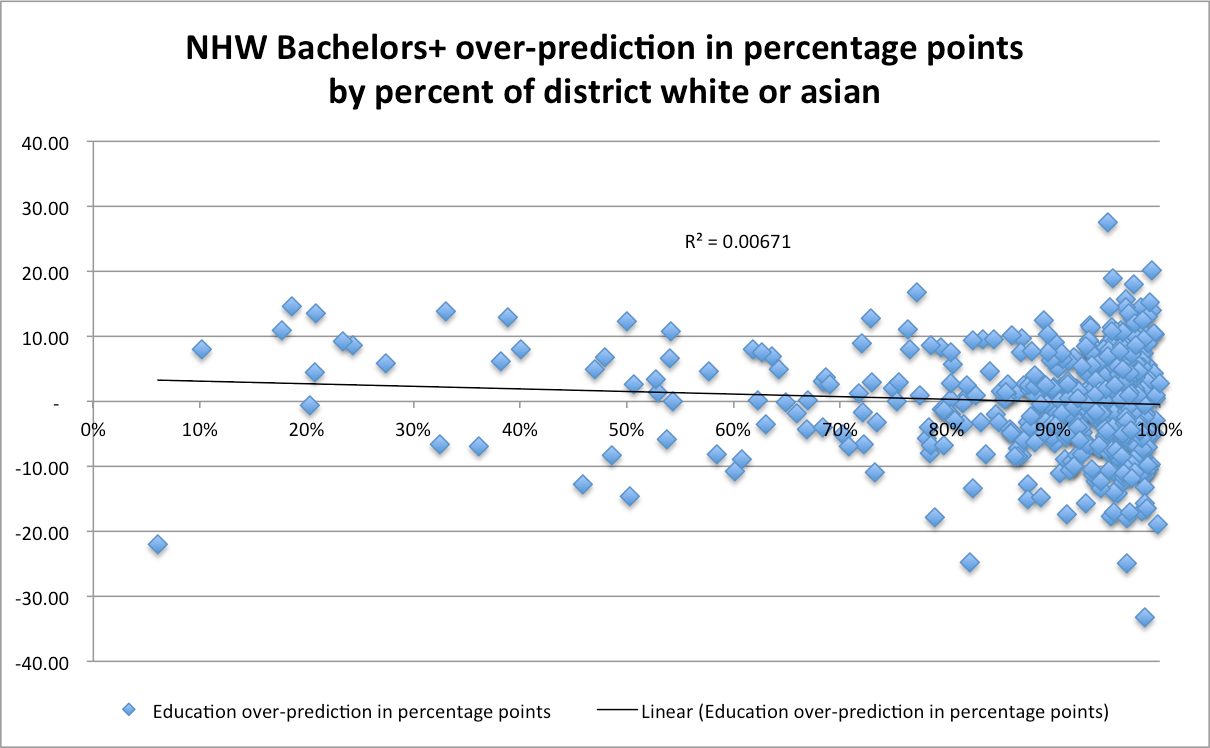
School district inputs and (other) demographics are hardly positively correlated (as presumed)
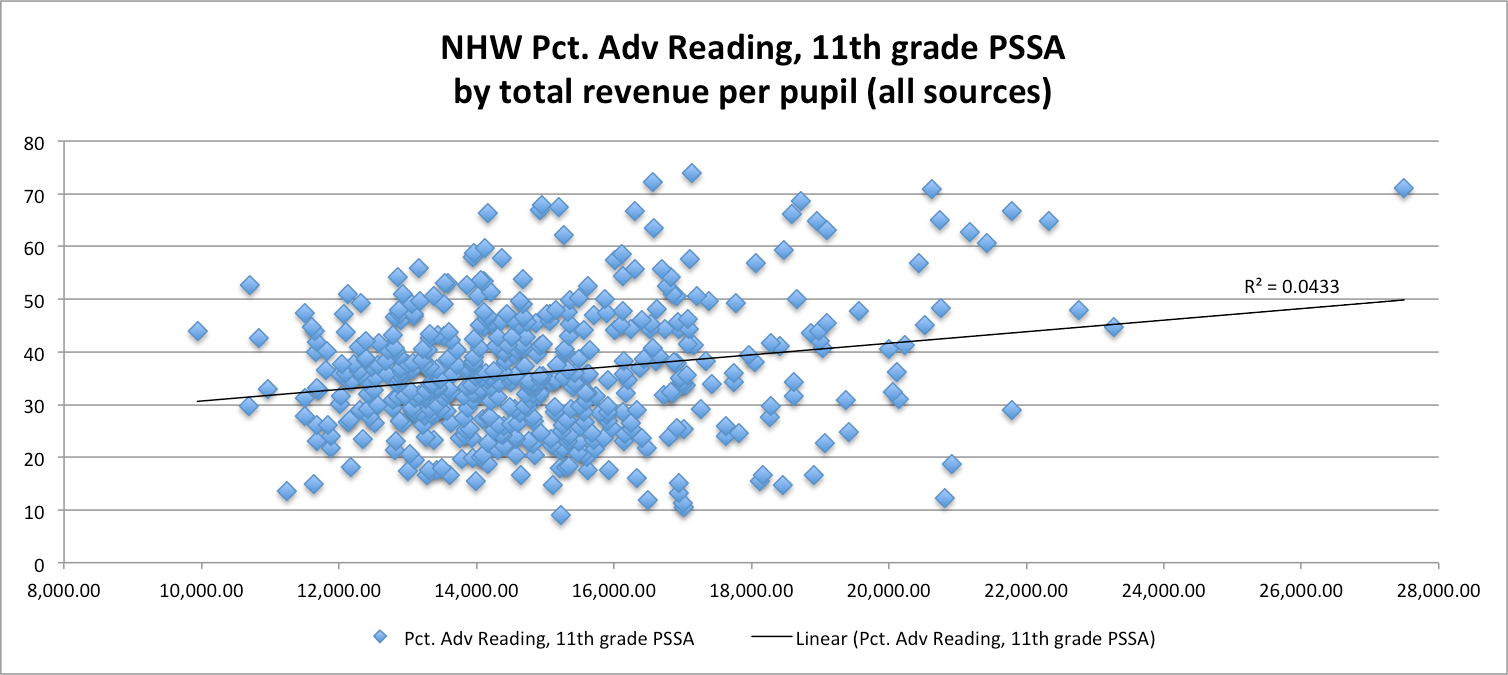
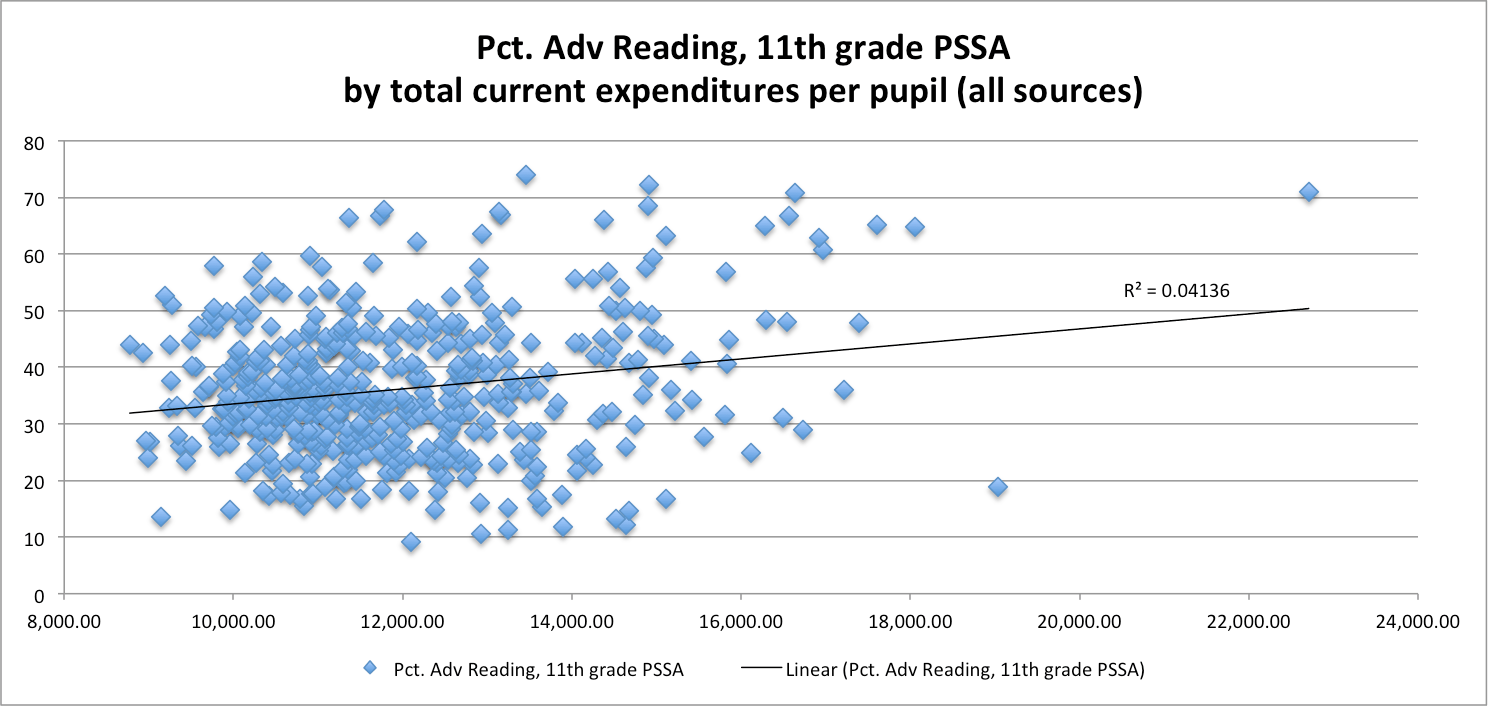
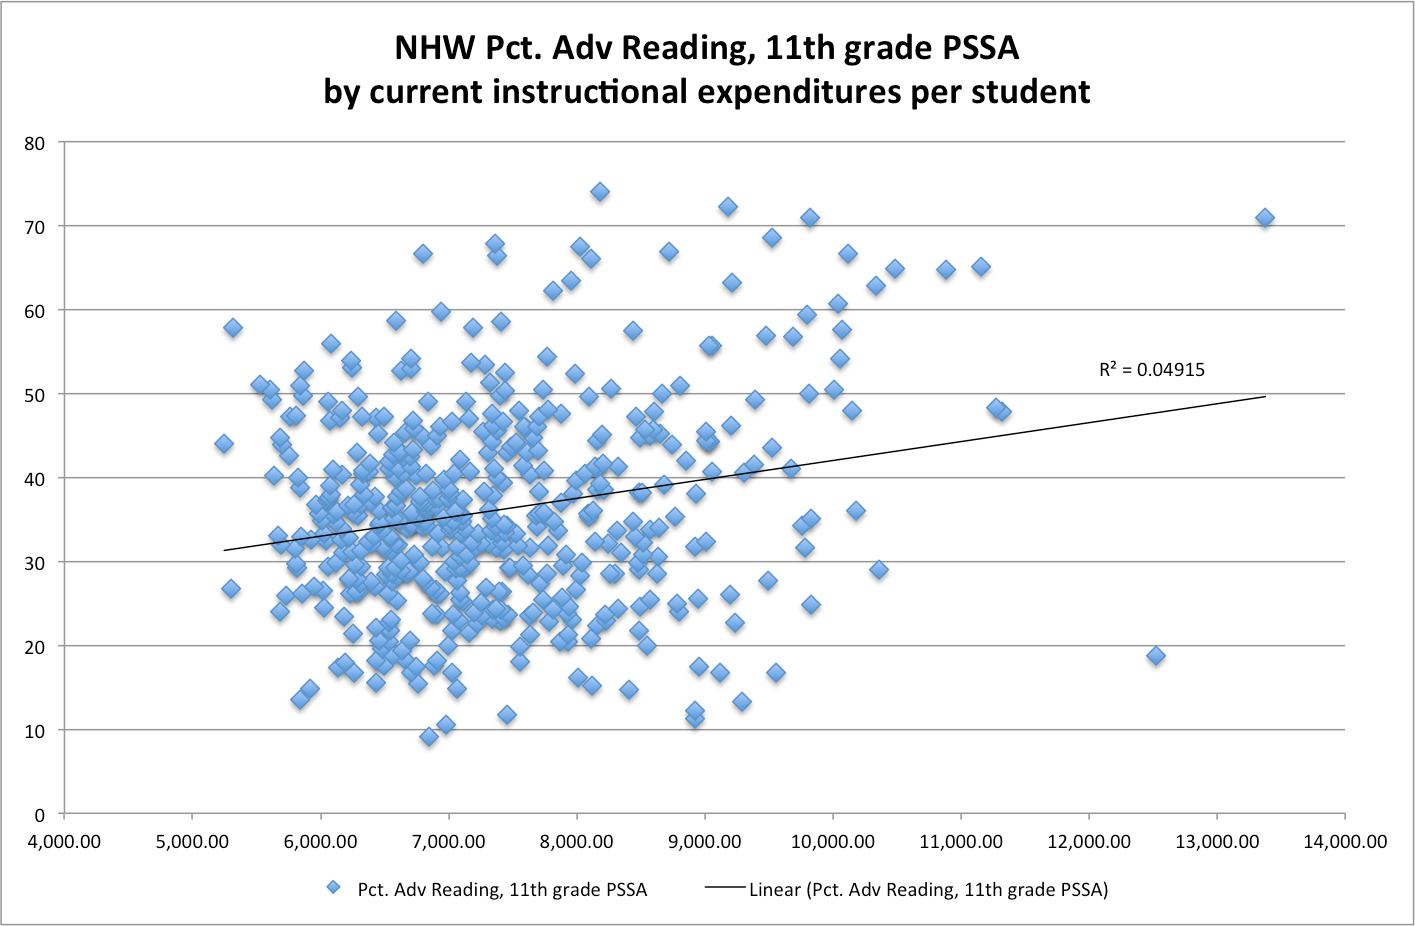
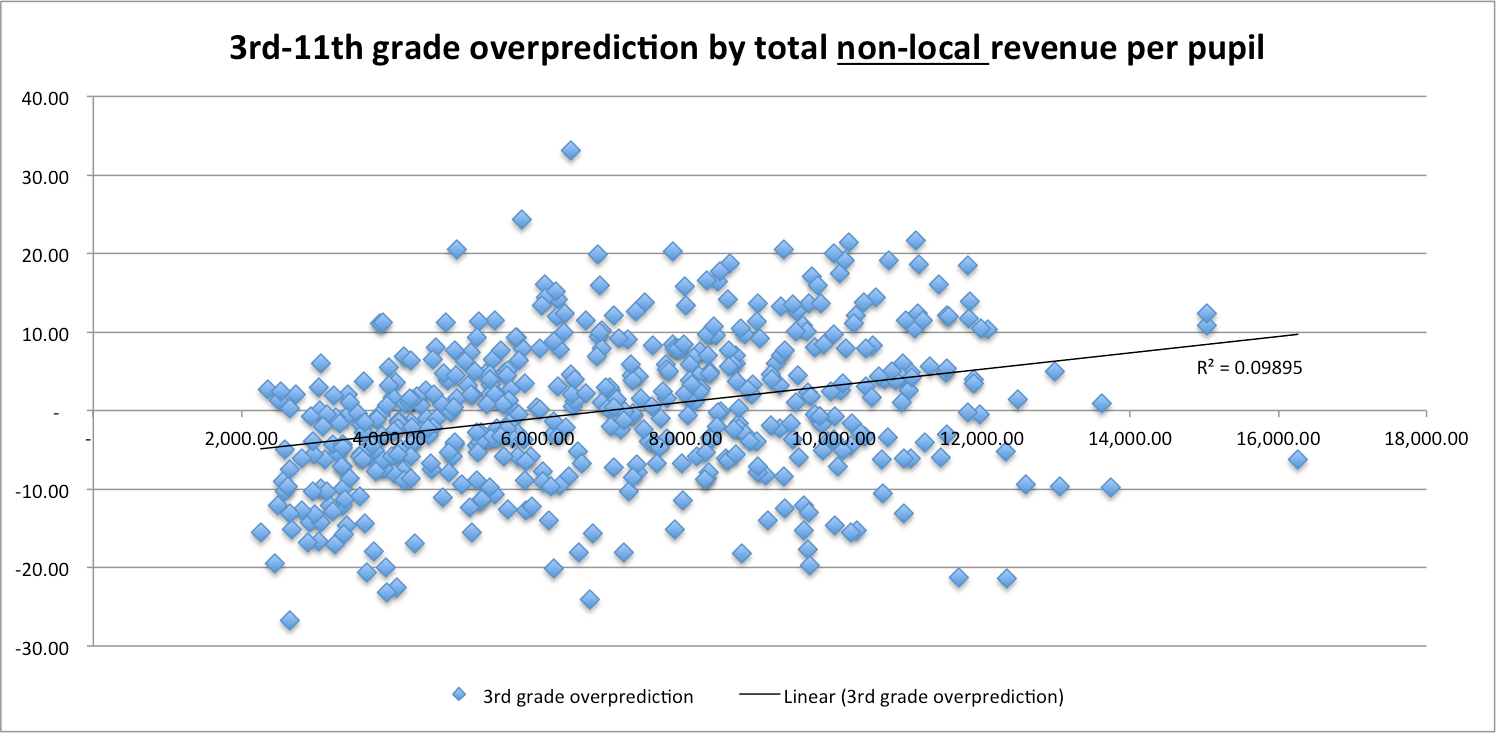
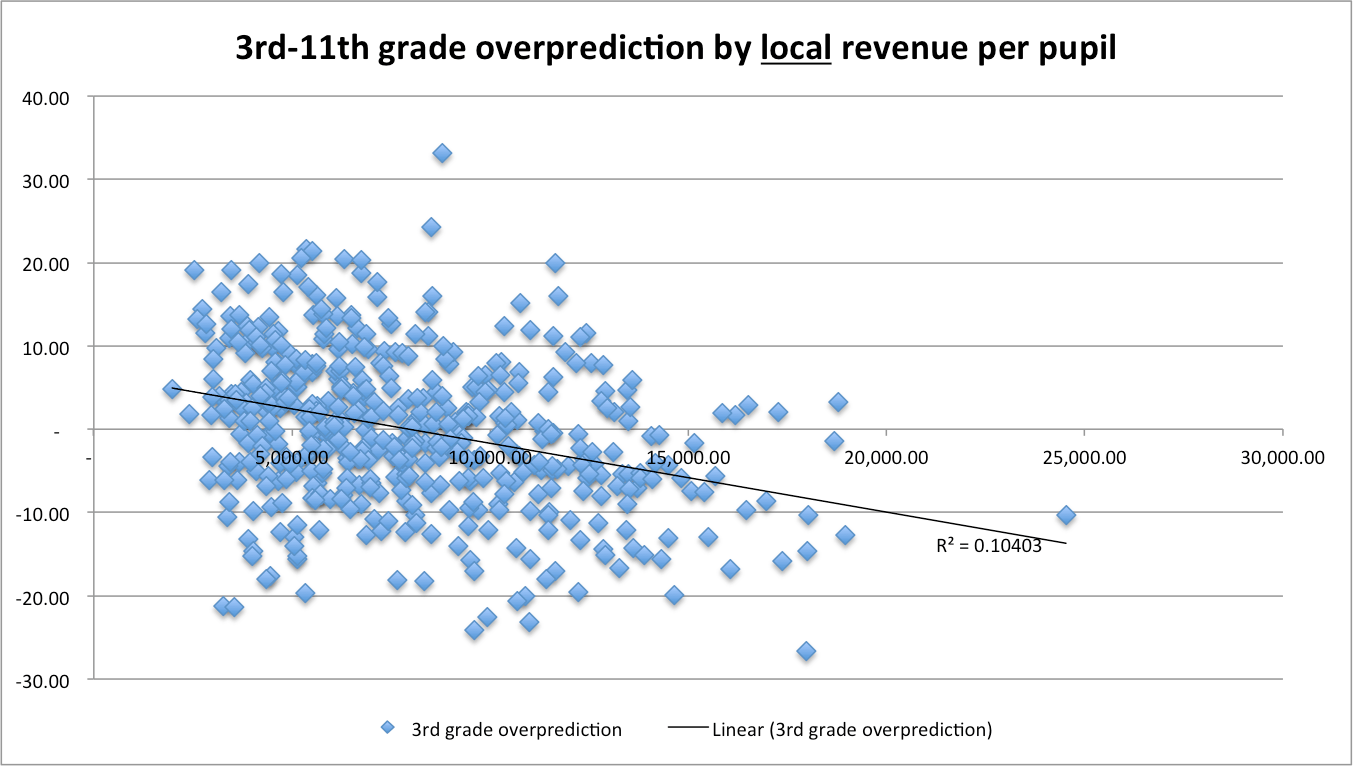
The above stats are weakly correlated, but let’s see what happens when we account for local vs non-local spending:

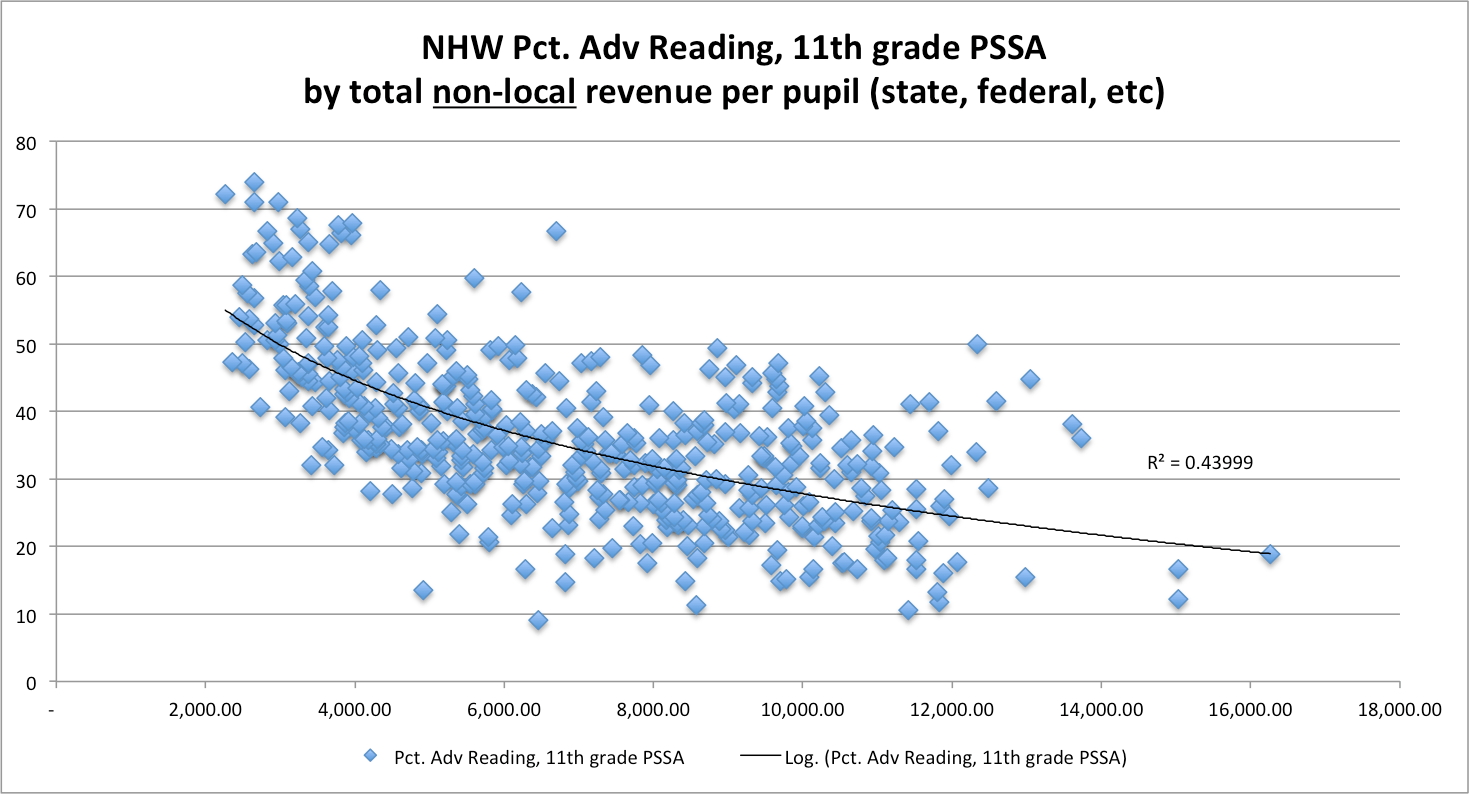
The correlations are much stronger here. Both tell us something about the parents socio-economic status and (arguably) their priorities, but they move in very different directions. Gee, I wonder why? 🙂
Note: both of these measures move in an “unexpected” direction.

Now lets try it with some rudimentary controls
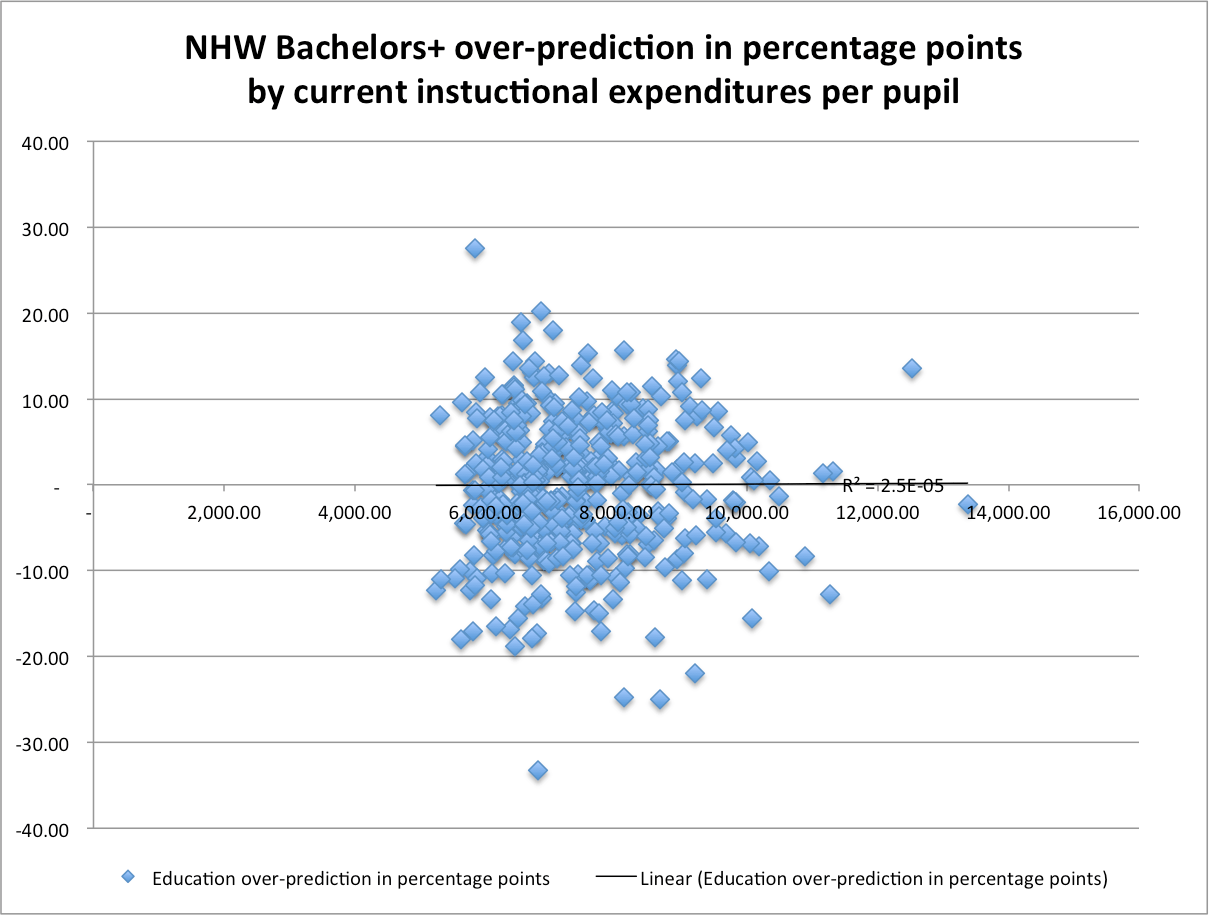
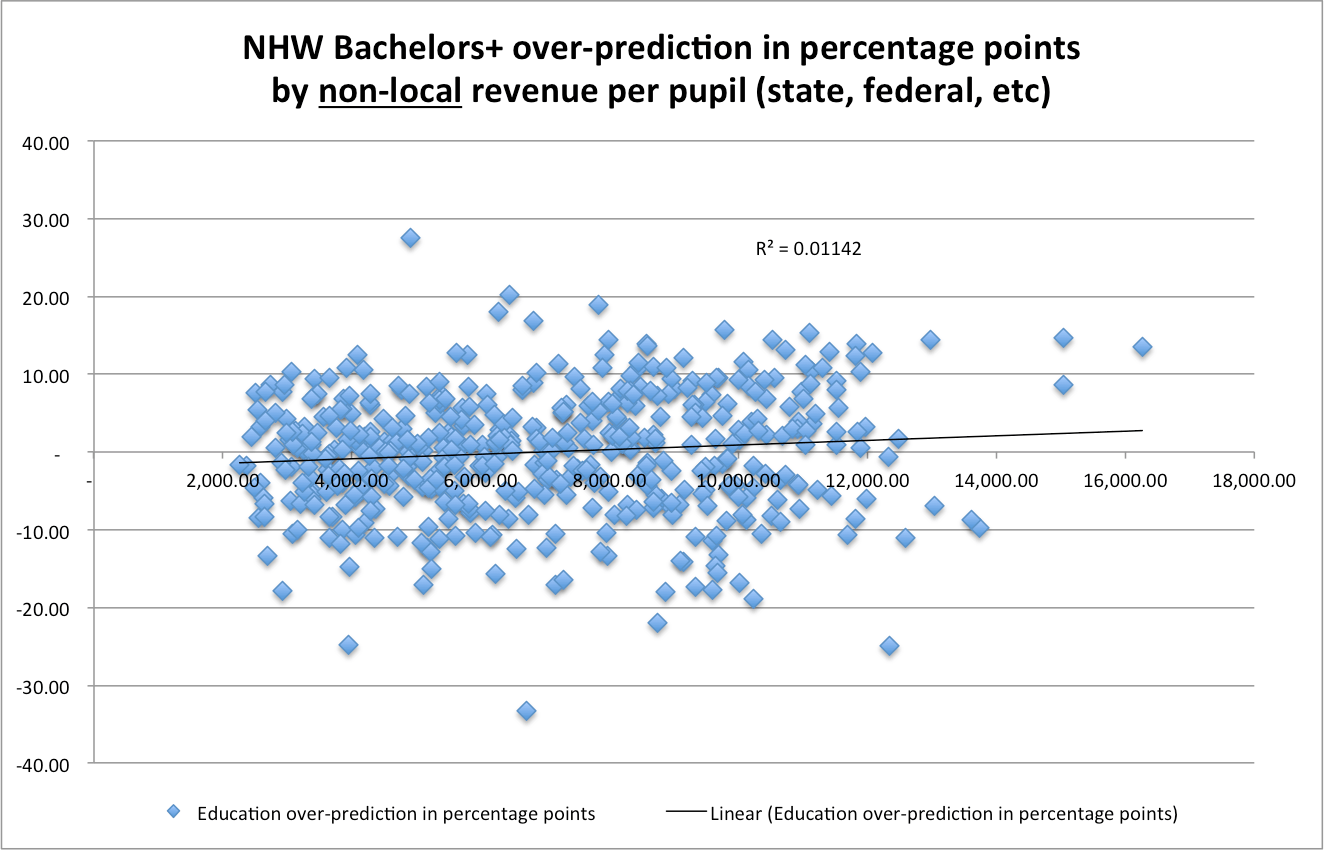
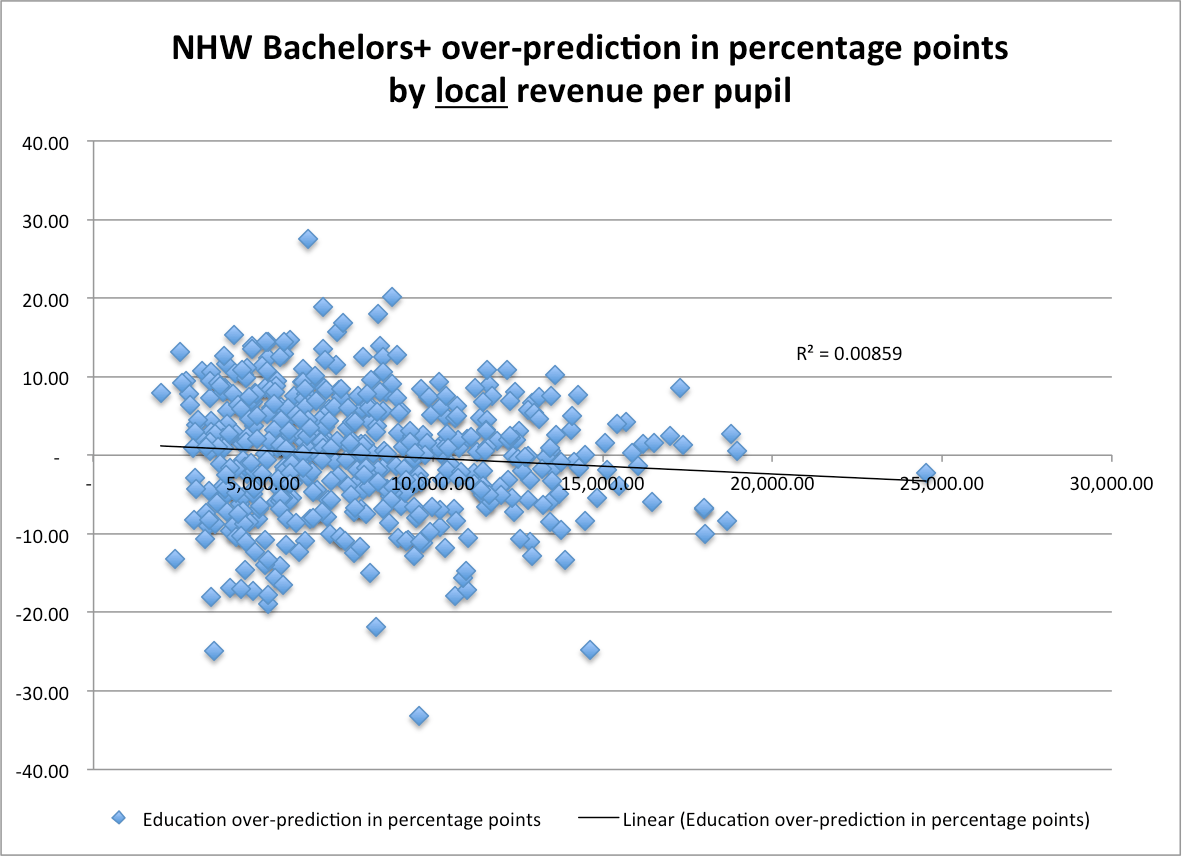
So total is uncorrelated, local is negatively correlated (i.e., more $ = under-prediction), and non-local spending is positively correlated (i.e., more $ = over-prediction). All of this is completely consistent with the notion that actual variances in school spending have virtually no incremental effect on these outcomes (at least), but that, to the extent that spending reflects incremental information about the parents (higher or lower SES than % college grads suggests), we can predict some subtle differences.
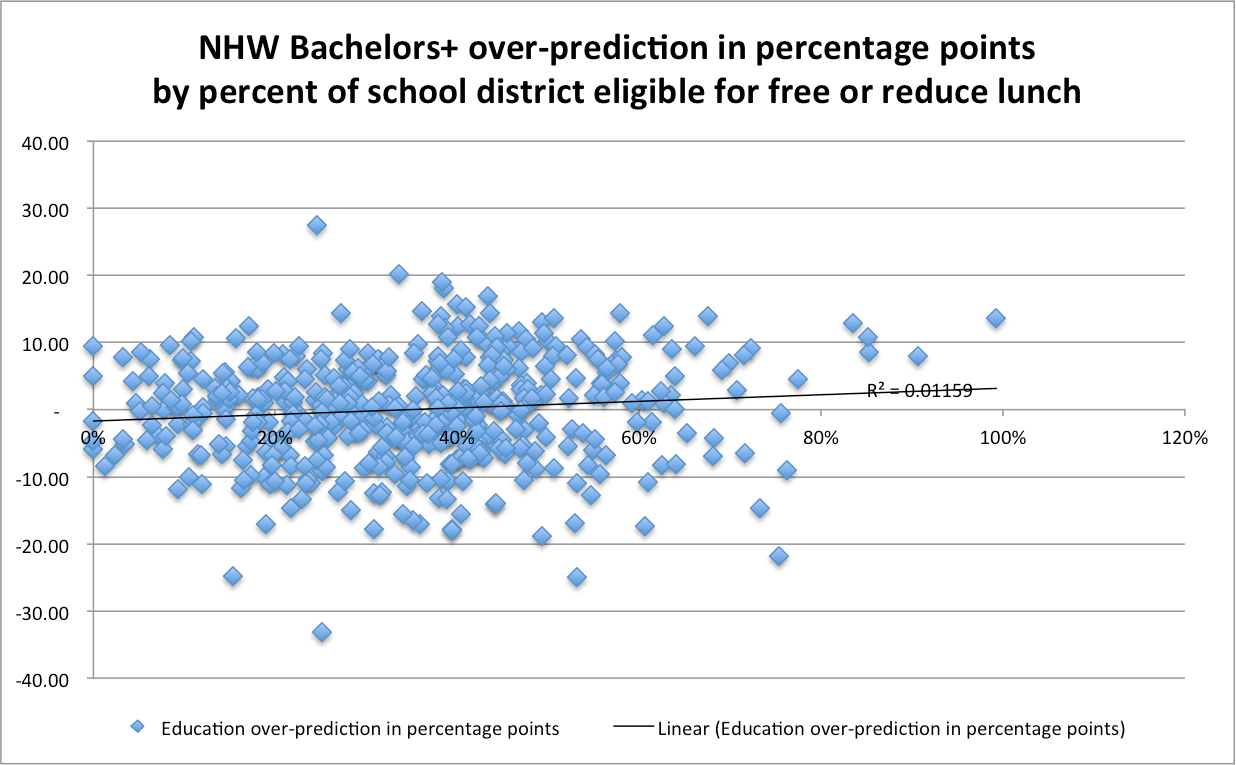
Likewise for a direct measures of average school district SES.
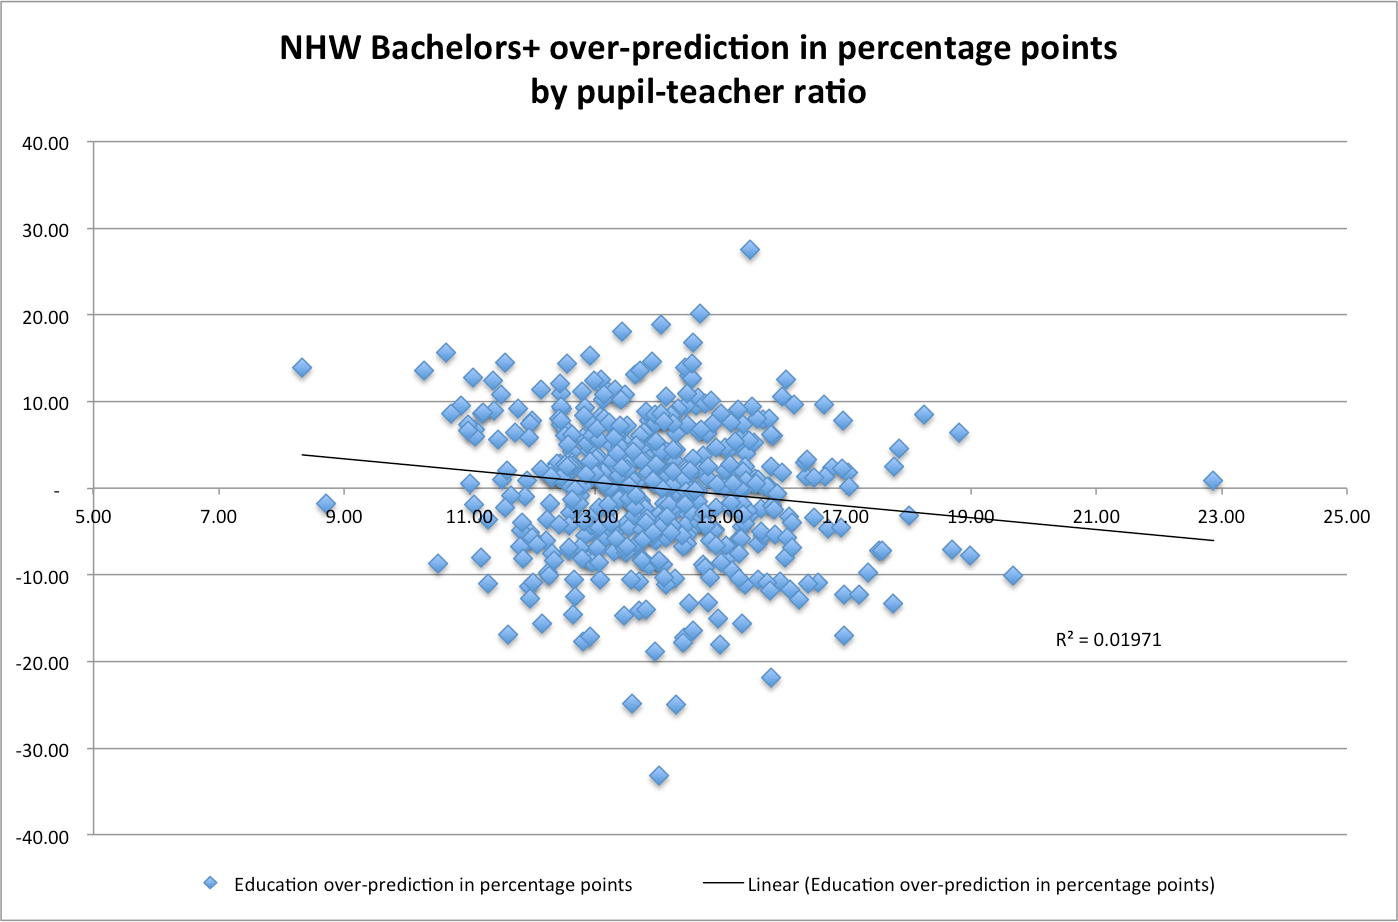
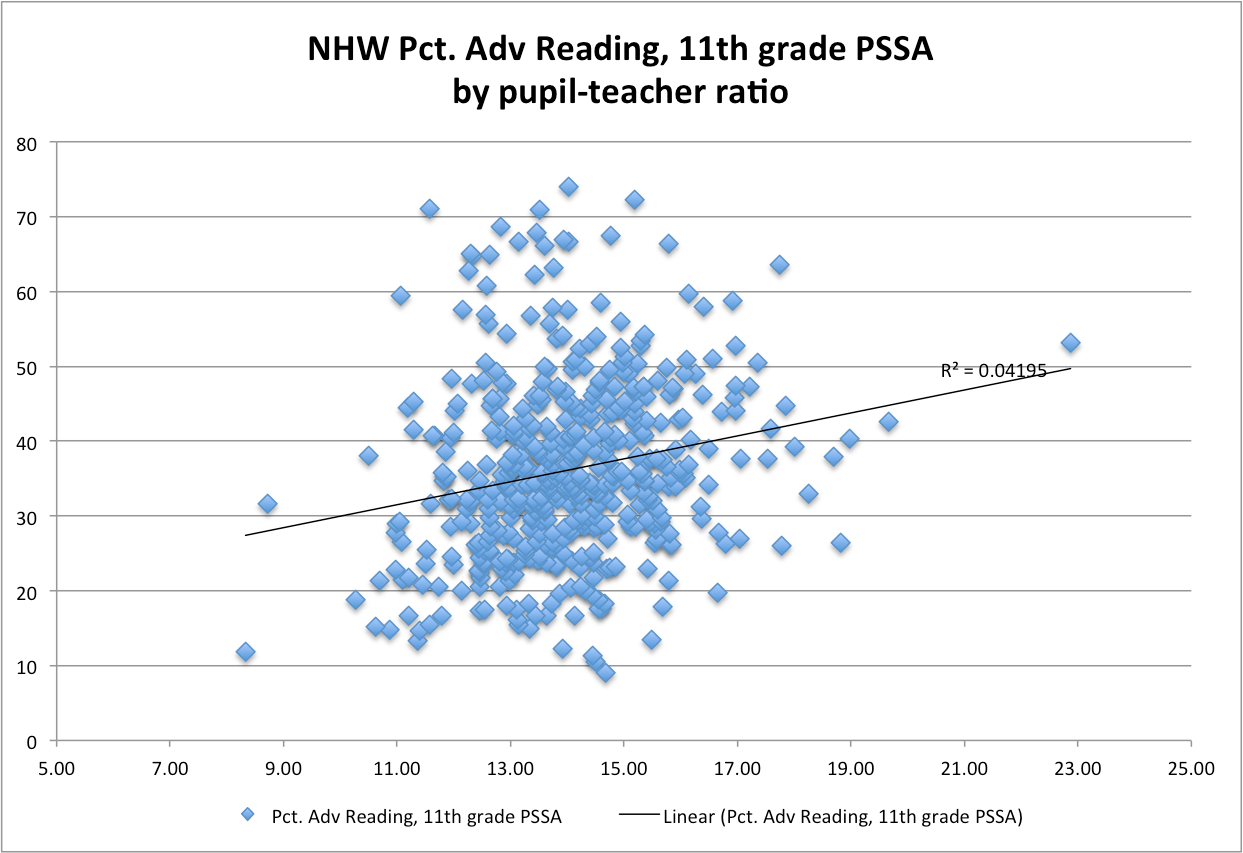
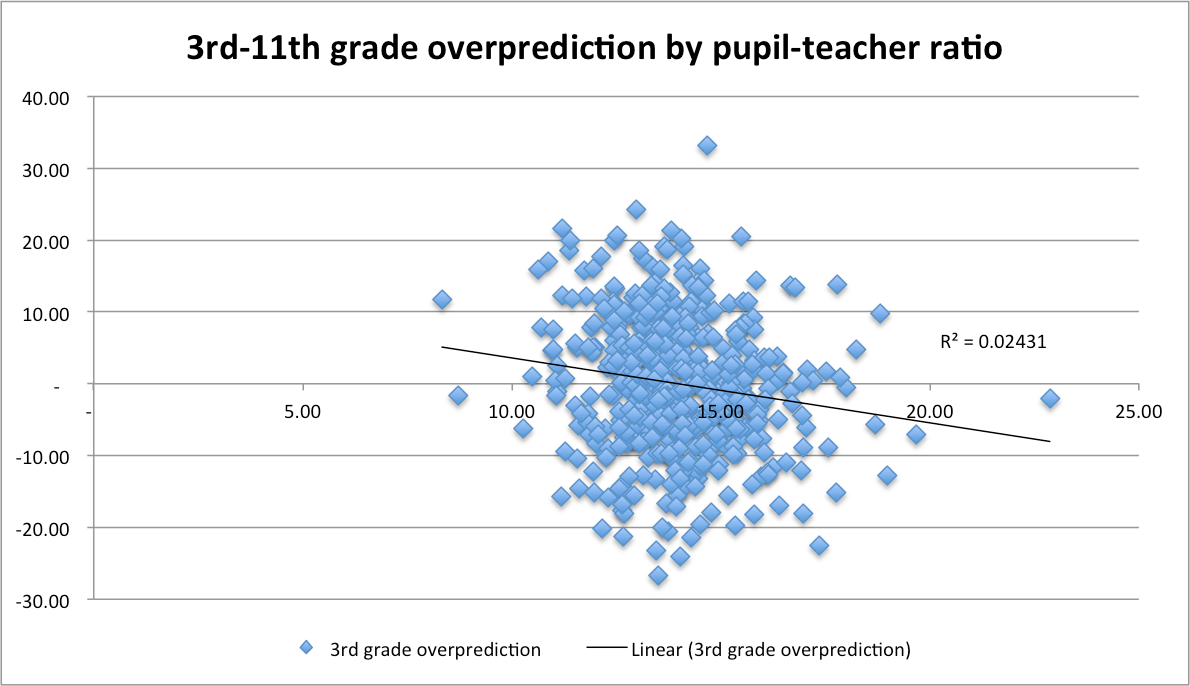
Districts with larger class sizes perform better than we’d expect
 These differences start early and early differences predict later outcomes

and these differences increase systematically
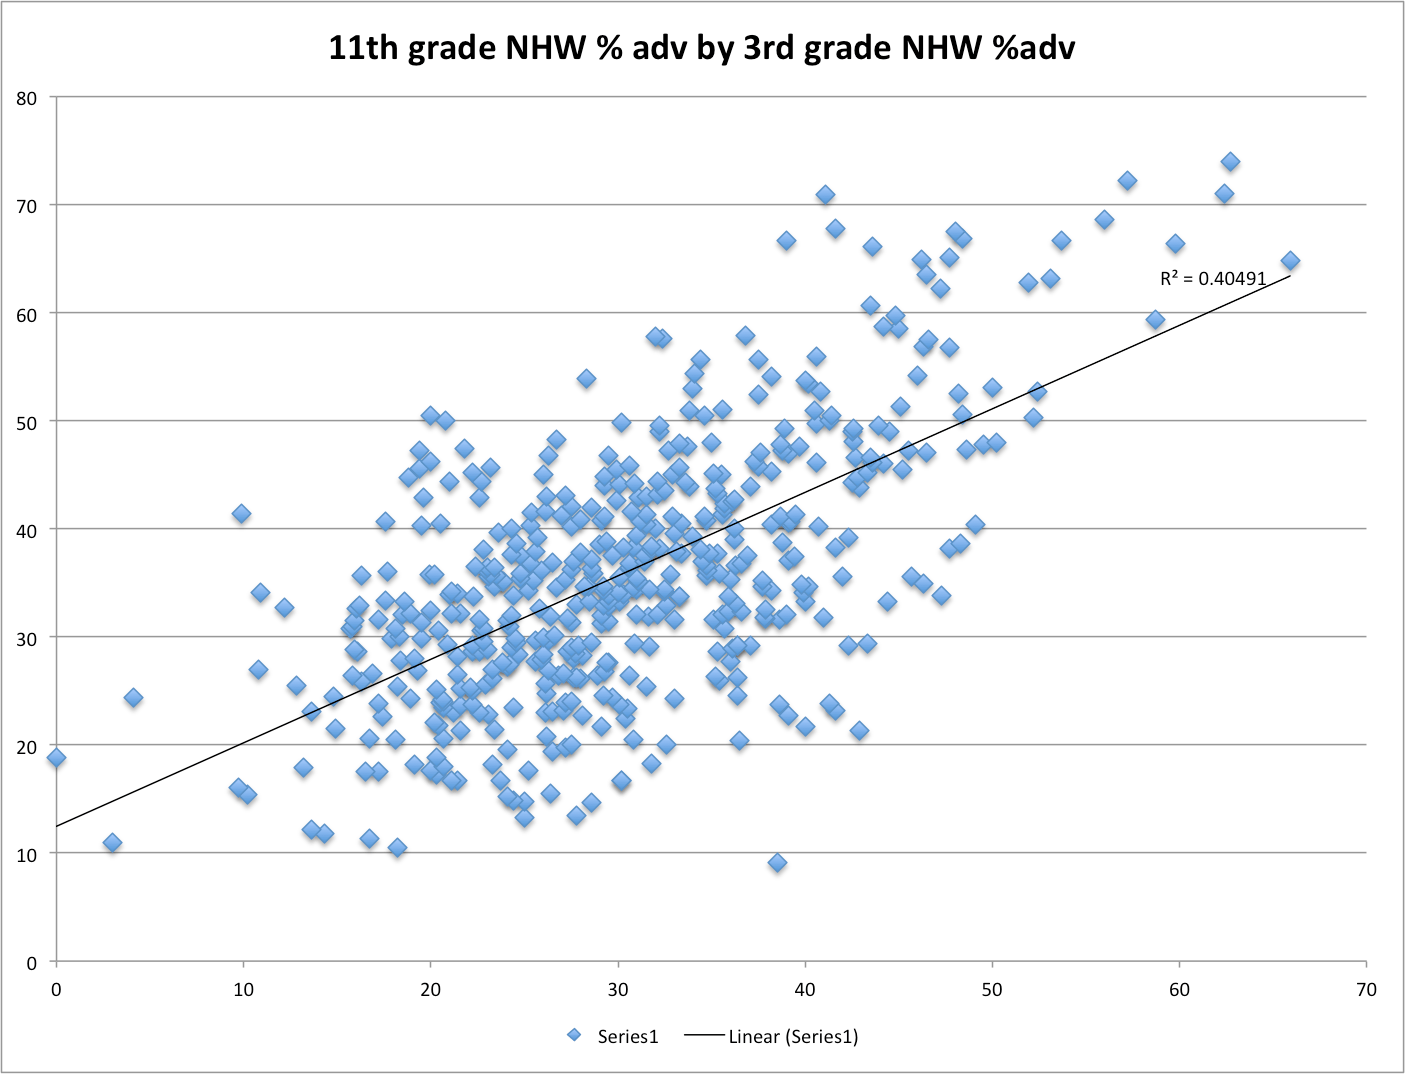
If we try to predict 11th grade NHW reading scores based exclusively on 3rd grade reading scores….
[Note: I’m not trying to track this by cohort here, but I think we can reasonably assume that the demographics in most districts don’t usually change that dramatically over the space of a few years]
Translation: NHW in districts where higher proportions of NHW parents are educated do significantly better than we’d predict (r=0.42)
Again, we find the same patterns with these other measures….
SAT scores are quite well correlated with 3rd grade test scores


Note: These correlations are significantly stronger than the 11th grade PSSA scores I reported above for non-hispanic whites,but that’s probably because this data is for all racial/ethnic groups (they don’t provide SAT data at this level of detail) and the variance with all groups is larger than within groups.
The relationship between SAT scores and 11th grade PSSA scores is very strong


Considering that year-over-year r**2 within high schools are less than 0.9 and that varying participation rates and weaken the relationship (weaker students are less likely to sit for the SAT, which will weaken the reported school level PSSA-SAT relationship)


Not mention the research report I cited earlier (with individual-level correlations)…


Note: The “effect sizes” of parental education are generally much higher than parental income.
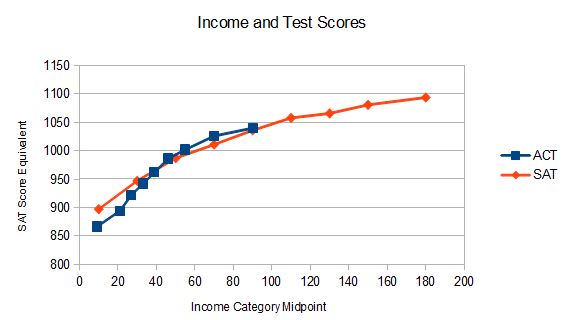
SAT by ACT comparison


The ACT and SAT are very similar
As Robert VerBruggen of Real Clear Policy pointed out, the relationships with ACT and income are practically the same.
He also pointed out that these trends are found on other tests in an earlier post
Reading

Math

The actual PSSA correlations are stronger than the cut-score percentages imply
Unfortunately PA rarely provides scale scores by subgroup and the cut-scores can create an exaggerated sense of variance each year (especially with small fluctuations in class profile). As you can see the year-over-year correlations by cut-scores aren’t super strong (some of this might also be the result of cheating!)


If we instead take 4 years worth of cut scores for NHW, convert them into SD units above/below mean, and take the average it tightens up considerably!


And the relative strength of the relationships don’t seem to change either….


