
A year or two ago I read an article which demonstrated that sex differences in math and reading achievement are inversely related within and across countries on the PISA tests. The smaller the male-female math gap, the larger the verbal gap and vice versa. This tends to support the view that there are innate underlying differences in average abilities and interests between the sexes that strongly influence these patterns.


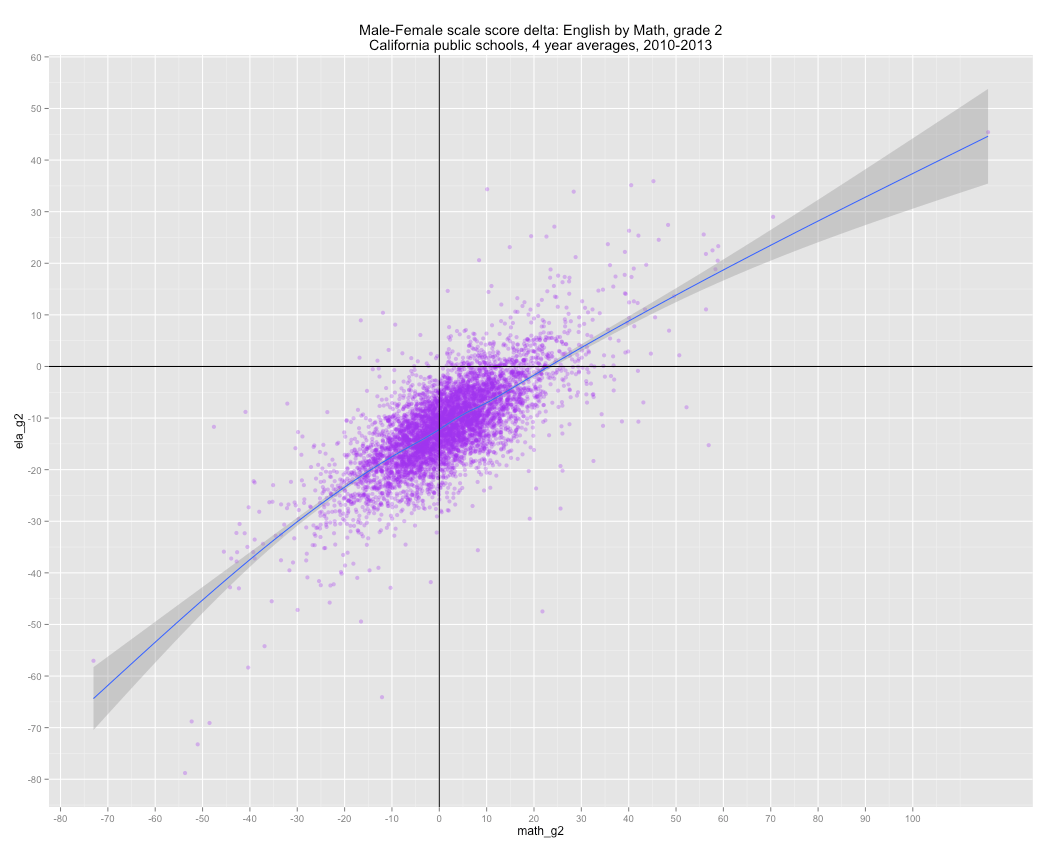
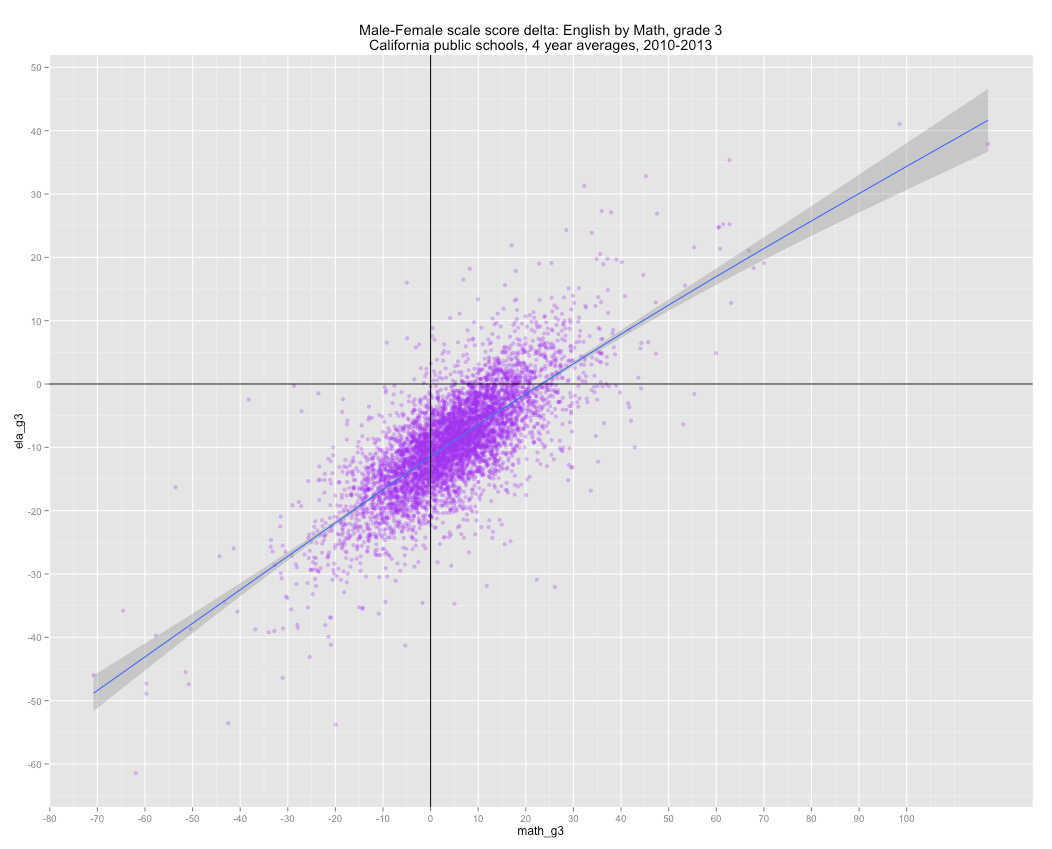
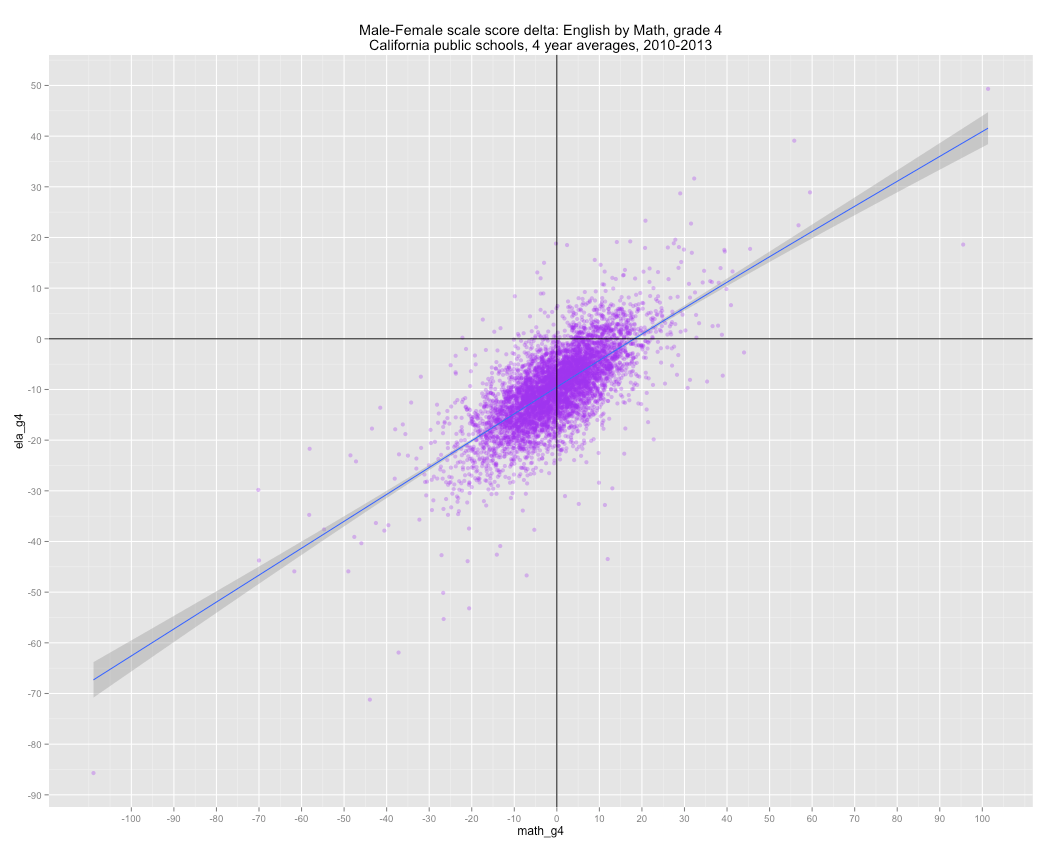
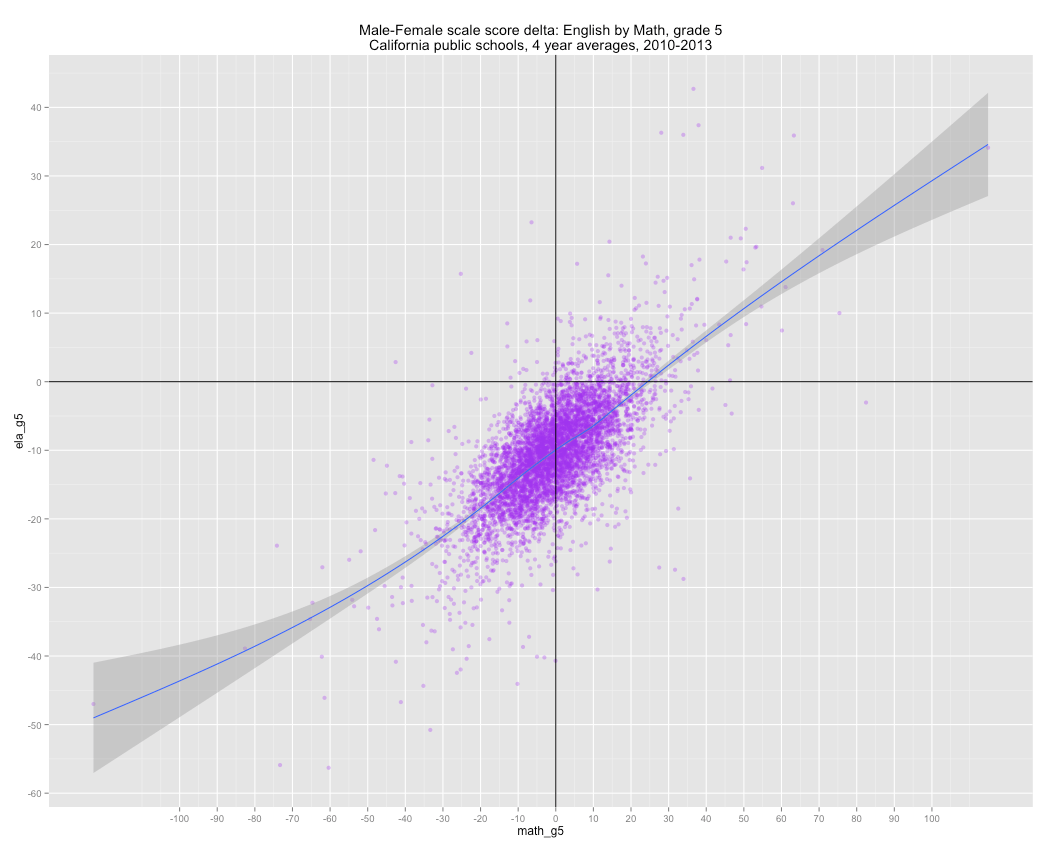
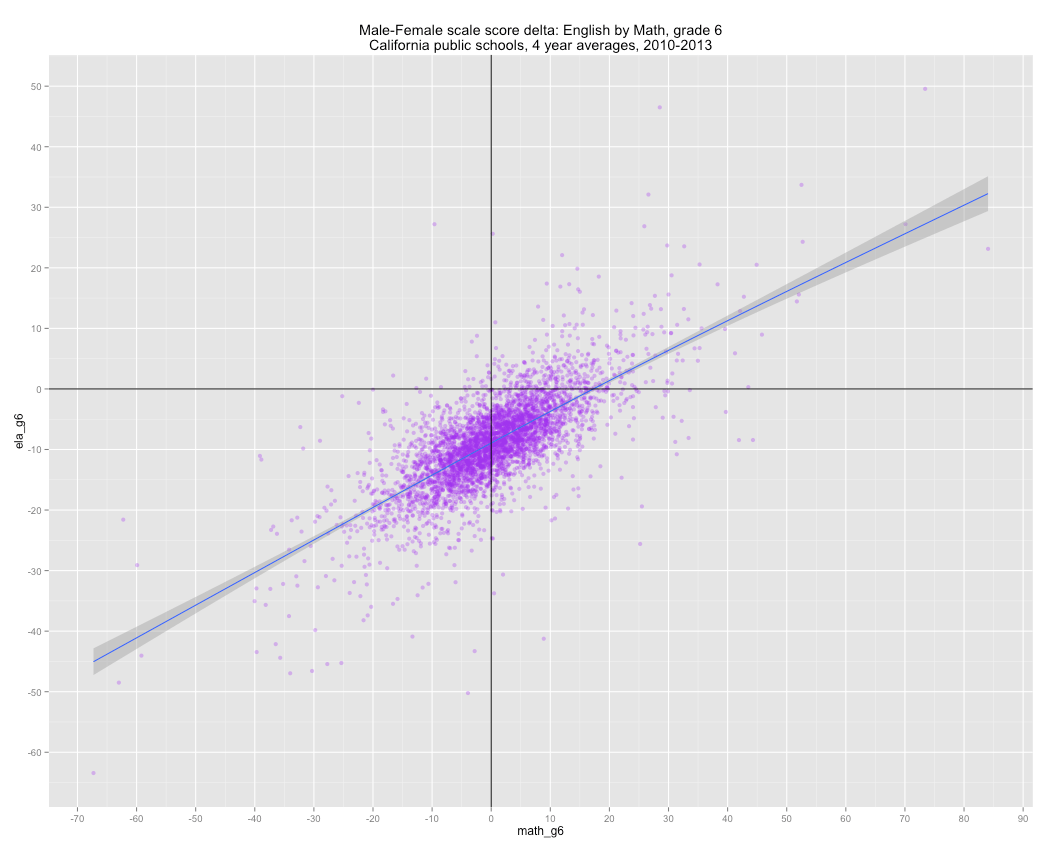
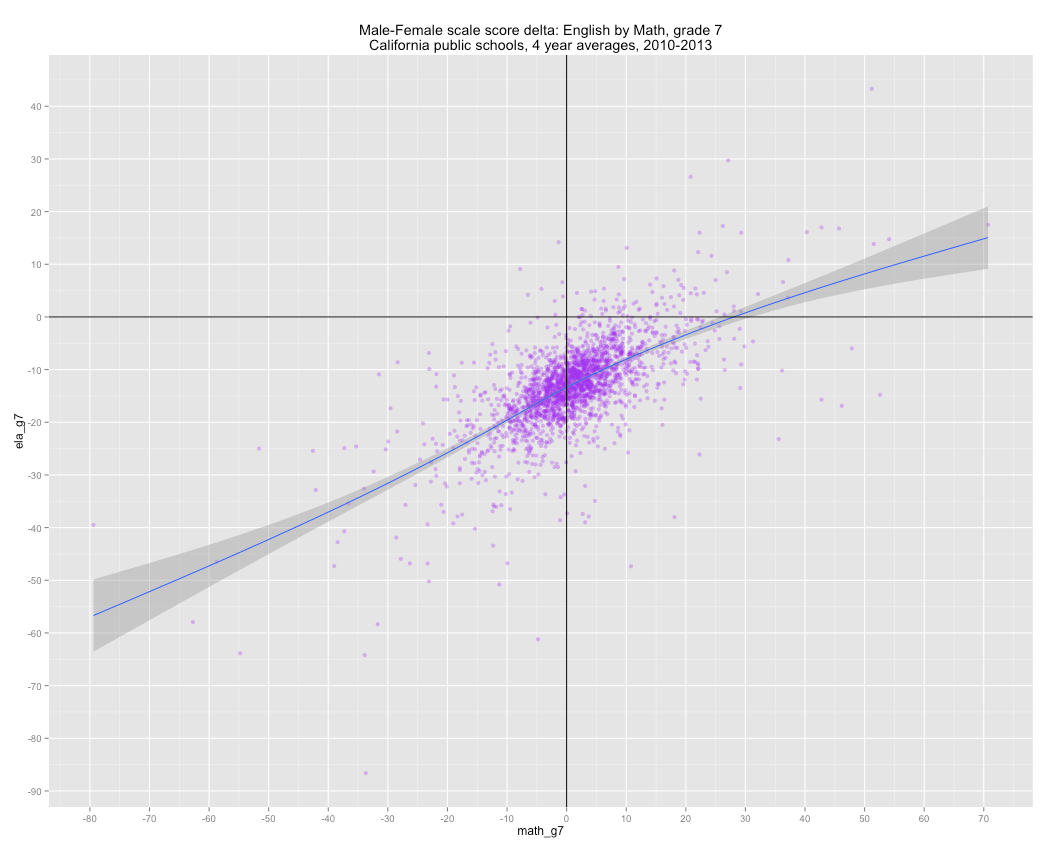
Since I already had a bunch data at my fingertips from a series of prior analyses I performed (see: one, two, three, four), I decided to see how well the analogous relationships play out in California STAR/CST at a school level at various grade levels, as in, comparing the male-female delta in 6th grade math to 6th grade English and so on and so forth. The scores and deltas are all 4-year averages, 2010-2013, for every school with available scores (which is almost all of them, a small number are suppressed when the n is very small for privacy reasons…which shouldn’t skew the results terribly)
Note, for both axes, positive values = male over-performance, negative = female over-performance (unlike in the above PISA plot that inverted one of the axes).


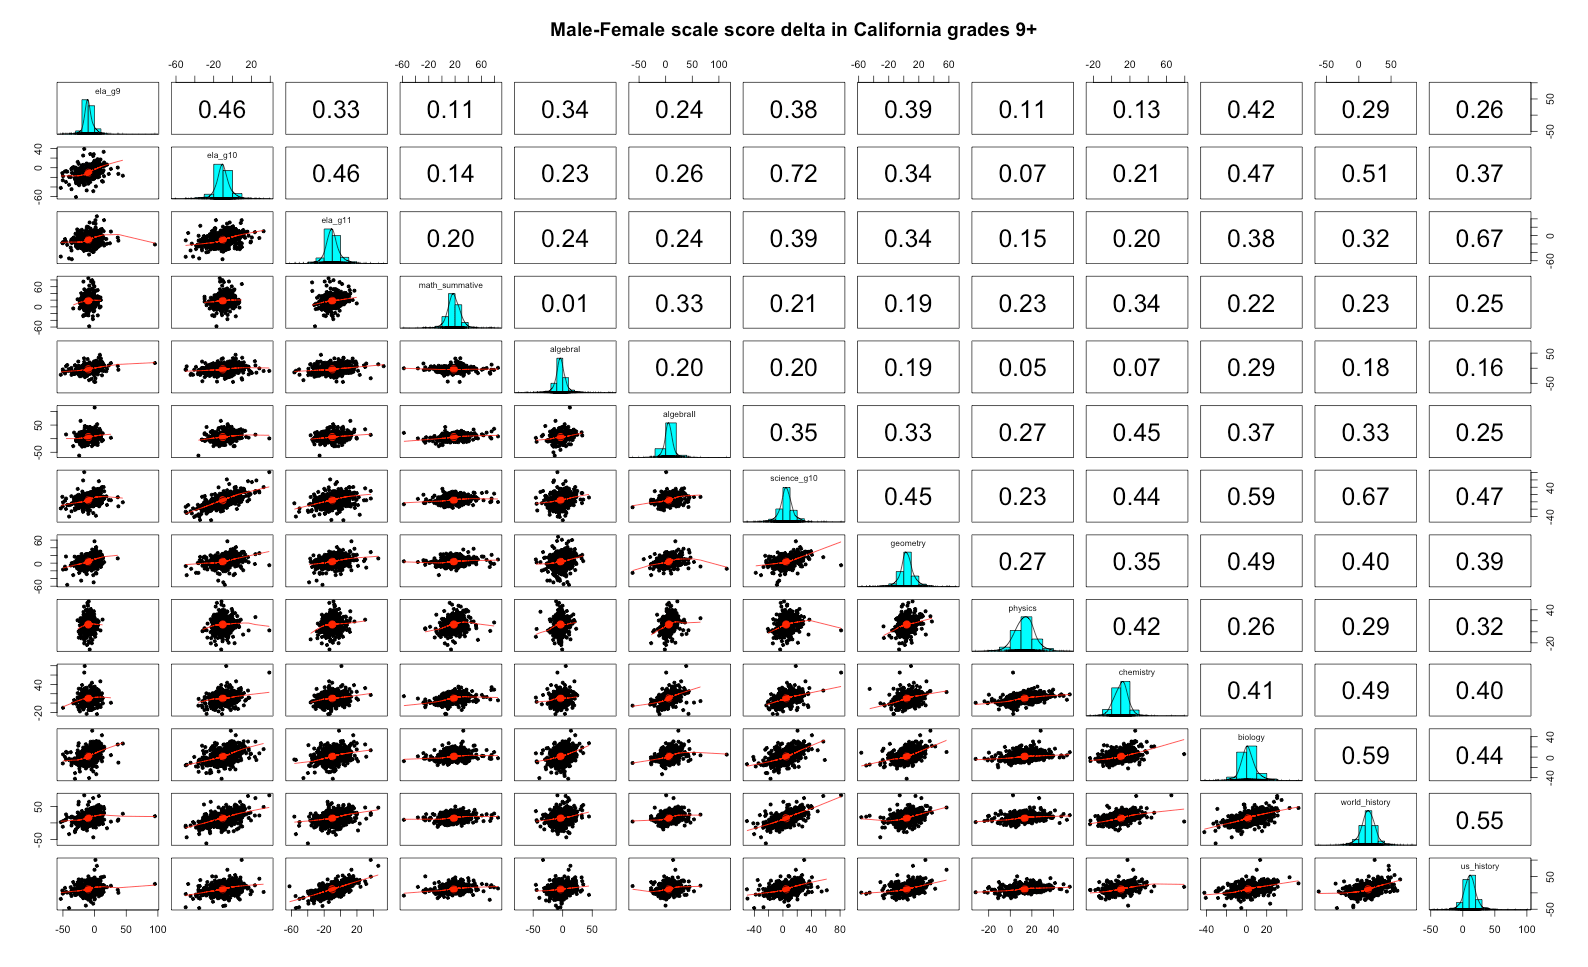
These comparisons get a little tricky with elective/non-mandatory subjects in high school due to different take rates, so the relationships are a lot noisier than if this everyone more people were tested and/if if each group was tested at the same rate.


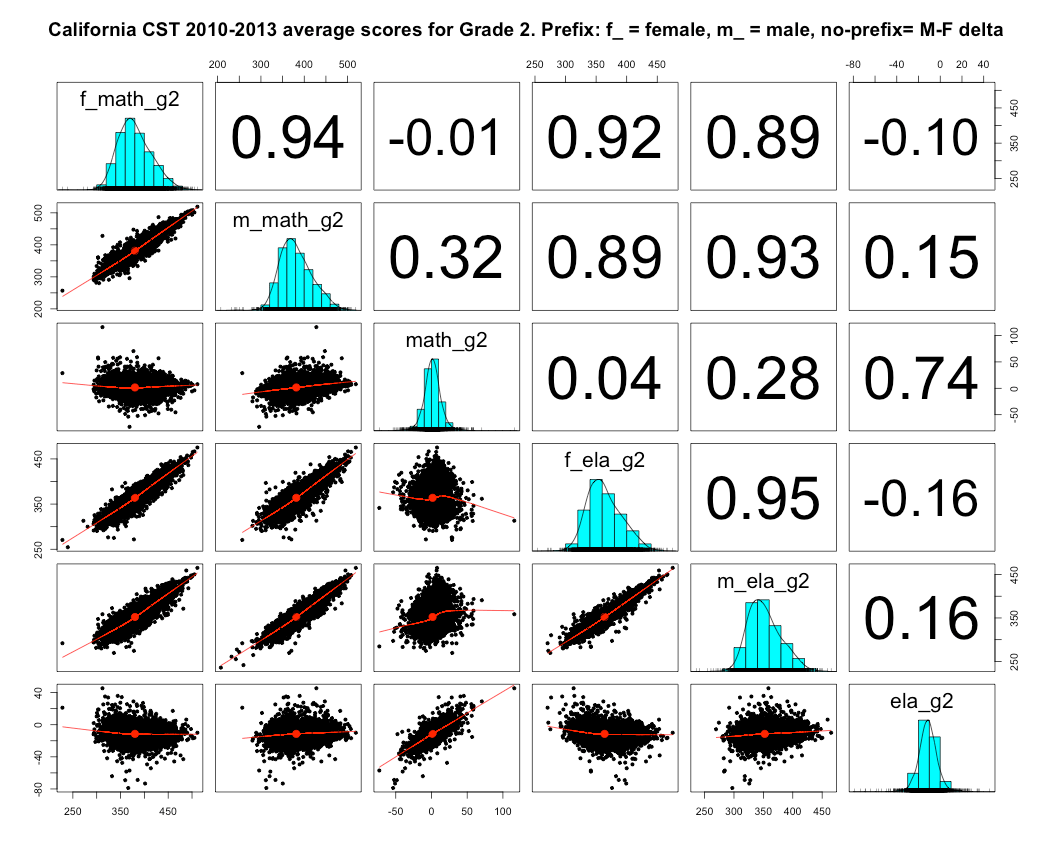
The relative weakness of males in math and science within these schools is much more correlated with relatively weak male performance than relatively strong female performance (and, especially, not actual objectively strong performance). In other words, the math gap is smaller to negative (female advantage) in schools where males perform worse than average and it is usually very weakly correlated with relative strength in female performance. The same holds true in other subjects too, including english (to somewhat lesser degree), but we sort of expect males to do less well in these subjects on average, so it seems less remarkable to some.
To illustrate Grade 6 math (with a full plot or two)…..


You’ll notice that the same-subject correlations are considerably stronger in all of these matrices for male scores (m_) than female scores (f_)….


I suspect much (but not all) the observed correlations here owes to predominantly lower SES and larger URM population schools where females are much more likely to apply themselves academically for a variety of reasons. It likely exists in other schools too, but the effects are much less pronounced in higher SES schools (larger perceived incentives for males to compete academically & diminishing marginal returns to female conscientiousness).

(Interestingly the between subject correlations in the same year are significantly stronger than the between grade correlations in the same subjects, even though these are multi-year averages).
Perhaps next I’ll approach this at the district level since they provide a more detailed breakdown of the scores by district than they provide for schools (% “advanced”, % “proficient”, etc etc). I strongly suspect the pattern will be much larger deltas at basic levels of proficiency than at the top since that would be consistent with the patterns I’ve observed here and the above study.