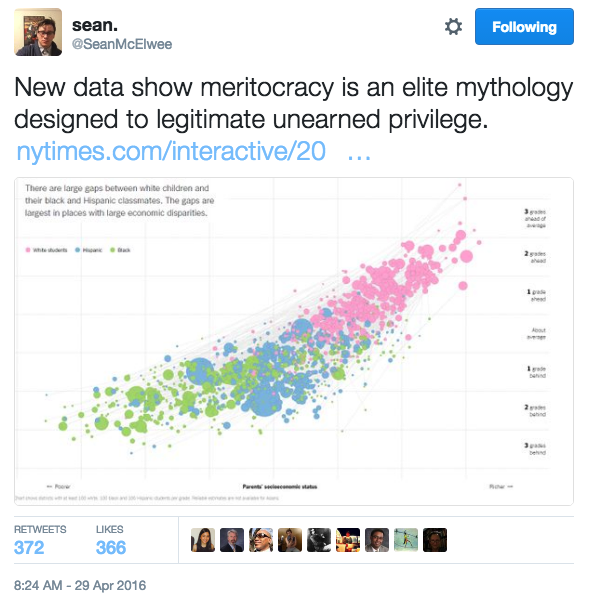
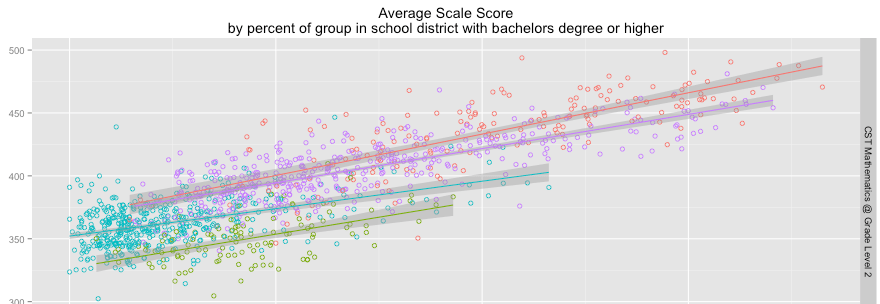
On April 29th the New York Times posted a nominally data driven article on school districts, test scores, and socioeconomic status. Though it contained some useful data, the analysis was terribly misleading and it excluded a tremendous amount of pertinent information. Many progressives took the article as proof that the system is “rigged”.

The NYTimes did not help matters by conflating the measures of socioeconomic status (SES) with income. Although every one of their plots used a composite SES measure on the x-axis, the article itself and various annotations give a strong impression that money/income/wealth are the primary drivers of this:

The words income, economic, wealth, money, rich, poor, and other related words were littered liberally throughout the article. Not a single mention was made of other predictors or even of the composition of the SES index they used, save for an easy to miss footnote at the end of the article.
The SES measure they used was defined in the SEDA archive as:
the first principal component factor score of the following measures: median income, percent with a bachelor’s degree or higher, poverty rate, SNAP rate, single mother headed household rate, and unemployment rate
[emphasis mine]
These non-economic dimensions actually exert significant influence on the correlations, are not directly tied to income/wealth/etc, and show marked racial/ethnic differences even at the same income level (e.g., single motherhood rates are much higher in the black community at any given level of income)
Rather than focus too much on what is wrong with this specific article (this sort of article is practically a genre unto itself these days), I will instead systematically address misperceptions here and attempt to shed more light on the nature and underlying causes of these patterns. I will argue that (1) these gaps are mostly genetic (2) they generally have little to do with systematic differences in parental economics (3) they have even less to do with the school systems themselves (4) these patterns are not unique to the US.
I will use some data from the Stanford Education Data Archive (SEDA), the same used by the NYTimes article, to help make some of my points but, unlike some of my other blog posts, I will try to cover each point in just enough depth to convey the gist of it (linking out for more in-depth analysis for those that are interested in the particular point). I will also bring together good deal of supporting evidence that is buried in different academic articles, government databases, think-tank research, and so on.
Table of Contents
- Intelligence is highly heritable
- Measured intelligence is a strong predictor of achievement test scores
- Achievement tests are also highly heritable
- SES does not dramatically alter the heritability of intelligence
- Adoption studies are consistent with heritability estimates
- Higher SES parents are different genetically
- Parent-child IQ correlates (duh!)
- Observed mobility differences between groups are consistent with observed ability differences
- The achievement gaps start very young (long before school)
- Large race and SES achievement gaps exist within schools
- These are not just test score gaps
- These gaps are poorly explained by neighborhood dynamics
- A brief look at within district gaps with the Stanford project data
- Household income is not a strong independent predictor of outcomes
- Lack of correlation with major, measurable school inputs
- Teacher quality matters, but is unlikely to explain these patterns
- Lack of success with pre-K and numerous other interventions
- There exist physical correlates of intelligence and some of these correlate with SES and race/ethnicity
- The very limited explanatory power of observed behavioral differences
- The relationships between SES and outcomes are present in every developed country
- Large between group (race & immigrant status) gaps are found internationally
- A bit on selective immigration
- Conclusion
Intelligence is highly heritable
We know from a large number of studies that general cognitive ability (sometimes referred to as GCA, CA, g, or intelligence) is heritable, which means that this phenotype (measured intelligence) varies within the population and that genetic factors explain a significant fraction of it. You might think of heritability as a rigorous measure of the average marginal contribution of genetic factors to observed phenotype variance in a population. It can vary some across time, populations, within populations, and so on, but it tends to be roughly consistent, especially in broadly comparable environments (i.e., environments with adequate food, nutrition, access information, etc).
Most estimates find that intelligence heritability increases linearly with age and that it is around 0.7 to 0.8 by young adulthood (which, fyi, is just a bit smaller than heritability estimates for adult height).

Moreover, the so-called “shared” or “common” environment, that which twins or siblings share tends to decline with age (converging on something very close to zero by young adulthood). That the shared environment equals approximately zero strongly suggests that, in the observed populations, economic differences, school systems, neighborhoods, and the like have little average effect on measured intelligence. The non-shared environment is always greater than zero, but it is little more than a bin for everything that cannot be attributed systematically to genes or the shared environment (e.g., measurement error, biological noise, and generally various things that might happen to a particular individual differently than his twin).
In short, we reliably know that genetic differences play a large role in explaining why some people are smarter than others and that the role of the “environment” as conceptualized by many progressives today is generally vastly overstated.
Measured intelligence is a strong predictor of achievement test scores

source
Correlations between IQ tests and achievement tests average about 0.7. Keep in mind that there is surely some measurement error in both measures (which reduces the correlation). The same person taking the same test will rarely get exactly the same score (test-retest correlations around 0.85-0.9 are common with IQ tests in children).
If we take a given IQ-achievement test correlation to be 0.7, we can expect the group with IQ test scores 1 standard deviation (SD) above the mean to score approximately 0.7 SDs above the mean on achievement tests on average (see expected value). Thus if we have a group that we have good reason to suspect are significantly more intelligent than another group we should expect, holding other things roughly equal, that they will also perform significantly better than the other group.
[back to top]
Achievement tests are also highly heritable
Although there is less data on the heritability of academic achievement, that which we do have is quite good and leads to very similar conclusions.
Take this study on the heritability of educational achievement in the UK. It finds that the GCSE is approximately 62% heritable. They also helpfully decomposes several other phenotypes and related factors that help predict achievement.

They find that intelligence is not the only source of GCSE heritability and that several other phenotypes are heritable and help uniquely explain the heritability of the GCSE score (e.g., self-efficacy, personality, etc).

While they do find roughly 26% of the variance can be explained by the shared environment (significantly more than what is typically found with estimates of intelligence heritability), it is still much smaller than the amount explained by additive genetic variance. Moreover, because the GCSE is a high stakes test, somewhat akin to SAT or ACTs in the US, only much more comprehensive and weighted heavily towards the curriculum, it is likely significantly more influenced by things like study habits, family, peers, school quality, and so on than these elementary school tests (or even our SATs, ACTs, etc). And, yes, the GCSE correlates quite well with SES at both the family and neighborhood level in the UK.
Likewise, other analyses shows that specific academic skills (e.g., reading, math, language, etc) are also highly heritable.

The point being that is we not need to extrapolate from IQ tests to know that achievement tests are heritable. We know that their heritability estimates are generally quite similar to that of intelligence (albeit with somewhat of a larger role for the shared environment)
SES does not dramatically alter the heritability of intelligence
While some have suggested that heritability is negligible for low SES groups these views appear to be driven by small (underpowered) studies and by forcing the coefficients to sum to one (note: the data usually shows low SES have somewhat greater variance). The better studies (larger n) suggest that absolute heritability varies modestly between SES groups.


The notion that heritability may be lower in lower-SES families is appealing, in part because of its environmental implications: If heritability is lower in lower-SES families, it suggests that environmental interventions might be more effective in boosting cognitive development for children in lower-SES families. The present study, which is based on a large UK-representative sample of children followed longitudinally, leads to a similar implication. Although the genetic influence on IQ is the same in lower-SES families, shared environmental influence appears to be greater in lower-SES families, suggesting that family-based environmental interventions might be more effective in these families. However, two further aspects of the results temper the policy implications of this finding. First, shared environmental influence is found in both lower- and higher-SES families and the difference in shared environmental influence between them is modest. Second, shared environmental influences on IQ decline from childhood to adulthood so that these influences might not have an impact in the long run.
In short, the long term efficacy of large scale interventions, save for those in the most impoverished or most dysfunctional environments (e.g., extreme neglect, child abuse, etc), is apt to be quite modest.
[back to top]
Adoption studies are consistent with heritability estimates


source
Note that while parents/family background may have some influence over some behaviors, like smoking or college attendance, those things that are closer to actual phenotypes or that have high heritability estimates, generally show strikingly different correlations.

source
The heritability estimates derived from twin studies, GCTA, sibling studies, etc are quite consistent with each other and with findings from adoption studies. These methods are valid and the estimates derived from them are much more robust than the sort of stuff that is typically published in social sciences and ed school literature.
Higher SES parents are different genetically
There are multiple traits that play a large role in shaping economic, educational, and social success. We know childhood measures of intelligence and good proxies for it (e.g., achievement tests) are strong predictors of future SES (particularly educational attainment, occupational status, and, to lesser degree, earnings).


source
Good measures of intelligence are often significantly better predictors of SES mobility than childhood SES (keep in mind that childhood SES and IQ are far from perfectly correlated)
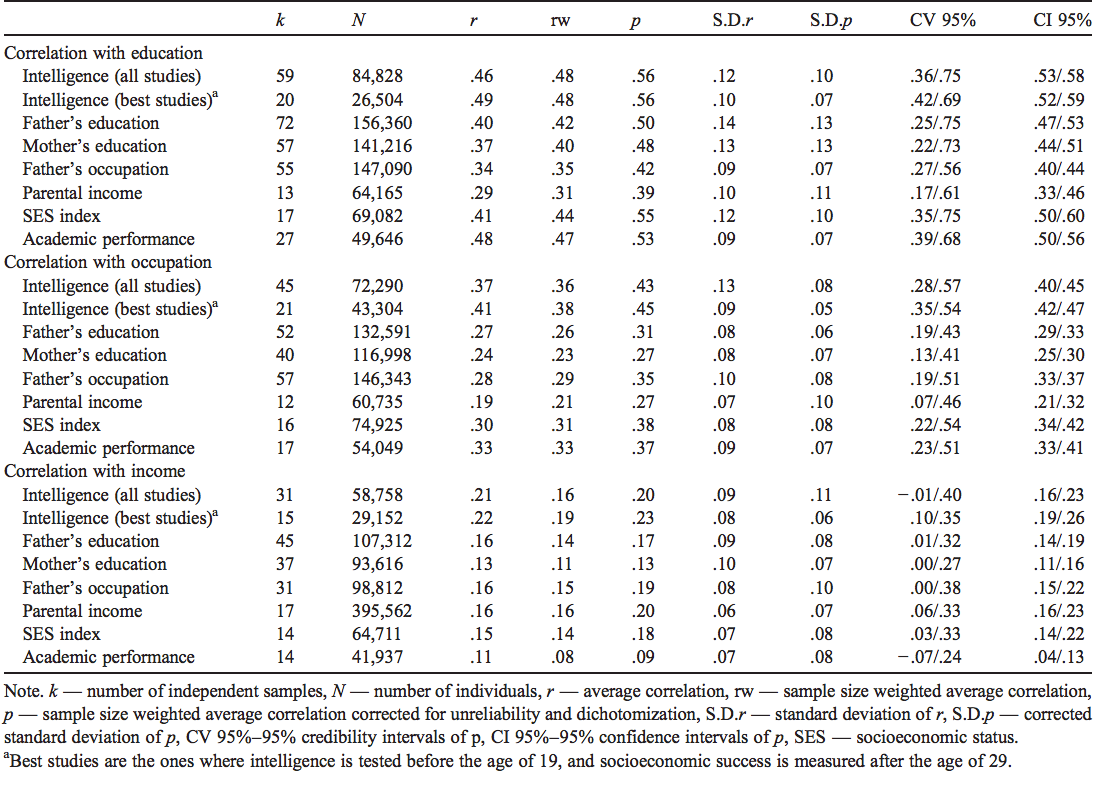
source
In fact, multiple analyses show that measures of cognitive ability (e.g., AFQT) are strong predictors of social mobility on the margins, i.e., probability of moving up or down a given SES level.

source

source
We know that:
- the current variance in intelligence is mostly explained by genetic differences
- intelligence and SES are well correlated
- it operates strongly on the margins of family background/childhood SES
therefore we can confidently infer, based on a great deal of evidence, that SES and intelligence correlate mostly because of genetics. In fact, virtually any trait that helps determine “success” (e.g., extraversion, conscientiousness, executive function, and so on) will, over successive generations, tend to correlate significantly with a broad measure of SES (yes, even in less than perfect “meritocracies”). Put differently, the higher final SES achieved by the offspring of higher SES is surely influenced by a great deal more than intelligence alone (though IQ alone can explain a large part of it).
Richard Herrnstein put it this way in 1973:
My theory hinges on an argument in the form of a syllogism:
1) If differences in mental abilities are inherited, and
2) If success requires those abilities, and
3) If earnings and prestige depend on success,
4) Then social standing (which reflects earnings and prestige) will be based to some extent on inherited differences among people.
This, by the way, is known as Herrnstein’s syllogism.
The evidence that has accumulated in support of this view since is very strong when taken on the whole.
Speaking of which, a recent large (n=112,151) GWAS study found strong genetic correlations between SNPs that have been reliably linked to income and SNPs that have been linked to a number of other phenotypes.

source
You will notice that IQ, educational attainment, ADHD, brain dimensions, and the like all correlate in the expected direction (some quite dramatically). This is very much consistent with the syllogism.
[Note: Other traits, which may not have as obvious impacts on SES, also align well with findings from several twin studies, i.e., the SES association with multiple health outcomes often largely mediated by heritability.]FYI: There is a tremendous amount of evidence now that basically everything is heritable (with broadly similar estimates for the shared environment for many, but not all, phenotypes). Good number of these phenotypes are known to correlate with SES at the individual and neighborhood level. It is becoming increasingly clear that they correlate mostly for genetic reasons and that a great many social scientists have greatly erred in assuming persistent correlations imply causation.
Parent-child IQ correlates (duh!)
This should go without saying, given the above mentioned heritability, but seeing is believing….


source
What you are seeing here is a roughly linear correlation (some noise due to limited number of observations) with some regression towards the mean (note: the truncated axis on the 2nd plot and the delta method on the first plot). Mothers in the sample in the bottom percentile have children with mean test scores around the 40th percentile, 50th around 50th, and 99th around 65th percentile. If you were to plot height (as I did in an earlier analysis, albeit without the truncated y-axis) you’d get something that looked very similar.

Incidentally, SES and income mobility look quite similar in rank-rank terms, i.e, broadly linear, regression towards the mean, modest slopes, etc. It is not a coincidence that (mid)parent-child SES & IQ correlations look a lot like traits like height, i.e., traits which most people accept to be determined mostly by genetic makeup today.

Question for the environmentalists: If SES, educational attainment, intelligence/test scores, and the like are just a matter of family background (money, schools, privilege, etc), why is it that the parent-child correlations exhibit such peculiar patterns? How exactly is it that the lowest IQ parents, presumably mostly low SES, have children that on average are significantly more intelligent than themselves and why the opposite for the higher IQ parents (who should, presumably, be most able to buy or otherwise find the extra resources needed for their children)? If these are predominantly culturally transmitted traits then why do those most able to do this fail at it or why do the least able “fail up”? Why is it that the lowest SES parents have children that are significantly upwards mobile relative to themselves? ….. How do you explain this environmentally??
[back to top]
Observed mobility differences between groups are consistent with observed ability differences
Observed mobility differences between groups are consistent with observed differences in cognitive, academic achievement, GPA, and other measures. Contrary to the belief of many that there is something unique to the low-income minority neighborhoods that produces a particular lack of mobility (e.g., bad schools, concentrated poverty, etc) we find (1) general consistency across the entire SES spectrum and (2) that these gaps are quite consistent with observed differences in ability (especially in ordinal terms).


(Note: this SES index is an equal weight of educational attainment, income, and occupational status…. not perfect, but good enough to get the gist of it).
If you were to look at test scores, GPA, and more you will find broad agreement with these patterns between groups and that these observables explain most of the SES levels we find vis-a-vis “mobility”. More analysis here
The achievement gaps start very young (long before school)
As early as 18 months of age (not easy to measure at a young age), researchers have found good evidence of significant SES differences in proxies for cognitive ability.


source
At 36 months of age we witness large SES and black-white differences….


source
The Whitehouse recently put out a report with this plot, pointing out that the gaps “grows throughout childhood”. There is some noise in these measures but it still quite clearly shows that the gaps are fully in place by, at most, 5 years of age and that they change little throughout school.


source
Other analyses actually show stable gaps as early as 3 years old. In any event, there is ample evidence that the gaps predate contact with the school system and that they hardly budge thereafter. We also know that IQ and achievement tends to be quite stable (not just across classes), ergo it is not plausible that the school systems are significantly responsible for these gaps.
Large race and SES achievement gaps exist within schools
One terribly under-appreciated fact here is that there is more real variance within classrooms than between schools, districts, and states.

source
From these summary statistics we should know that schools hardly produce homogeneous outcomes and that they are unlikely to be the great equalizer that some hope them to be.
Moreover, there is a large systematic component to the within classroom variance, i.e., we can statistically predict who will do better or worse using race/ethnicity and SES. For instance, within equally performing schools we find large differences in test scores by parental education levels, race/ethnicity, and race & poverty status (combined) in California.

Even assuming an entirely causal role for schools here within these groups (i.e., ignoring potential confounding from race/ethnicity and imperfectly measured SES/sorting between schools), you should consider that the least educated group would need to be in a school roughly 3 standard deviations better to match the score attained by the most educated group (and it’s quite likely that a good part of these slopes have to do with confounding on other dimensions of SES, parental cognitive ability, drive, etc).

Were California to provide race/ethnicity and parent education levels combined in the data I would have plotted that…. it’s a virtual certainty that the slopes would be significantly flatter and maximum group differences larger still].

If you’re interested I also posted head-to-head group comparisons (instead of plotting the mean score on the X axis, I compare group A on X against group B on Y for several different permutations).
[back to top]
There are not just test score gaps
We see similar gaps in GPA too:
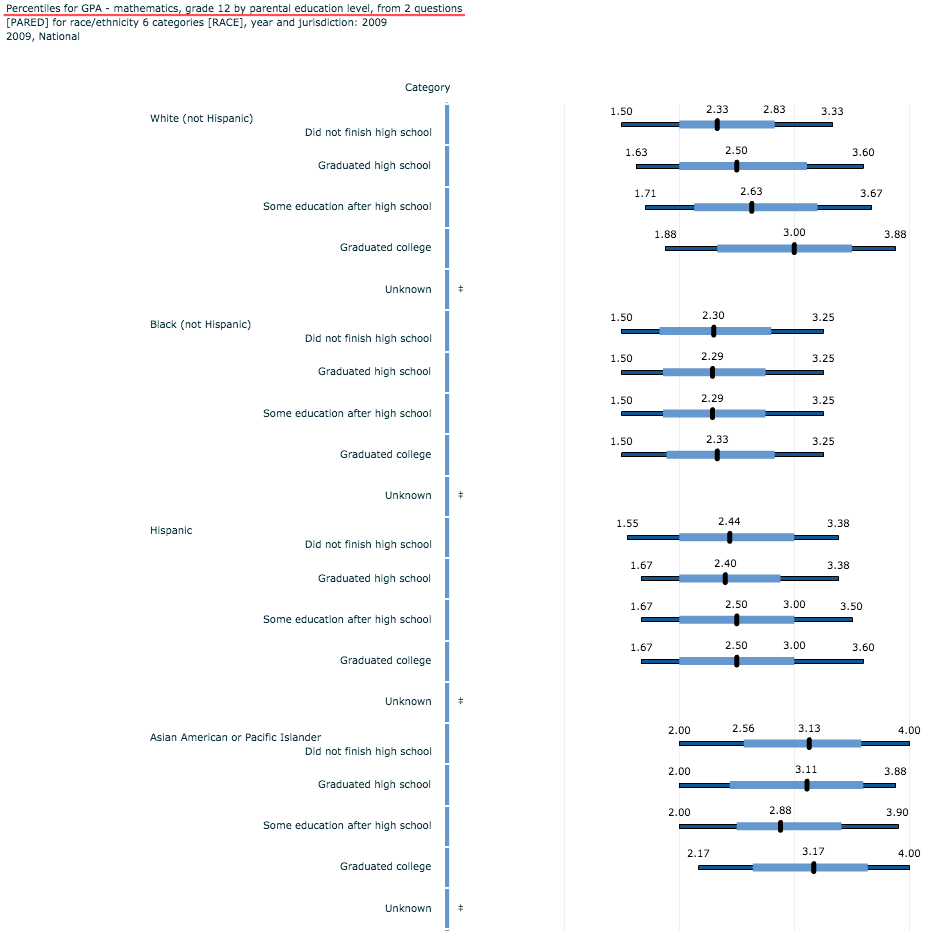

Although GPA tends to be lower in lower performing schools (usually lower SES and higher % URM schools), the grading standards are also lower so this somewhat understates the extent of the differences between groups (within school systems you’ll see much larger agreement between test scores and grades). Still you can see appreciable differences between groups.
These gaps are poorly explained by neighborhood dynamics
Some people proffer notions like “concentrated poverty” or, more broadly, neighborhood effects to explain away these patterns. I wrote a much longer post on this topic earlier, but, briefly, even if you take the demographic characteristics of each group within school districts (not just the overall mean) to get a handle on the neighborhood characteristics of each group, you will still find that large disparities exist. In other words, contrary to the argument that you cannot compare high SES blacks to low SES whites because they live nearer to poverty (or some such), you actually find these gaps exist even at the neighborhood SES level, i.e., even controlling for neighborhood poverty, education levels, and much more.

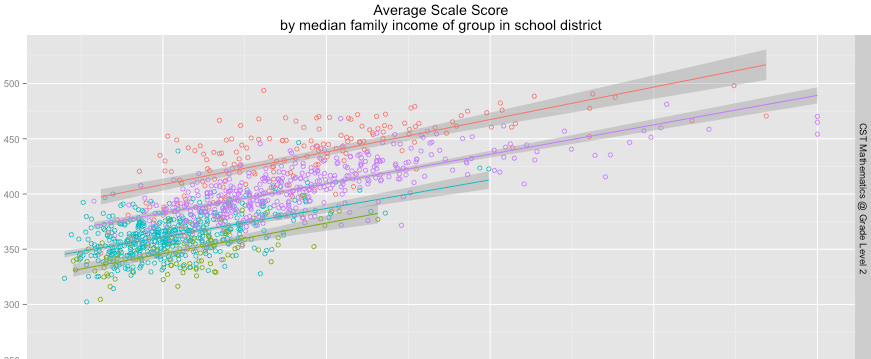
In school districts where black median income is 100K/yr, blacks still don’t quite match the performance of whites and, especially, asians in much poorer school districts.
Similar patterns are found with group educational attainment:
And poverty rates:

The point being that systematic differences in individual level results aren’t well explained by differences in neighborhood characteristics, schools, and a whole lot more since we find large gaps within schools, even in 1st grade, and racial/ethnic differences in test scores span very large differences in SES too.
While it is true that blacks and hispanics are more likely to live near poverty we find large gaps even in “minority” communities with very low poverty rates, high income, etc and in generally higher performing schools overall. Nor, for that matter, do we find the non-linearities within groups that we would expect to find if “concentration” per se is as powerful as imagined. I am not quite sure where that leaves those of the Church of the All Powerful Environment. At the very least, it is yet one more reason why we should be skeptical of the notion that school systems and economic measures are apt to explain much of these particular gaps.
A brief look at within district gaps with the Stanford project data
Though I doubt California is particularly unusual with respect to the dynamics within and between schools and school districts, the Stanford project provide data on gaps within a large number of school districts nationally (presumably those with enough members in each group to clear privacy requirements).

Even when the SES gaps are ~0 the achievement gap is ~0.5 standard deviations.

The gaps tend to grow in districts with higher SES whites.

Even when the median income gap is ~0 the achievement gap is ~0.5 SD.
Likewise for (parent) education:

As we saw in the California data, group poverty rates appear to be a significantly weaker predictor of group differences than some believe.


One broad pattern I have noticed here is that blacks tend to be in significantly higher SES and higher performing school and school districts than they are as a group. If one truly believes the school systems are themselves producing these differences one might expect this to mean that blacks actually benefit from better school districts than their group or individual level SES tends to suggest. That it to say that while they may be exposed to higher poverty (mostly from black neighbors) at a given level of income, education, or what have you, they also tend to attend higher performing schools and school districts and than naive comparisons of their SES might lead you to believe (quite contrary to what “wealth” theories typically imply). All of this tends to agitate against the view that schools have magical powers to raise or lower scores. It also tends to suggest that straight up individual comparisons of SES aren’t quite as unreasonable as some argue.
It is also quite clear that measures of segregation within school districts have little, if any, explanatory power.

Most blacks don’t live in highly segregated school districts and the degree of school segregation explains very little of the variance. Moreover, if we control for parent education level differences between groups, even these modest differences basically evaporate:

This isn’t all that different from the very modest differences the department of education found with a few crude controls using NAEP data.


source
Only 35% of blacks are in schools where they comprise more than 60 percent of the student population.
It is unlikely school “segregation” explains more than a tiny fraction of these particular gaps and, to the extent it is real, it is more likely to be the result of behavioral problems found in those schools. Teacher turnover is somewhat higher in majority black schools, which leads to a somewhat larger fraction of teachers with limited experience, which may produce somewhat weaker teaching overall. There are probably also some effects found through elevated classroom disruption. Nonetheless, these effects are apt to have very limited explanatory power when trying to explain overall black-white achievement gaps.

This may seem counter-intuitive to some since there is a often strong correlation between racial demographics and school performance, but keep in mind that even if all groups performed identically to their performance in majority white/asian schools (where everyone tends to be higher SES), we would expect a large mechanical effect based on stubborn within school SES and race/ethnicity gaps.
[back to top]
Household income is *not* a strong independent predictor of outcomes
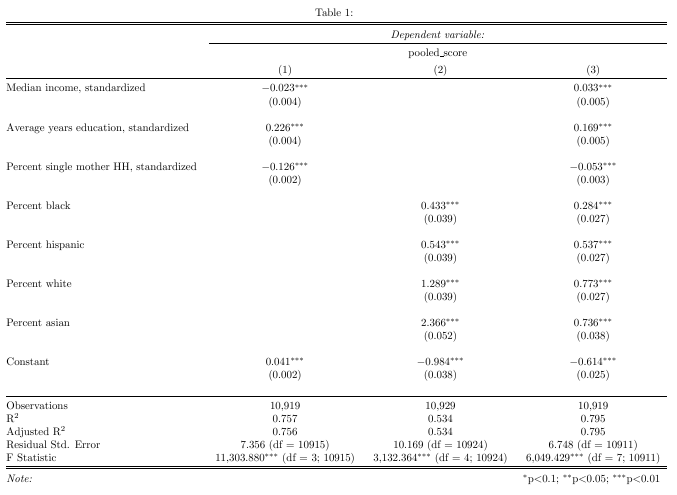
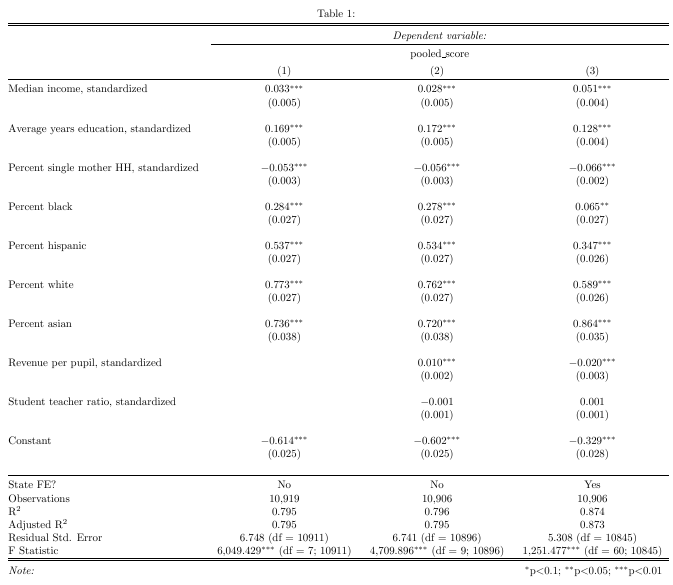
While income is clearly correlated with achievement scores, parental educational attainment by itself is an appreciably stronger predictor. It largely mediates the association with income in multiple regression (OLS). This remains true with the inclusion of race/ethnicity, total per pupil funding, student teacher ratios, and even state fixed effects.
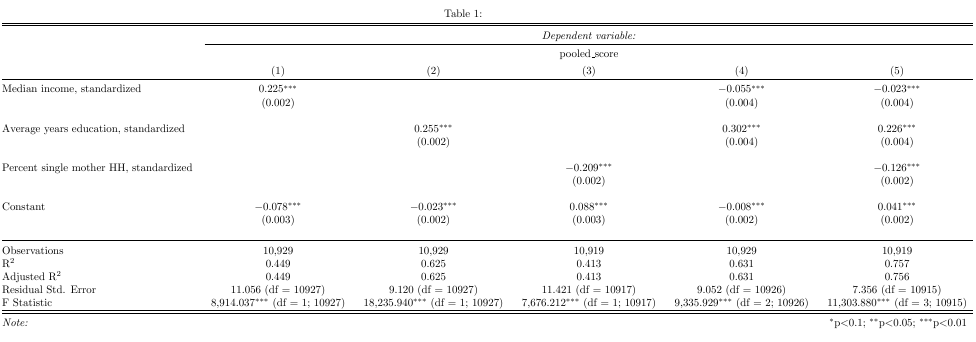
Note: In the analysis above I analyzed the pooled scores from the Stanford project with all districts that could be matched to the covariates (almost all of them, ~11K in total) and used student population weights.
Controlling for these other covariates implies that a 1 standard deviation increase median income (~26K/yr) correlates with at most (in these models) a 0.05 standard deviation increase in test scores, less than half of what a 1 standard deviation increase in average years of education (1.1 years) implies. Including revenue per pupil and student teacher ratios appears to change little.
This is quite consistent with a great deal of other data (see this bit on the SAT, this bit of analysis in Georgia, the correlations above for IQ:income vs IQ:education, and so on and so forth). Generally speaking the correlation with measures of ability is much greater (usually more than 2x) with educational attainment than income, so it’s not surprising when we see similar patterns when aggregated by school district. Some may be tempted to view both coefficients as some kind of exogenous input, as if extra education or extra income signals nothing about the parents genetically, but the (mostly) hereditarian view is generally the most parsimonious explanation for these and other observations. Regardless, more people need to understand that income itself plays little, if any, independent role, likewise for stuff that’s usually implied to go with affluent districts (spending, smaller class sizes, etc).
In fact, using just racial demographics (percent black, white, asian, hispanic, and native american) and average years of education in a simple linear model (no interactions or anything else) I can explain most of the variance between school districts nationally:

Given the large and consistent between group differences within schools, districts, states, regions, and the like, this model is not at all unreasonable either (though it could be improved with more variables, like the education levels for each group and more since the slopes are somewhat different….).
For comparison’s sake, the SES composite computed by the Stanford education project looks like this:

Note: many of these SES factors correlate strongly with race, even controlling for income. Some of them appear to add a bit incremental predictive power in OLS (e.g., family structure), but they largely fall away in multiple regression when race/ethnicity is included.
Even using their SES composite, say on the belief that there may be something particular to how these factors come together in their SES measure, parent education and race/ethnicity dominate in OLS:

Note: most of the coefficients are pretty similar after the inclusion of SES, the model doesn’t improve much, and the SES coefficient is fairly modest (~0.08 SD).
Back to the income angle: if we look at quasi-experimental research designs, like the effects of winning the lottery on child test scores, GPA, and the like we find the results are zero to even possibly less than zero.

source

Note:
This tends to support the view that the causal effect of family income or wealth itself is probably quite negligible, i.e., family income is associated with academic outcomes for reasons that have little to do with financial or educational resources available to children (as in, genetic heritability, parental skills, values, etc). Some people might be tempted to argue that Sweden is exceptional, but the evidence suggests that Sweden also has significant SES achievement gaps (probably much less different than some would like to believe)
Lack of correlation with major, measurable school inputs
Total revenue per pupil, which includes non-local sources of revenue (especially state and federal subsidies), typically shows zero or even negative correlation with test scores (i.e., even without controls) because, contrary to popular belief, struggling schools actually get more money in total.

Nor, for that matter, do higher SES schools even receive more funds in most states.

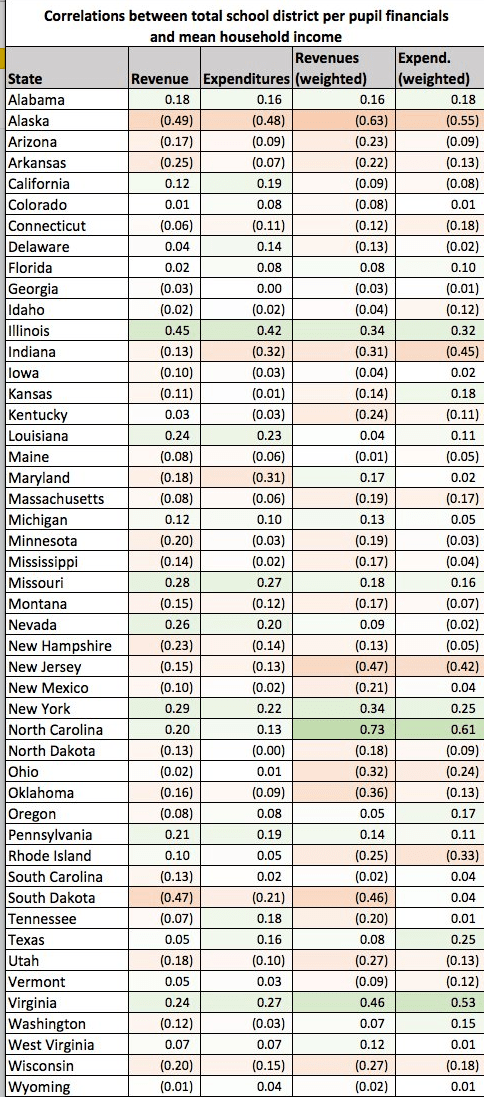

Surprise: districts with larger “minority” shares actually spend significantly more per pupil than majority white school districts in the same states! These sorts of inconvenient facts are routinely neglected by the major media, especially outlets like the New York Times!
There is a significant positive correlation between local revenue raised (usually through property taxes) and total revenue (or expenditures), but that’s not significantly driven by SES, income, or race in most states(at least not in the “expected” direction). It’s driven by the fact that some districts choose to raise +/- local tax revenue for education and the fact that states and federal governments aren’t necessarily obliged to step in to subsidize those that spend less than their formulas suggest they should, nor do they stop some districts from spending much more than they need to. The upside of this is that revenue and expenditures are only modestly (+/-) correlated with (SES|income|education|race), which gives us plenty of opportunity to observe high SES districts that spend modestly and low SES districts that spend extravagantly (and vice versa)…. and, still, most coefficients come in at something that is effectively zero.
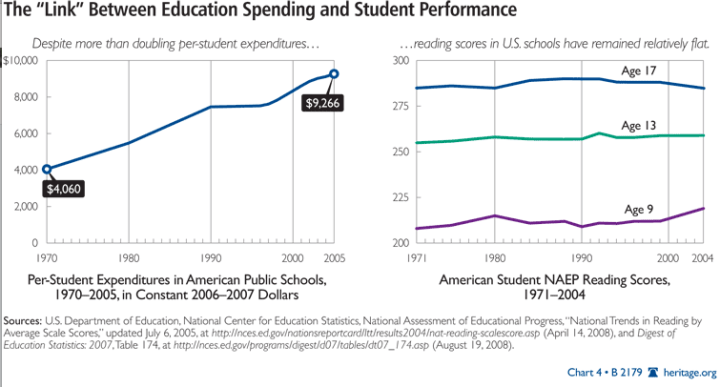
The non-existent to extremely limited relationship between spending and outcomes in multiple regression analysis and the overall patterns nationally (i.e., vast increase in $ w/o significant gains) appears to be accurate because multiple studies using regression discontinuities and similar techniques have found that increasing school funding does pretty much nothing also. It may have once been truly significant, back when US school districts spent much less (real) money per pupil overall, the disparities were larger, and some schools had not yet long since passed the point of diminishing returns, but not so much today (at least not within standard public schools).
[back to top]
Teacher quality matters, but is unlikely to explain these patterns
Teacher quality matters (some). However, they don’t vary much systematically enough between groups (SES, race/ethnicity, etc) to explain more than a tiny fraction of the difference. The modal teacher in high SES schools is pretty similar to the modal teacher in low SES schools in most observables and in teacher value-add (VA) estimates with a great deal of heterogeneity within schools.


source
Furthermore, the data actually shows higher SES and non-minority groups get significantly more gains across multiple measures (test scores, income, educational attainment, etc) from high VA teachers.

source
This is quite consistent with the existence of innate differences, i.e., more able will tend to learn more and learn more quickly given the same inputs.
For the observables thought to be associated with teacher effectiveness, we typically find results like these:

source
These are quite modest differences and the actual causal effects for these differences are surely quite small. Part of the problem with these complaints is that teacher quality is poorly explained by known observables like experience (save mainly for those with <3yrs experience), credentials, test scores, etc.

The results show large differences in teacher quality across the school district, but measured teacher characteristics explain little of the difference. Teacher licensure test scores are unrelated to teacher success in the classroom. Similarly, student achievement is unaffected by whether classroom teachers have advanced degrees. Student achievement increases with teacher experience, but the linkage is weak and largely reflects poor outcomes for teachers during their first year or two in the classroom.
source (h/t educationrealist)
Schools have very limited ability to tell who will be an effective teacher ex ante. They don’t behave that differently with respect to selecting on these observables and they don’t behave that differently with respect to the application of “value added” or related metrics in hiring and firing decisions. It is also quite likely that there is some heterogeneity in effects, some teachers may work better with some populations (e.g., there is some data to suggest that black teachers are marginally more effective at teaching black students, white teachers with white students, etc).
****
Some are optimistic that we might be able to substantially reduce SES gaps by shuffling teachers between schools with VA data (as in, give low SES students all of the high VA teachers), but this assumes that:
- higher performing groups would accept receiving much worse teachers year-after-year.
- these test score gains would accumulate over the years and across subjects (far from clear)
- these scores would be operationally equivalent in the final analysis (I doubt it)
- VA estimates are not biased by unobserved differences like genetics (a legitimate concern)
Even if these methods hold up technically it’s unlikely to be politically feasible.
[back to top]
Lack of success with pre-K and numerous other interventions
Contrary to popular opinion the best available evidence on pre-K suggests that it has little to no positive effect on cognitive outcomes. And a number of other studies recently have shown negative effects, like this one in Tennessee, or this one in Quebec.
It is quite likely that publication bias played a significant role in producing some of these large apparent gains in earlier literature.

There were also larger absolute disparities early on (as in, a much larger proportion of blacks and lower SES were living closer an absolute level of poverty).
Regardless, there is very little reason to believe that most children can benefit from pre-K today (especially those, in my view, the great majority that come from reasonably caring/nurturing homes) and we find these income patterns to be broadly linear within groups (mostly excluding the very highest income levels).
Likewise, repeated analysis of data generated by “Moving To Opportunity” (MTO), whereby low-income groups were moved to substantially lower poverty communities show essentially no gain on cognitive and most academic measures (e.g., GPA) relative to their control groups.


This is not to argue that neighborhoods are entirely unimportant in all dimensions. There have been some recent analyses showing modest gains in income, lower rates of single-parent hood, and so on, but the evidence does not support the view that these gains come from improvements in cognitive ability, achievement tests, or what have you (perhaps proximity to employment opportunities, lower dropout rates, etc…. not everything is driven by cognitive ability or other phenotypes)
[back to top]
There exist physical correlates of intelligence and some of these correlate with SES and race/ethnicity
Brain volume, surface area, and specific dimensions have been shown to correlate with intelligence, working memory, executive function, and other cognitive functioning, i.e., we can actually make some good predictions about a person’s cognitive abilities with brain imaging, dimensions, and the like (it’s not just a matter of “software”). Several these physical characteristics have been shown to correlate with income, education, race/ethnicity, and more.
While these physical observations cannot entirely explain the observed gaps or, in and of themselves, definitively prove the origin of these gaps, it certainly tends to support the hereditarian view on several dimensions.
Try reading this recent MRI study:
Significant correlations were found between income and all four cognitive assessments (flanker, r = 0.078; working memory, r = 0.143; vocabulary, r = 0.206; reading, r = 0.095; all P values < 0.001), as well as between surface area and all four cognitive assessments (flanker, r = 0.194; working memory, r = 0.212; vocabulary, r = 0.149; reading, r = 0.118; all P values < 0.001)


Incidentally, there are also clear racial/ethnic patterns in specific brain morphology (i.e., fairly distinct signatures between groups). While these specific patterns haven’t been linked to cognitive abilities (to my knowledge) it is yet one more piece of evidence that flies in the face of the notion that humanity stopped evolving, save for a few obvious traits like skin color, once humans started leaving Africa.
[back to top]
The limited explanatory power of observed behavioral differences
The differences in (reported) homework effort between groups is generally pretty modest (save, perhaps, for asians).

Higher SES do appear to put in somewhat more effort:

However, it’s unlikely to explain much either (diminishing returns, confounding, modest between group differences, etc)

Even controlling for SES and large differences in reported homework (or decent proxies for it), I find large B-W differences in test scores:

more here
To the extent people believe that mediocre schools, concentrated poverty, etc cause a reduction in effort, optimism, aspirations (e.g., plans for educational attainment), etc and that these explain B-W differences, it’s worth bearing in mind that essentially all of the self-reported data (and proxies for effort, like time spent on entertainment/non-academic activities) flatly contradicts this argument. [Note: I suspect it explains a good part of the white-asian differences because the differences in expectations and homework are very large, but whether whites could or would even be willing to replicate that is an entirely different question].
[back to top]
The relationships between SES and outcomes are present in every developed country
SES and differences in test scores (“academic achievement”) exists in every developed country. The United States is pretty middle of the pack amongst developed european countries with respect to the association between SES and student PISA scores.


Likewise, the United States is clearly not a real outlier in the between or within-school test:SES associations. If anything, the United States has a weaker between school association with SES and test scores than most. Moreover, there is also clearly a tradeoff between within school and between school inequality, i.e., countries that separate kids by SES less have larger within school SES gaps.

source
Countries with high between school associations and weak within school associations are mostly engaging in tracking, i.e., they sort students based on ability and those ability tests are also significantly associated with SES (no surprise!). However, it does not look countries with larger between school coefficients have significantly strongler correlations between SES and test scores.


These SES differences are persistent internationally and the US is not particularly unusual as compared to most of Europe. Large welfare states do not eliminate SES differences. Many of the welfare states are quite similar to us in this dimension. This despite the fact that (numeracy) skills actually explain significantly more of the variance in adult earnings than other comparable countries (and certainly more than Sweden, Finland, etc).
source
It is quite likely that family income is more correlated with child test scores in the United States than most others because measurable skills explain a larger fraction of parent earnings (and, as I’ve already discussed, these things tend to be highly heritable). Countries with larger unions, stricter employment regulations, and the like (generally more intervention in the workings of the labor market) tend to reduce the returns to skills.

Those measures are thus likely to reduce the association between class/SES and income too (meaning that I’d expect there to be a larger residual attributable to other measures of SES after controlling for income in Europe than in the United States).
[back to top]
Large between group (race & immigrant status) gaps are found internationally too
Many people seem to believe that the US is somehow unique in having large racial/ethnic disparities in educational outcomes amongst rich countries, i.e., somehow Finland and other countries with large welfare states, high performing education systems, and the like have abolished substantial differences between groups. The reality is that there is quite good consistency in outcomes in the SES and racial/ethnic dimension where data are available.
Most of Europe does NOT publish data by racial/ethnic group, but, as they have opened their borders to (mostly weakly selected) populations from less developed countries, their average outcome in their “immigrant” categories (including 2nd generation alone) are generally quite terrible (and will eventually influence their overall national averages…. because math)
For example, see this PISA math scores by immigration status

Note that Finland, Sweden, Norway, etc all have very large “achievement” gaps by immigration status, significantly larger than the average gap in the US (because immigration waves aren’t necessarily identical across generations you should not read too much into the differences between the 1st and 2nd generation, especially within a single country)
Likewise, Australia and New Zealand both have large gaps between their indigenous (Maori & aboriginal) and non-indigenous (mostly european) populations.

source
The US has much more racial/ethnic diversity than most other developed countries.

and a large fraction of our ethnic minorities are actually racial minorities, especially those from groups that perform at a lower level internationally. Canada and New Zealand, for instance, have significant selective immigration and a large fraction of those immigrants are East Asians (who do well practically everywhere).
France, on the other hand, actually has laws that make it near impossible to get data by anything resembling race/ethnicity, but it’s quite clear that their african immigrants are struggling.
Long story short: demographics matter. Even if you are skeptical that groups can vary in intelligence and related phenotypes for mostly genetic reasons, there is ample evidence that these differences are persistent and are not easily fixed by any known education system.
[back to top]
A bit on selective immigration
It is important to note that outcomes are not homogeneous by race/ethnicity or country of origin. Immigrant groups from regions that are generally poorly developed appear quite capable of doing well here if they are strongly selected enough.
For instance, we see a strong correlation between educational attainment in the first and second generation.


source
While I would not argue that educational attainment is entirely genetic, especially not when comparing across groups from countries with vastly different levels of development, it is likely that there is significant selection for both genetic and cultural capital (as in,strong work ethic and placing a high priority on educational attainment, acquiring skills, etc). Our immigration system generally does a terrible job of consciously selecting immigrants based on skills, earnings potential, etc, but distance (ocean crossing), cost, paperwork and the like act as natural barriers for large swathes of the world so that those that come from non-neighboring regions tend to be quite skilled (which is not the same thing as saying that they are rich).
[back to top]
Conclusions
To be perfectly clear, my position is not that these outcomes are perfectly deterministic. Individual students, teachers, parents, and others matter at an individual level. Schools can improve. Students can study harder. Teachers can teach better. Cultures can change (albeit usually very slowly) and these changes can have some impact on academic outcomes. However, most of the systematic academic gaps that we see exist largely because of genetic differences between groups. Some individuals and some groups see substantially more progress per unit of effort than others. Some people will simply never be able to perform at a sufficiently high level to benefit from a rigorous education or get a job commensurate with their (nominal) education level. There are also opportunity costs.
People generally respond mostly rationally to the set of choices in front of them, i.e., given their own preferences and dispositions, or, at least, most groups generally behave pretty similarly in this dimension. While individuals may offset some of their natural weakness through increased effort, we know of no reasonable policy levers at our disposal that can cause whole groups of people to change relative to others, fewer still that can claim to be fair in a procedural or “equal opportunity” sense. If group A and group B are one standard deviation apart in academic ability and roughly equal with respect to applied effort, there are bound to be large statistical gaps in market and social outcomes between those groups. Short of differentially changing effort we are not likely to change outcome gaps very much (baring genetic change/intervention which, fyi, may well be possible in the not too distant future).
Changing behaviors can also have ripple effects. For instance, if the low SES put significantly more effort into their school work (ignoring, for a moment, that their ROI is probably less), it’s quite likely that some of this will eventually be offset by higher efforts still amongst the higher SES in the bid for admissions to competitive universities and the like. This may still be a net win for a society (for some definition thereof), but it won’t necessarily close gaps appreciably. Focusing on gaps between groups tends to be counter-productive. We have more important, more tractable problems to worry about and yet we dedicate incredible resources to closing gaps and generally contort our education system with very little to show for it.
We would be better advised to try to raise the bar across the board, to help everyone within reason live up to their full potential. Yet we would profit from the recognition that some people, some groups more than others, are more limited in their abilities. For example, cajoling people that have neither the ability nor the inclination into higher education is just insane. A large fraction of higher education resource allocation today is little more than an expensive signaling war. Those more marginal people that manage get around the post probably do enjoy some small net gains in income, prestige, etc, but for every one of those there are significantly more people that lose because they are not capable of attaining basic competency with the material, graduating, and (especially) obtaining work commensurate with the education. Just because it helps some individuals does not imply that it is good policy, especially keeping in mind that we still live in a world of finite resources.
We should generally direct more academic resources towards those that can profit most from it (e.g., expand tracking, including, perhaps especially, minority and low-income communities). We should direct less towards those that demonstrate no particular inclination or ability or, at least, do it more intelligently (as in, focus more on basic skills than advanced skills for which they have little chance). We should instead direct those resources towards subsidies and think hard about how we can ensure that everyone in the US has a place in society (as in, more research & effort into job training, apprenticeships, etc).
In short, we should generally practice more empiricism and more realism over wishful thinking and willful ignorance. Though policy questions are never free from normative concerns, many policy debates can be moved forward significantly with more and better empiricism. Whether spending another 10k/pupil/yr on K-12 education OR giving 10k/child/yr to low-income households improves test scores, graduation rates, long-term income, etc more can be answered empirically. These are the sorts of questions that are routinely neglected due to achievement gap politics, questions that papers like the NYTimes ignores and obscures with their reporting on these topics. Too many people seem to be more concerned with protecting their beliefs than what is actually most likely in the interests of the groups they are presumably especially concerned about.
Simply brilliant! That’s all there is to say.
In a just world this piece would get no small amount of traction in the mainstream.
Good fucking work.
This is now featured on the front page of Marginal Revolution, so maybe it’ll get some mainstream attention…maybe? Maybe?
Congratulation
Great insight, detailed and very well written. Has there been any critiques of this? You’ve built quite a convincing case, but I’d rather hear the other side of the argument as well.
I haven’t read this article through, but I’ve already noticed that in a fundamental sense, the hysterical headline from the tweet shown at the beginning its true: children’s test scores have a large dependency on various properties of their parents, and in that sense, are unearned by the children, despite that test scores are a fairly good predictor of a lot of desirable life-outcomes. Perversely (from a progressive point of view), many of these causative factors are *less* malleable by the parents’ behavior than how much money they have.
Man, took a while to read through, but this is great work!!! Keep it up man