The NYTimes turned me onto a new data source in a recent article on college graduation rates by SES. They implied that college graduation rates are better predicted by “wealth” than by the students test scores (10th grade ELS scores taken in 2002).

Being both curious about the underlying data and somewhat skeptical of the particular claims (or, at least, its interpretation) I decided to investigate it for myself. Having done so now, I can tell you that it’s a pretty rich data set. Unfortunately, a few key data points (e.g., SAT scores, HS GPA, etc) are censored or rounded/binned to protect anonymity, but there are still a lot of interesting data there to analyze.
Update (6/6/15):
As in my follow-up post on economic mobility, I realized that they actually provided 9th-12th grade high school GPA as a non-continuous variable in the publicly accessible file. I have updated my post to reflect this new information in a few places!
First point
The parent’s educational attainment is a much better predictor of both test scores and subsequent child educational attainment than economic measures…..
(Bachelor degree) Attainment rate by test scores, grouped by parent income levels

Attainment rate by test scores, grouped by SES levels

Attainment rate by test scores, grouped by average parents years of education in 2yr increments

Attainment rate by test scores, grouped by parents’ highest education level (e.g., HS dropout – PhD/MD/JD)

Attainment rate by test scores, grouped by average combined years education of mother and father

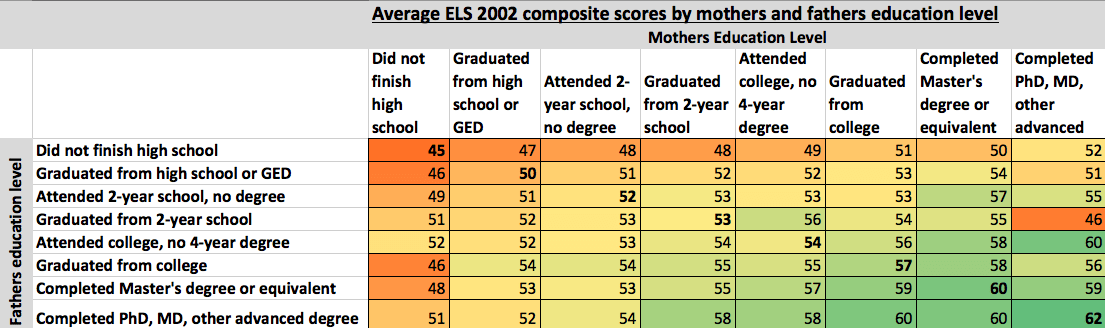
Something I noticed in a prior analysis of NAEP scores is that the parents’ education level appears to have an additive effect on test scores and that the sex of the better educated parent seemed to have no (consistent) systematic effect. In other words, the parents’ highest educational attainment wasn’t as good of a predictor as the averaged educational attainment of both parents.
I was able to reproduce this in the data set (note: the n is small with some of the more unlikely pairings, e.g., Phd w/ HS dropout… I should probably add confidence intervals here, but oh well!).

Second point
The cited SES measure includes many other correlates besides just income.
NLS-72/HS&B/NELS:88-comparable composite variable constructed from parent questionnaire data when available and student substitutions when not. SES is based on five equally weighted, standardized components: fathers/guardians education (F1FATHED), mothers/guardians education (F1MOTHED), family income (BYINCOME), fathers/guardians occupation (F1OCCUF), and mothers/guardians occupation (F1OCCUM). Each of these five composite variables that served as inputs to SES1 and SES2 were imputed if missing. See those variable descriptions for further detail. An occupation prestige value was determined for F1OCCUM and F1OCCUF.
The 1961 Duncan index was used for determining the occupation prestige values for the SES1 variable. The parent questionnaire included parent occupation codes determined by the respondents themselves. If the occupation texts were left uncoded or if the student supplied the parent occupation text, project staff subsequently coded those occupations if possible. Missing occupations were imputed. Parent education was based on parent report, or student report if parent data missing, imputed otherwise. Income was based on parent questionnaire information, imputed otherwise.
In other words, (1) income is only ~20% of their SES measure (2) wealth is not included and (3) the composite score is heavily weighted to towards parents education levels (through education directly and occupational prestige). This is a good thing as far as predicting IQ, educational attainment, etc are concerned, but we ought to be clear that it’s not just or even mainly about economics (despite the correlation).
Income alone isn’t that strong a predictor of test scores:

It gets considerably better with these other factors included.
Parents highest education level (single) is reasonably good.

But, as I mentioned above, we can do quite a bit better by averaging both parents education levels together into a composite.

Of course these educational credential categories are fairly crude and the data is not continuous, so the SES index probably does a bit better job incorporating some of this other data (e.g., occupational prestige is apt to further sort individuals by cognitive and other “social capital” factors).. Nonetheless we can clearly get pretty close to it with this alone today (perhaps less so in the future with credential inflation?).
Third point
There clearly are systematic differences in attainment that cannot be explained by these individual test scores alone.
White attainment rate by test scores, grouped by test score levels and income levels

White attainment rate by test scores, grouped by (3) income levels and test scores
However, these differences tend to narrow at the highest 10th grade test scores and they are mostly explained by differences in actual initial enrollment (or lack thereof). The actual graduation rate differences (i.e., excluding HS drop outs and people that didn’t try for anything beyond an associates degree) are fairly modest, especially at around 1 SD above the national average (national mean for all races/ethnic groups is 50 with an SD of 10, so north of 60….). It’s also worth pointing out that even top scorers of the highest income levels (200K+) graduate at something significantly less than 100%.
White graduation rate by test scores, group by (binned) test score and income levels

White graduation rate by test scores, grouped by (3) income levels and test scores
Fourth point
The differences by parental education level are larger than the income differences.
White attainment rate by test score (grouped by average of parents years of education)

White graduation rate by test scores, grouped by parents education levels (binned in 2 year increments)
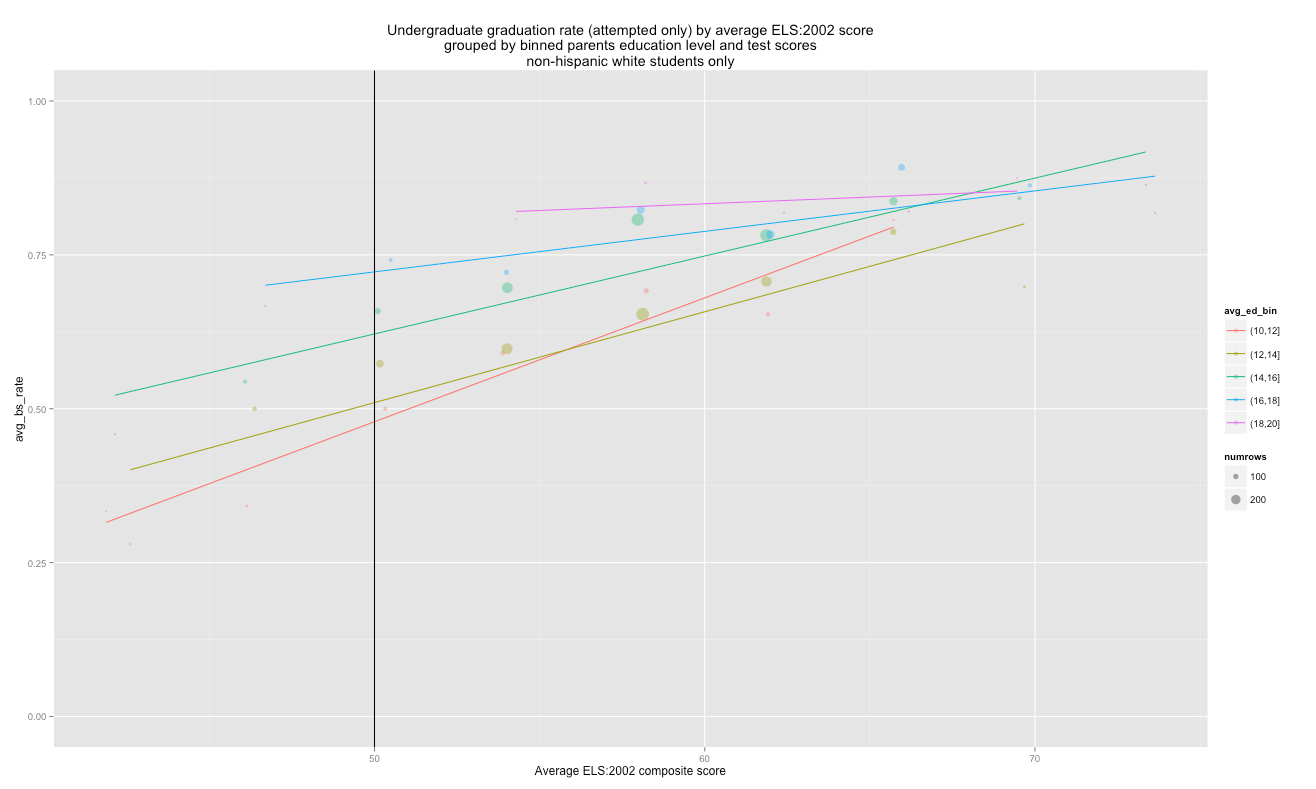
White attainment rate by test score, grouped by test scores and parental education levels (avg years)

Fifth point
There are clear differences in educational attainment rates by race. Asians at essentially all points in the score distribution attend college at higher rates than whites (and especially latinos). I suspect this is being driven by the fact that asians place a very high priority on educational attainment and that they are apt to post higher grades than you’d expect based on their test scores alone due to extra effort (in large part), which gives them better admissions probabilities and makes them less likely to fail out due to poor preparation, incomplete assignments, etc (too bad they don’t expose GPA or SAT scores in the public data!).
Attainment rate by test scores, grouped by race and test scores

Graduation rate by test scores, grouped by parents education levels and test scores
This tends to support that notion that there are other important differences driving these within-group SES differences than purely economic considerations. For instance, even holding these test scores constant, high SES whites may be more likely to post better grades and place a higher average priority on getting into good baccalaureate programs than low SES whites, independent of economic considerations per se, for reasons that have to do with genetics, social capital, cultural differences, and the like. I would bet that the children of bright but relatively low paid academics do much “better” on these sorts of measures than their income or “wealth” would suggest. (no, I don’t think it’s entirely genetic, but just because it’s not entirely genetic doesn’t mean that something that we can plausibly fix it through policy like straight forward economic concerns)
Sixth point (new: using HS GPA data ….)
We can predict bachelor degree attainment rates quite well using (1) ELS:2002 composite test scores (2) HS GPA groups (3) parental education levels.


To show what I mean be “over” or “under” achievement, I produced some histograms of HS GPA by test scores for different groups (by race, by sex, by parental education levels). I restricted this to a bit less than 0.5 SD below average and above (roughly broadly “college ready” territory) to save space and binned these in 4 point increments (about 0.4 SD, national mean being about 50).


Groups that clearly skew towards higher or lower GPA levels than predicted (e.g., asians, females, students of higher educated parents) are only crudely adjusted using HSGPA in the model since it’s not a continuous variable and there’s information lost within those broad bins (!!)
HS GPA by test score, grouped by parental income levels

HS GPA by test score,grouped by highest parental education levels

HS GPA by test score, grouped by sex

HS GPA by test score, grouped by race/ethnicity

[Note: These give a decent sense for the expected HS GPA for each group at a given test score for most of the distribution. However, due to range restriction and the fact that it’s not continuous, it’s probably not a great reflection of reality as it approaches either end of the HS GPA axis.]
Some other, somewhat unrelated, observations
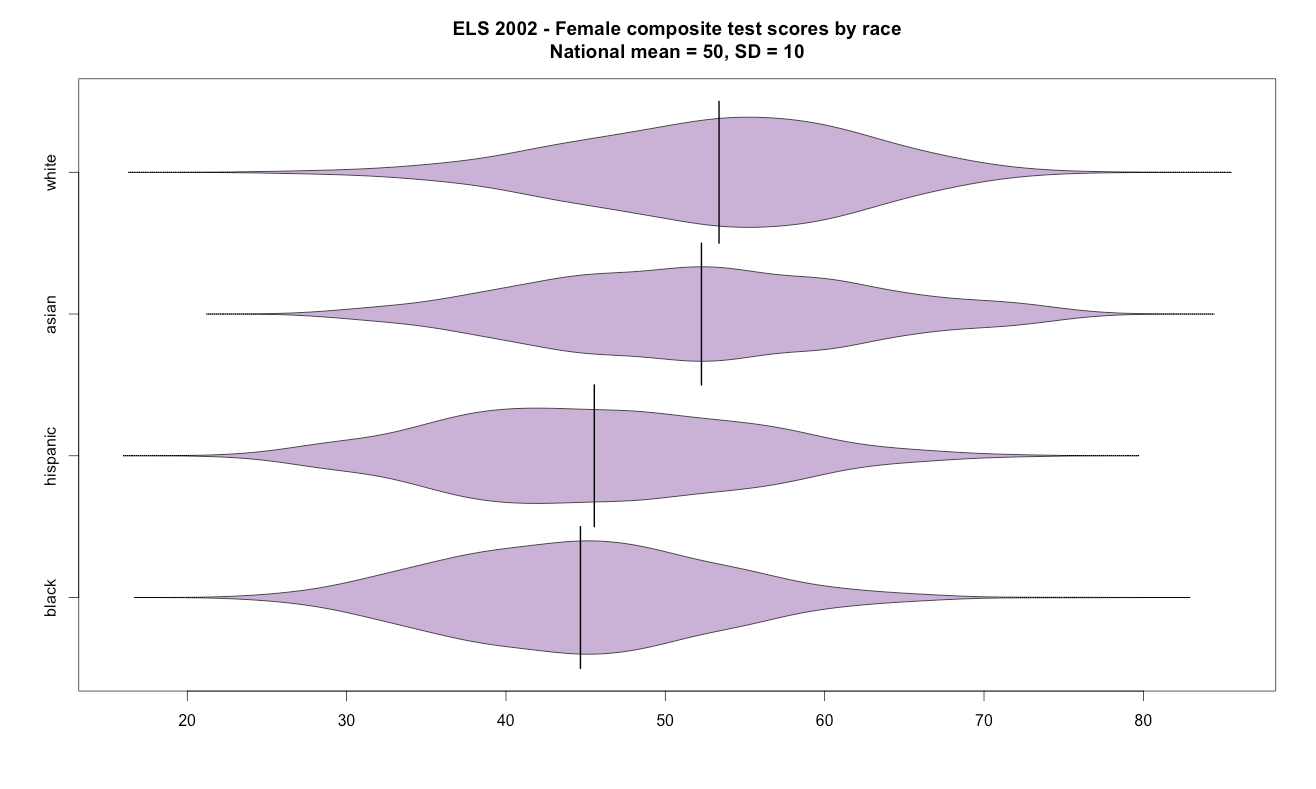
1: Asians/Pacific Islanders, curiously, don’t outperform whites with the composite score (math + reading) unlike on the SATs, California/STAR tests, and numerous other measures. The W-B gap about what is to be expected, i.e., 0.96 SD with the sampled groups. (note: I made no use of their population weights so these numbers could be skewed somewhat by over/under sampling of particular subgroups). According to the technical writeup on ELS:2002 it was designed to be more of a practical out-of-classroom skills test, more akin to the PISA, so this probably skews it more in the direction of IQ tests than more classroom material loaded achievement tests.
| race/ethnic | mean | standard deviation |
| hispanic | 45.5 | 9.6 |
| asian | 52.2 | 10.2 |
| black | 44.5 | 8.5 |
| multi_racial | 50.6 | 9.6 |
| white | 53.3 | 9.2 |
| american_indian | 45.6 | 7.9 |

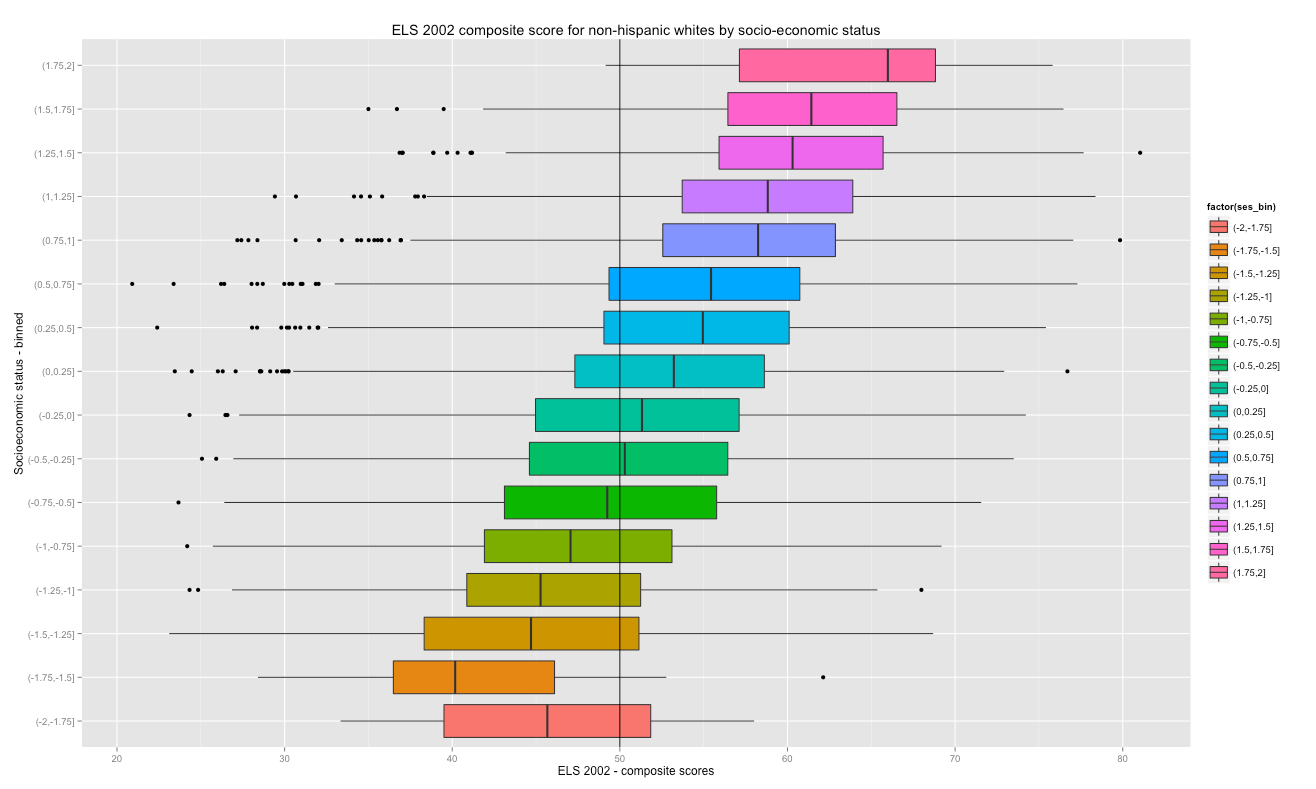
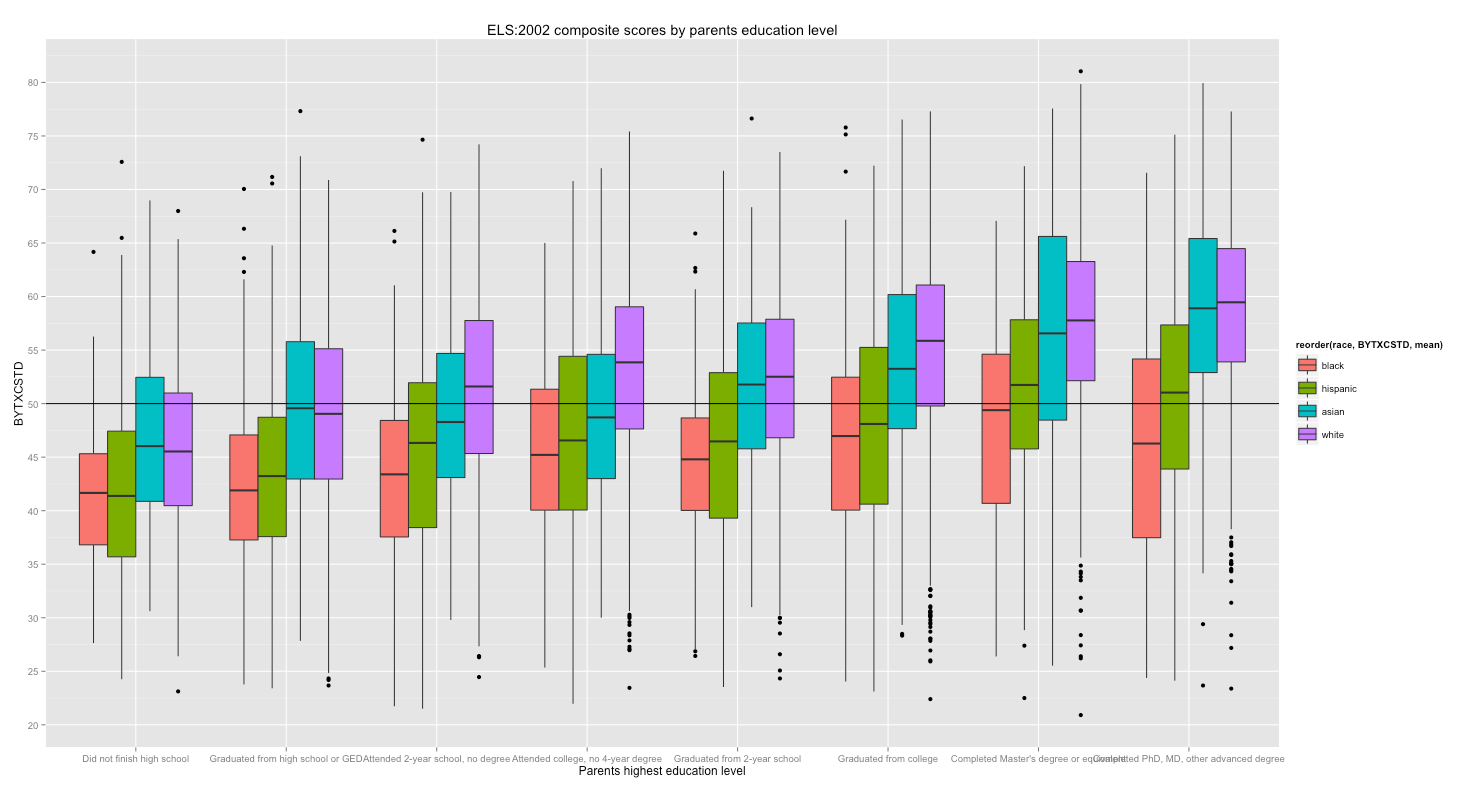
2: Box plots of scores by various correlates
Scores by race and parents’ income level

Scores by race and parents’ education level
Scores by race and parents SES (binned)

Scores by race and parents SES (continuous measure)

SES distribution by race (by their calculations)

Some bits relating to economic mobility
2010 white male earnings by 2002 (10th grade) scores (not conditioned in academics or work experience)

2010 white male earnings by parents SES (not conditioned in academics or work experience)

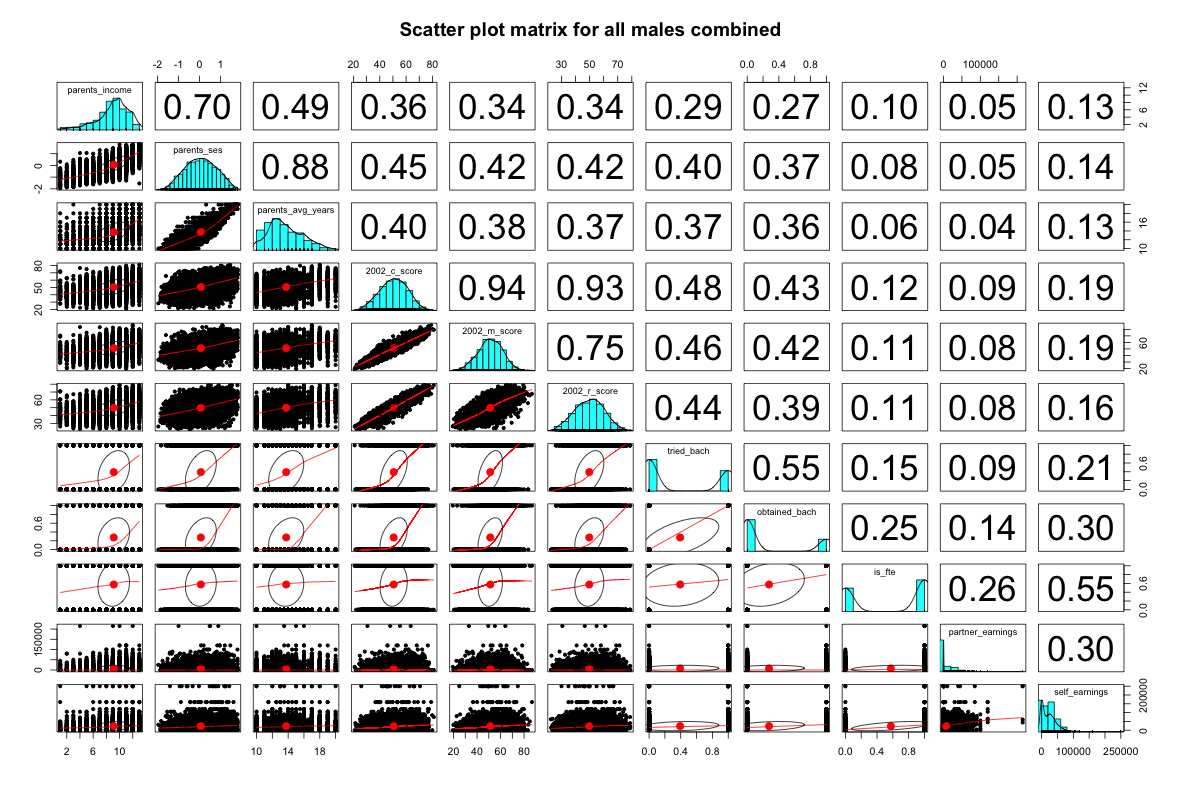
There is clearly a correlation with both measures, but neither are particularly well correlated in this (young) age group. That said, even here you can clearly see that test scores are a better predictor than parents income (or even broader measures of SES, which, in turn, are better correlated with education than income….)….


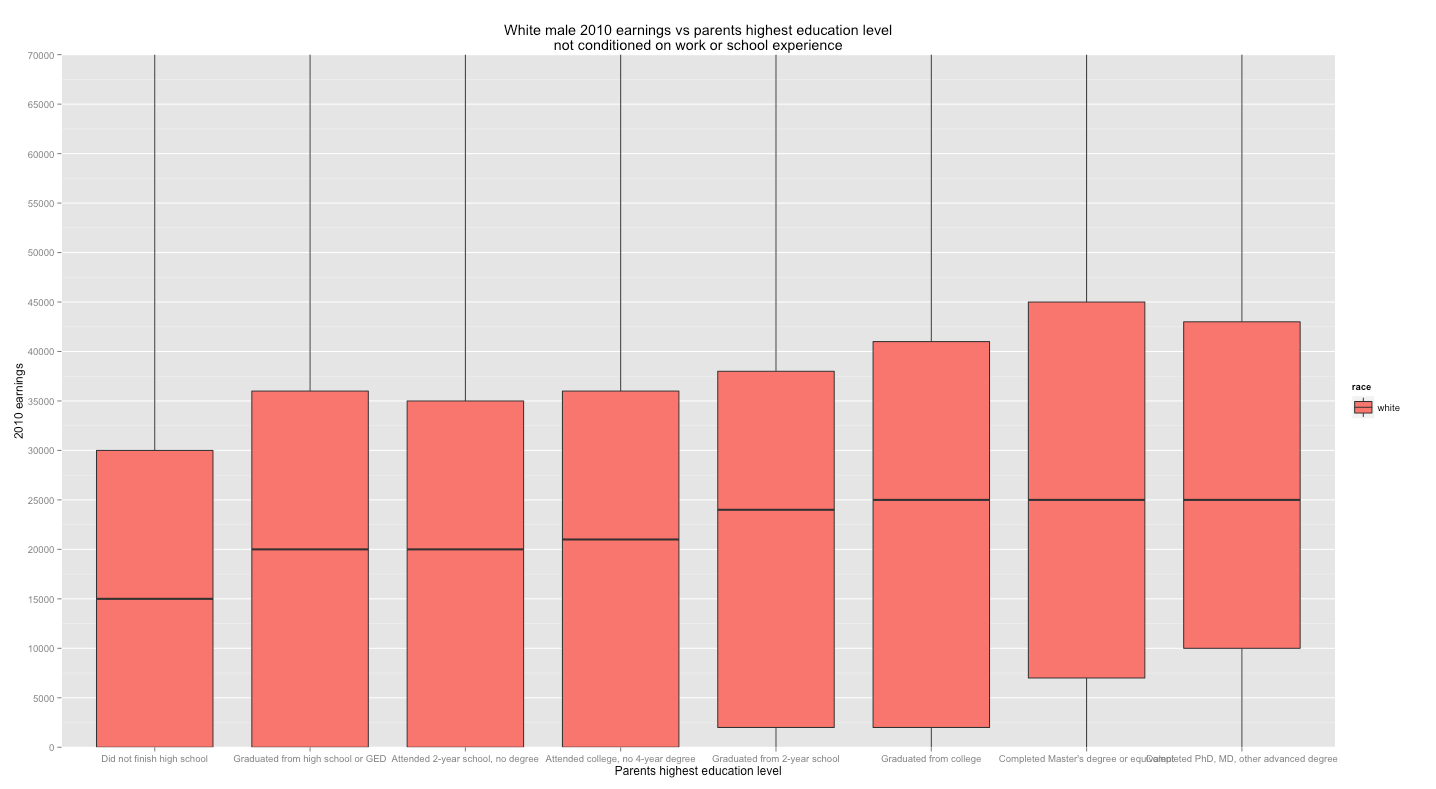
Box plots for white male earnings by various measures
By parents income level

By parents socio-economic status

By parents highest education level
By 10th grade composite test score
