Recently the media and various friends and family have been asserting that implicit association tests (IAT) “prove” that whites are biased against blacks and that this presumably substantially explains the racial disparities in police shootings.

Since I am skeptical about the racial angle in police shooting, the validity of measures like IATs, and of received wisdom in general, I thought I would take a look at “Project Implicit” to better understand it. The raw data for these results is available in SPSS format on OSF.io (albeit at >2GB) so I downloaded the data and performed some analysis in R.
Here are a few things I can say:
1: The reported averages by group (e.g., ethnicity, gender, political views, etc) hides a lot of variance within groups and overlap amongst groups.

The typical standard deviation is ~0.4 for every group with a reasonably large N.


[Note: 1 = strongly conservative, 7 = strongly liberal. N for 7 is fairly small]


2: The differences between the averages are typically very small by comparison to the variance in all of these groups
The only arguably exception to this is the target group (as in, blacks in this case), but even then this presumably implies that a long of blacks are strongly biased against black people.
3: The measured differences in the United States between whites, asians, hispanics, and other major ethnic groups are pretty negligible.
If these tests are measuring something “real” and important, the reporters ought to observe that non-hispanic whites are broadly inline with every other group, save for blacks.
4: The patterns appear to hold up internationally


These patterns appear internationally and do not appear to be notably stronger amongst non-hispanic whites in the US than are in generally European countries. Other ethnic groups, both inside and outside the US (various configurations), also have this “bias” (again, save mainly for blacks/africans). Non-Hispanic whites appear to have a slightly stronger “white” bias than other ethnic groups, but I would hardly say that that is strong evidence for even marginally higher anti-black bias. As in, it’s more likely that groups prefer their own and certainly find them more familiar, other things being roughly equal. I would bet that acculturation of minority groups in various majority populations likely makes them more familiar with the faces they encounter more regularly, providing that experience is not a generally negative experience.
5: Said bias appears to correlate positively with “diversity”

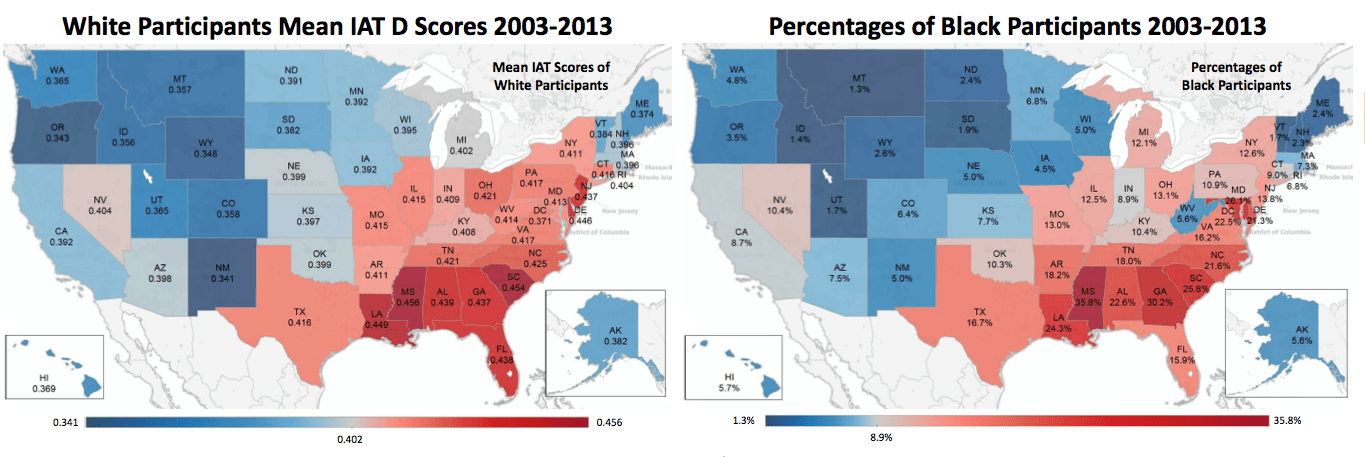
Non-hispanic whites reporting to live in counties (not just the state) with large black populations are more likely, not less likely, to exhibit this bias.

Likewise, “whiter” counties are less likely to exhibit this “bias”. I would think this would run counter to the narrative of the people reporting this stuff, i.e., presumably whites with less interaction with blacks should harbor stronger biases, not weaker biases.


 [Note: East Asians, Hispanics, and other groups also demonstrate more “bias” the larger the black population and/or the smaller the non-hispanic white population]
See here for: IAT (W-B) amongst non-hispanic whites PDF (long) density graphs
6: Similar “bias” exists against “Asians”


Asians have higher income, higher education, significantly lower imprisonment rates, higher life expectancy, better average grades, and so on and so forth for most measurable statistics. A certain breed of progressive even calls them a “model minority”. They surely also have fewer interactions with the police despite this IAT “bias” that is presumably every bit as strong against them (and I would bet that they are under-represented nationally in police shootings and in crimes against the police, i.e., based on my recollection of summary statistics from my earlier review here).
7: The tests have real measurement issues

People that report taking more IATs have “significantly” less bias. I suspect there is a real training issue here (which calls into question the whole pursuit)

Likewise, there is variance (which they imply is significant in other contexts) depending on the order of the test. If all groups are observed at a high rate this might not be an issue, but when the N is small this is likely to (randomly) skew the results further, i.e., depending on which order the test takers are randomly assigned.
8: The faces chosen surely influence the results
I have not reviewed the literature, but, other issues aside, they only use a small number of faces to reach sweeping conclusions about race bias/association. Are these faces and expressions truly representative of the broader black or white population so that we can draw sweeping conclusions about normal interactions in the real world? I would bet that there is considerable variability depending on the facial structure, gender, expression, facial hair, etc present on the face presented (I don’t think they had this level of detail in their data files, but it’s possible I missed it), not to mention things that they do not even show like clothing, observed behaviors, etc.


Some additional perspective on the heat maps by state


excellent job breaking down the data – you should get paid for this! or get a pub out of it. (either a publication or a trip to the pub – whatever works:) especially well done looking at overlapping distributions – if more people understood that concept there would be less animosity when discussing group differences in more volatile areas!