
This is a short condensed summary of key facts and relevant evidence I have discovered in my extensive research on healthcare. Conventional wisdom on healthcare is far from the mark, both in general and specifically as pertains to the United States. I have written several lengthy blog posts over several years in which I have reviewed the evidence in painstaking detail. Still, many people lack the time, interest, or attention span to fully absorb, and much of the information necessary to understand the big picture is spread across several pages. If you want to see further substantiation, please click through as I’m mostly focused on covering the highlights in relatively broad strokes.
Note (1): There are some new content and analysis on this page, but mostly I am aiming to summarize evidence I have already assembled and published on my blog.
Note (2): I have made extensive use of log-log plots in this post wherein the value displayed on the x-axis and the y-axis have been (natural) log-transformed. Although these types of transformations are bog-standard in economics, these are particularly useful here since I am trying to rapidly convey a bunch of statistical relationships and quantify their relative contributions. In case you’re not already aware, these slopes can be readily interpreted in percentage terms.

For example, the slope in the health expenditure-income plot below implies that a 1% increase in underlying value on the x-axis (income) predicts a 1.8% increase in value on the y-axis (health spending).
Health spending is determined by income
Health spending is overwhelmingly determined by the average real income enjoyed by nations’ residents in the long run. The income elasticity of health expenditure is also extremely high at a national level — the health share rises rapidly with incomes. This can be plainly seen in OECD cross-sectional data.
 We can also see this in a broader array of countries using a comprehensive measure of consumption, Actual Individual Consumption (AIC), which is a strong proxy for our income measure.

US health spending is well explained by these better, more comprehensive measures of income and consumption, i.e., the “household perspective,” since this better reflects the real purchasing power of a nations’ residents. This runs contrary to conventional wisdom because GDP has historically been used as a proxy for this concept. However, it is clear that:
- It measures something different (results can be systematically different)
- GDP is a much weaker predictor of health spending
- It is also a much weaker predictor of virtually all other socially relevant metrics that we’d expect to be associated with prosperity (especially health measures)
GDP still has its place, and it still correlates with the household perspective. Still, the theoretical and empirical basis for using measures of the household perspective in applications like this is overwhelming. The OECD, World Bank (ICP), and other international data-gather organizations have been making measurement invariant statistics like these available for some time, so there’s not much reason to use GDP at this point.
Income predicts changes in health expenditure
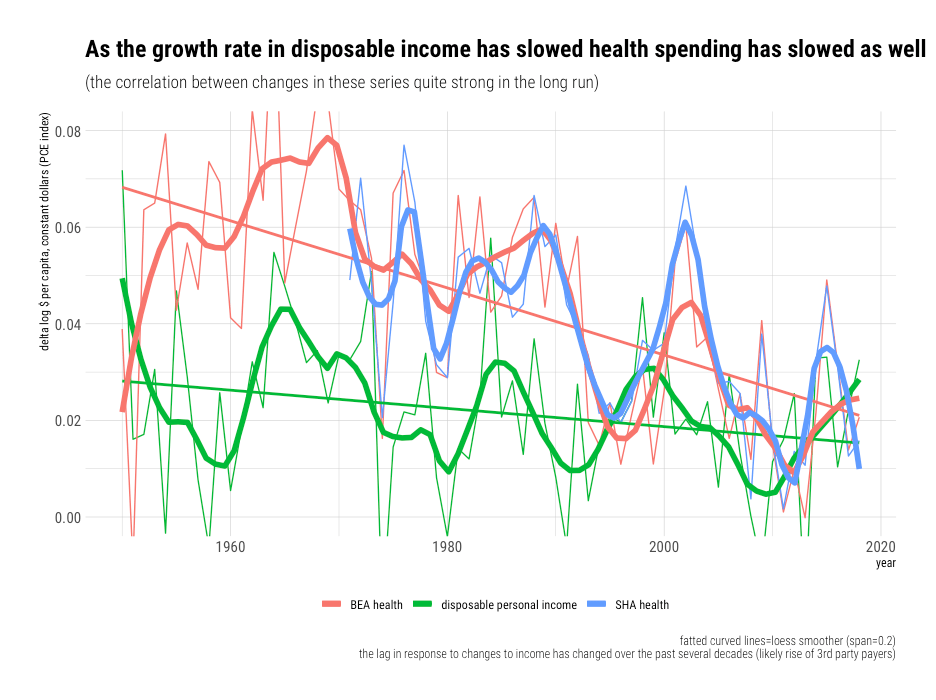
Comparable results are found in national time-series data. When real income changes, health spending responds in a manner that is consistent with cross-sectional results. Likely due to the large and growing role of third-party payment and an increasingly large, complex health system, the response in the same period has typically been negligible over the past several decades. It takes 3-4 years for payers and for providers to completely respond through reimbursement policy, premiums, services offered, and so on. Still, the strength of the long-run relationship is nonetheless readily apparent in the US time series.
Comparable results are obtained in OECD data with similar household income measures.

Amongst the high-income countries for which we have useful data, reverse causation is unlikely because changes in household income and consumption precede changes in health spending. It is very unlikely health spending somehow mechanically, artificially inflates observed household income levels or that the effects of health spending on health are so significant and transmitted so strongly to income levels amongst developed countries as to have substantial and consistent effects on this order.
Causally-identified estimates are not per se incompatible with these national effects
Some economists do not like this sort of straight-forward analysis even though it’s supported by multiple lines of evidence and even though they lack a good working theory for what might confound these relationships. They want better causal identification. While it’d be nice to have additional evidence of this sort, high-quality studies that can directly address this argument are hard to come by because (1) these are national-level effects and (2) changes in income take several years to be reflected in changes in health spending due to well-known multi-year lags.
Expand for an explanation from CMS/HHSCMS has long used Disposable Personal Income (DPI) as the primary exogenous variable to forecast health spending in their long-range health spending projection models. They allow for 7 years of lag in their models. The existence of long delays and indirect income effects are well-known by the industry. Still, CMS is probably better positioned than most to explain this, so I’d recommend reading their explanation:
(emphasis mine)
“It has been repeatedly shown that variations in real per capita GDP (used as a proxy for income due to data availability) explain a substantial share of variation in health spending across countries and time….[the] elasticity [in our model] implies…a 1-percent increase in income growth will result in a cumulative increase in private PHC spending of 1.5 percentage points…The long lags that are built into this model reflect several important characteristics of markets for health services. In particular, since private insurers or public payers account for the large majority of health expenditures, this spending is largely insulated from contemporaneous changes in household income….For the most part, the decisions of insured patients are not immediately affected by changes in income except in those cases in which substantial parts of the expenditure are paid for out-of-pocket….The other critical element…is the role of multiple intermediaries between consumers and medical providers. These intermediaries consist of employers or unions…and governments….as well as the regulations that constrain private employers and insurers. The intermediaries’ determinations may result in changes in coverage and methods of payment,which can then affect providers’ decisions on behalf of individual patients. Many such decisions are determined contractually or by regulations….Consequently, substantial delays may be required to implement any response to changes in underlying consumer preferences, both to negotiate any changes to contracts and regulations, and to implement such changes in a way that would influence choices of medical treatment in practice. In addition, in response to any modifications in the design of their health plans, employees may take time to respond to changes in incentives under the conditions of insurance coverage by gradually changing their patterns of health care consumption over time. Further, doctors and other medical providers may also respond gradually to changes put in place by payers. In the long run, responses could include altering treatment protocols in response to the incentives inherent in methods of payment for care and in response to constraints on coverage imposed by insurers. Because of these interactions among intermediaries, consumers, and providers, it is reasonable to expect that the response of the system to changes in income growth will extend over a period of years.“
Several economists have used instrumental variable estimates of the income shocks on health spending to argue the true causal effect is substantially below unity (income-elasticity less than one). Some of these estimates (e.g., oil shock) are credible insofar as they are likely to accurately measure the causal effects of income on health spending that play out at the regional level, especially in the short-run.1 However, this regional approach represents a substantially different unit of analysis. The effects of market income within any given region are likely to substantially leak out via taxes & transfers, employers, health insurers, hospital systems, and other intermediaries whose budgets and regulatory mechanisms are not neatly contained within any particular region. Furthermore, relative prices are also apt to screw up extrapolations from regional effects.
Expand for a fuller explanation of leakages and relative pricesThomas Getzen explained this well in his paper, “Health care is an individual necessity and a national luxury….”:
“Many apparently closed funding pools such as HMOs, and private insurance companies and employer benefit trusts, are actually porous mixed intermediates, with substantial leakage due to taxation, transfers, cross-subsidization of catastrophic cases, and government guarantees. The only set of coefficients that consistently reflects income effects within closed pools are those which use the nation as the unit of observation. Even for the nation as a whole, financial boundaries can be flexed by transfers of funds across time…The budget constraint is much more tightly binding in the long-run, and national time series estimates of income elasticity that account for lags are greater in magnitude and explanatory power, and also reveal that the correlation with current income is close to 0….Units of observation must correspond to the units at which decisions are made. To the extent that costs are a result of expenditure decisions made at multiple levels, then a multilevel analysis is required. The consequences of income for spending are established at the level where budget constraints are fixed. For some types of health care, this is the individual household, for others, the hospital, region or insurance plan, but for much of medicine, it is the national budget constraint that is most relevant. With insurance, it is the average income of the group, and the fraction that the group is collectively willing to spend on medical care, that determines the health care budget, not the income of the particular patient being treated. Since the income elasticity varies with the level of analysis, health care is neither ‘a necessity’ nor ‘a luxury’ but ‘both’.
It is the boundaries of transactions, not geography, that are most relevant for the analysis of costs. Recognition of budget constraints leads to a realization that the effects of many individual and organizational variables will be allocative, distributing the total across patients by need and other characteristics, rather than additive, summing upwards to some flexible aggregate. The observation that the amount spent on health care is determined by the amount available to spend rather than the amount of disease is not particularly new, and may even border on the obvious, but has not always been consistently incorporated in discussions of health policy, or in structuring the models used for empirical analysis of health spending.”
Above and beyond the type of leakages (spillovers) described by Getzen, differences in relative prices are likely to contribute. As real per capita income rises nationally, the relative price of certain goods and services changes quite rapidly relative to other goods and services, in addition to average incomes. The price of basic necessities (e.g., food, clothing, and shelter) tends to plummet relative to the price of most labor-intensive services (e.g., health, education, and daycare). This, in and of itself, is likely to motivate substantial changes in how households allocate their consumption expenditures nationally.
These sorts of relative price changes are unlikely to work out the same way regionally. Some regions may have particularly high-income because of oil production, financial services, or some other particular sector; however, their productivity, prices, and prevailing wages in most other sectors do not necessarily align well with nations, not even of the same apparent real income. The cost of food, for example, is likely as similar across regions and that faced by households of different incomes. However, we can still observe significant decreases in food shares across constant income levels (the same food expenditure share goes much, much further).

Perhaps most importantly, these causally identified estimates are very much in the same ballpark as traditional OLS-style estimates of regional income effects. For example, while the central estimate derived from the famous oil shock study found local income effects of 0.72 (+/- SE of .21), the OLS estimates aren’t appreciably different.

Indeed, that credible causal (IV) estimates are indistinguishable from more conventional estimates (e.g., OLS) at comparable units of observation (regional) should give us more confidence that the income signal we detect with more straightforward techniques is not being severely confounded by lurking variables that we’re not controlling for. If there’s no evidence of significant confounding regionally, this might give us more confidence that the national estimates aren’t severely confounded either (particularly if obvious theorized confounds like age structure or disease burden, not to mention proxies for this like office visits, inpatient discharges, and bed-days, fail to correlate significantly with income levels nationally, which actually does robustly predict spending).
The rising health share explained by rising quantities per capita (not prices!)
Well-measured, broadly representative health care prices have increased less quickly than GDP per capita and other broad income measures according to reliable domestic price measures, namely, the BEA’s PCE health care price index and CMS’s PHC price index.

This may come as a surprise to people familiar with charts like those popularized by Mark Perry of AEI.

These charts use BLS’s CPI health price indexes, which imply substantially more inflation. However, these indexes are not designed for this purpose, and they are not deemed to be reliable indicators of overall healthcare prices.2. Nominal incomes also nearly doubled in this period, so even if we take the CPI medical services component as a decent indicator of overall health prices3, the rising health share cannot be explained as primarily a price-driven phenomenon (particularly with newer, preferred CPI chain-price indexes).
If we want to assess the degree to which prices contribute to the rise in health spending relative to income, we should assess prices relative to income. Nominal rates of health inflation are difficult to interpret and compare without reference to income levels because much inflation is a monetary phenomenon and because some sectors are inherently more subject to productivity growth than others. Baumol’s effect implies we should expect real prices to rise unless productivity growth exceeds the rate of growth in prevailing wages in the sector (which correlates with rising overall income levels). However, none of this implies we should expect health prices to rise faster than income. As Scott Alexander framed it:
“The Baumol effect cannot make things genuinely less affordable for society, because society is more productive and can afford more stuff.”
That reliable health care prices have truly failed to keep pace with income growth suggests some combination of genuine productivity gains, slower than average compensation growth, or slower growth in operating surplus (profits) in healthcare.

America spends much more because it consumes much more
While real prices for health care are higher in rich countries4, the price of healthcare does not rise as quickly as average incomes. We can see this by comparing relative prices in each country5 as it relates to their real income levels. Relative prices give us a reasonable sense of the opportunity cost to consume a comparable amount of healthcare spatially6, which we can then compare to real income levels7.

Comparable results are obtained with GDP as the reference.
This data shows us that the relative price of healthcare rises with real income levels. In lower-income countries, the same bundle of healthcare costs significantly less in real terms.8. However, real incomes are also much lower in lower-income countries. Relative to the resources available to the average resident of those countries, it’s not necessarily any cheaper. Indeed, the statistical evidence suggests health prices fall in relation to income as real incomes rise.9
As real incomes rise, the relative price of goods falls while the relative price of services increases. This is likely a consequence rich countries increasing productivity in goods substantially more rapidly than that of services10. Alternatively, high-income countries can use their higher real purchasing power to buy tradable goods from countries with lower real labor costs.

Because “services” tend to be driven by domestic labor costs and because their productivity growth typically is not as rapid, the real quantity of services consumed is somewhat less than adjustment for overall price levels (PPPs) for GDP or AIC would suggest. Nonetheless, the reliable price indexes make clear that rich countries consume much more healthcare in real terms, and the United States is no exception to the rule,


The claim that US health care prices are inexplicably high was never well-evidenced!
Save perhaps for comparisons of pharmaceutical prices11, the prices typically proffered to compare the general price level of health care across countries are not up to the task. Such comparisons are non-trivial because countries rely on different schemes to provide care, to pay for care, and provide different types of care for roughly similar conditions.12 Substantial time and attention must be paid to these issues to obtain measurement invariant prices. Clearly, this is best done with the cooperation of national health authorities to ensure the types of prices are sufficiently representative and properly weighted.
The prices produced by the OECD’s recent health PPP benchmarks13 are probably the only methodologically credible price estimates. Their estimates (output) also appear to be quite credible. Unfortunately, their work has only rarely been cited to date. Instead, what we find are a large number of citations to prices published by an otherwise little known payer trade group, International Federation of Health Plans (IFHP), whose work on this topic14 has seemingly appeared whenever healthcare reform on the table politically. Surprisingly, their work has been accepted by many uncritically.15 Though their methods and data sources are insufficiently transparent, the details they do provide makes it quite apparent that their data cannot be relied upon.
Besides the critical identifiable methodological problems, their prices for surgical procedures, probably their most cited price category, are not credible. For example, while OECD hospital services price estimates (inpatient procedures) are strongly associated with income levels, with real prices rising at least as rapidly as real incomes, none of the “median” prices IFHP reports are even positively correlated with income levels.
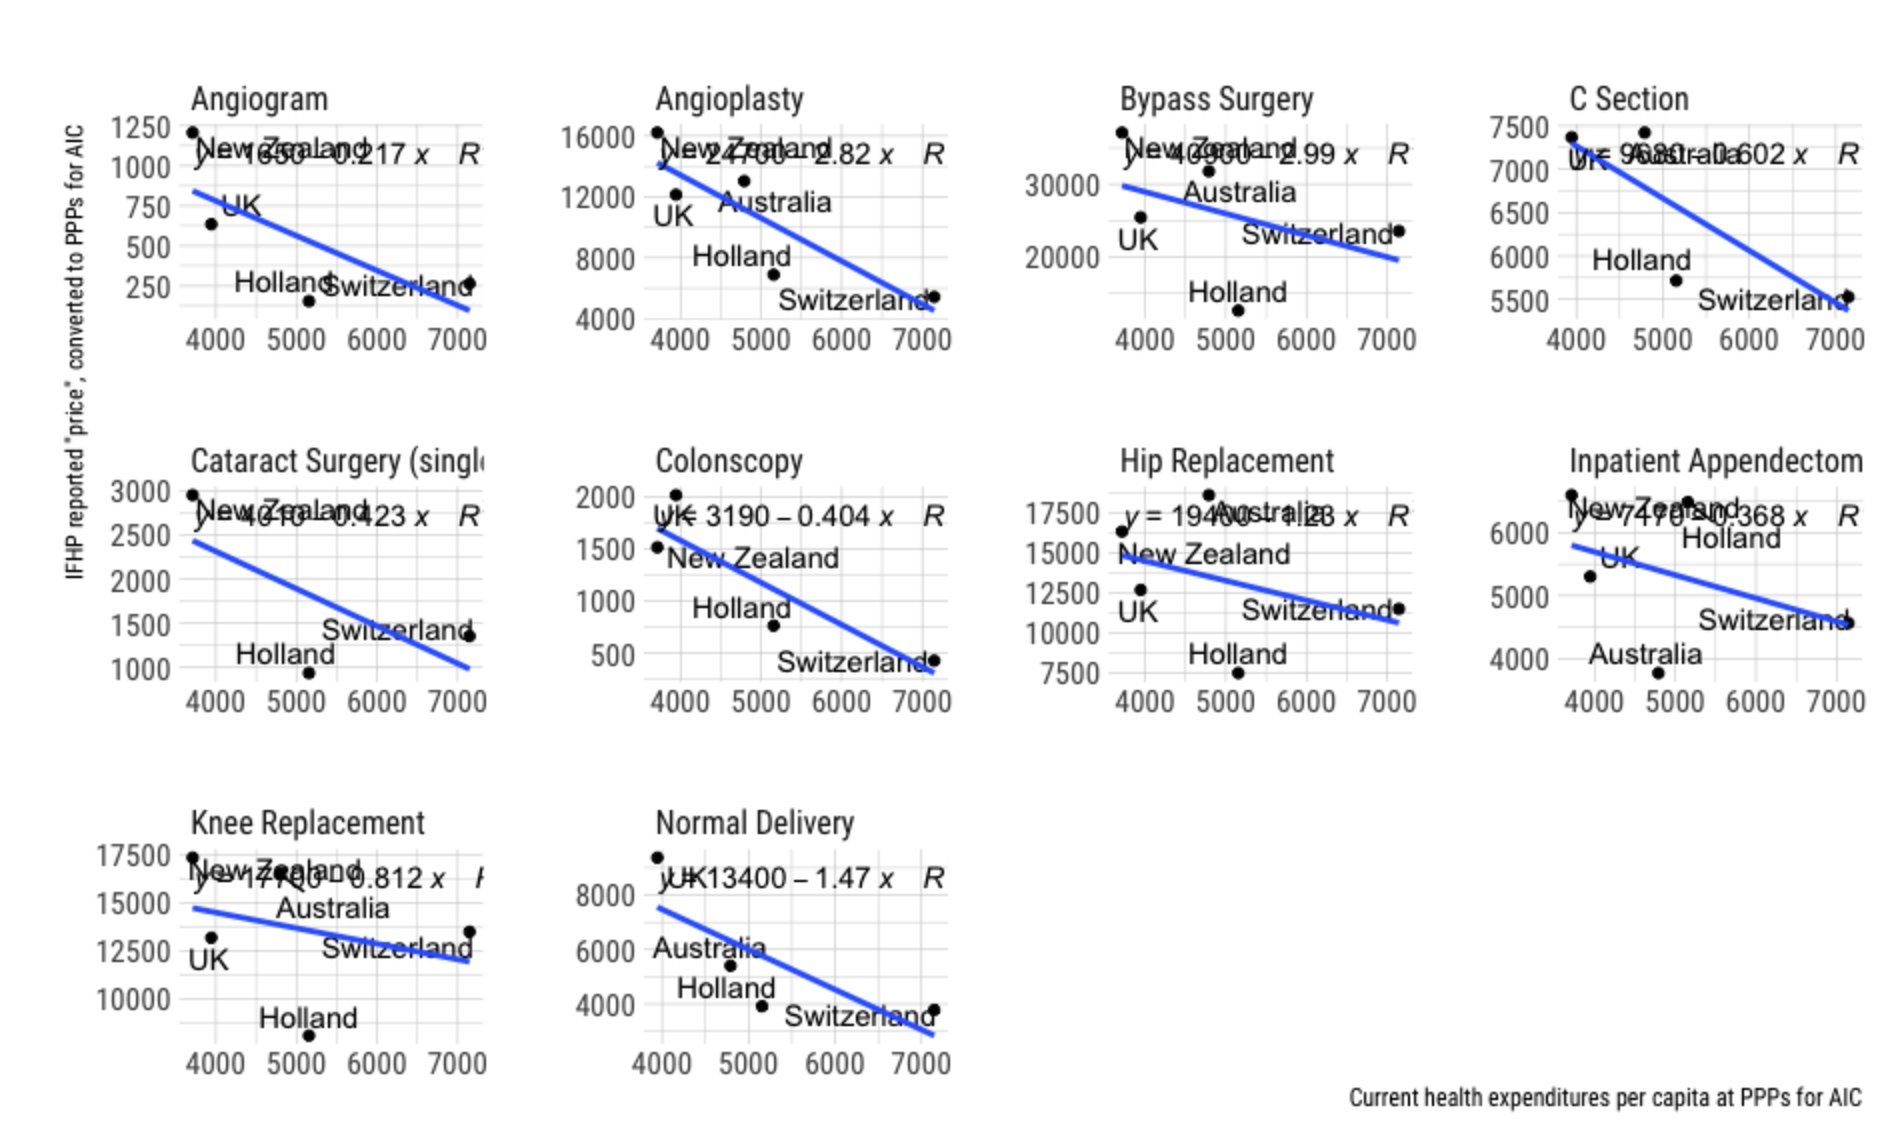
That we are unable to detect the signal in IFHP’s data, which more robust price methodologies and theory tell us to expect, should be concerning. This goes doubly when the price-income slope is in the wrong direction for every single procedure.16 By contrast, when we look at price estimates for specific procedures in the associated working papers, we can easily see that prices for inpatient procedures are robustly correlated with income levels and that the prices rise roughly the same rate as income on average.

The cost savings of Ambulatory Surgery Centers are real but do not prove as much as many believe.
Russ Roberts of EconTalk recently had the founder of the Surgery Center of Oklahoma on his show, wherein the guest touted the cost savings of his business. I am a fan of the show, and I support these sorts of developments, but since some people have taken this as proof that American hospitals are uniquely broken, I’d like to push back on this a little and put it in context.
Note: This is long, and it’s a bit of a tangent, so I’ve put it in a collapsible dialog to save those not interested from needing to scroll.
Expand for a long explanationFirst, the Surgery Center of Oklahoma is one of many Ambulatory Surgery Centers (ASC). Insofar as I can tell, their business plan and their prices are equivalent to most others. The net prices of ASCs are clearly substantially lower in general17. It is also quite common for them to prominently publish their prices.
Second, ASCs have been around for several decades, and they are already quite firmly entrenched. There are about 9,300 of them in the United States today. To put this in perspective, there are more ASCs than hospitals in the United States today. According to an ASC trade group, they have captured roughly 50% of the market for the procedures they commonly perform.

As of 2010, approximately 47% of ambulatory surgical procedures were performed in ASCs (more amongst the privately insured).

In 2015, [ASCs] accounted for around 35% of surgeries, representing approximately 10% of surgical care revenue. On average, surgeries performed in ASCs cost 60% of what the same procedure would cost in the HOPD setting, as ASCs have lower overhead costs compared with hospitals and thus are reimbursed at a lower rate.
In other words, potential (theoretical) cost savings through price reduction are already significantly baked into the national health expenditure cake. This also suggests the system is not as averse to seeking out to change (lower-priced alternatives) as it might seem. Hospitals may not like it, but payers, physicians, and patients have obviously been quite happy to route around hospitals when it is appropriate.
Third, ASCs clearly save money primarily through specialization. They do this by focusing on a limited number of low-risk procedures, as-in less complicated, less-invasive procedures on relatively healthy patients that are highly likely to be able to walk out a few hours later. This allows them to be substantially more efficient than hospital outpatient departments (HOPDs).

This higher efficiency enables them to employ considerably less labor (which drives the bulk of healthcare costs). Even amongst ASCs, it seems the diversity of tasks and high contention for resources is at odds with their efficiency. Too much context switching is likely to kill productivity, as is excess contention for resources.

It is likely the rapid growth of ASCs is primarily a product of technological developments, particularly the emergence of minimally invasive procedures and, more generally, improved surgical practices that have radically reduced both the average length of surgery and rates of complications. It is surely no coincidence that there has been a substantial shift to ambulatory procedures (including HOPDs) and that those still performed on an inpatient basis are typically more invasive, riskier procedures, and patients with higher risks of serious complications.

That this wasn’t always a possibility and that costs have likely increased in hospitals as complexity has increased has undoubtedly helped create an environment where ASCs can carve out a large economically viable fraction of procedures and pass on significant savings to payers and patients. The shift from inpatient to HOPDs to ASCs is part of a continuum relating to technological change and cost pressures.

Fourth, hospitals clearly have much higher overhead costs18, much of which is likely hard for them to avoid due to inherent complexity, regulations, and pay-scale issues. Hospitals provide a much more extensive array of services to a more diverse population of patients. They must be prepared to deal with contingencies and even expected events like overnight stays, which ASCs definitionally do not. Hospital’s extensive use of shift-based staffing is a reflection of these realities, and it’s likely to result in higher costs, ceteris paribus. ASC specialization allows them to economize in ways that hospitals cannot.
Most of the ASC are small and lean, running out of retail offices with 2 or 3 operating rooms and the minimum number of staff necessary to safely complete the surgery and discharge the patient. This model likely works and even provides superior outcomes for most procedures ASCs have carved out thus far. Still, it’s likely unlikely to scale entirely to replace hospital-based inpatient procedures (especially given our political and legal environment)19
Five, the cost and complexity found in US hospitals is likely a significantly international phenomenon, increasingly so as countries get wealthier. We see evidence for this in the relative price for hospital services according to income.

OECD’s hospital services PPPs and associated quasi-prices primarily reflect the price of inpatient procedures. Still, it’s likely the relatively high overhead costs on the inpatient side of these organizations affect hospitals’ outpatient departments. If nothing else, the relative lack of specialization found in hospital outpatient departments limits their throughput.
The cross-sectional evidence for hospital staffing is also consistent with this view.
 The issue here is less about administrators per se than about the need for administration.20 The increase in hospital staff, especially in non-healthcare roles, suggests higher complexity of care within the hospitals’ collective organizational umbrellas.
We can also see some evidence for this in expenditures that flow through hospitals organizationally.21
 This includes inpatient, outpatient, day cases, and the (minimal) fraction of other functions provided by hospitals. The US likely does a substantially higher share within distinct outpatient departments, which likely helps boost overall hospital sector efficiency. Still, it’s also evident traditional inpatient settings no longer dominate hospital spending in many high-income countries.22
In short, the relatively higher cost of hospitals is likely to be substantially an outgrowth of the demand for more and more complicated services, which drive overhead costs higher. It is these costs that ultimately make hospitals relatively expensive places to do procedures. These issues are likely increasingly being faced in other countries, particularly per their income levels. Some of this can be mitigated by shifting these procedures outside hospitals (especially inpatient departments). Still, it’s very likely the United States ahead of the curve of finding lower costs ways to deliver care (more HOPDs and ASCs).23
Real health inputs (labor) increase rapidly with income levels
The density of health workers rises rapidly with incomes.
Health care also commands an increasingly large fraction of the workforce.

These Human Health Activities data are derived from SNA (National Accounts), as opposed to SHA (Health Accounts). These health activities are comprised entirely of hospitals and providers’ offices. It excludes things like pharmacies, insurance companies, drug and device manufacturers, and assorted middlemen.24. The vast majority of health expenditures flow to (through) these organizations and most of that which does go to meeting payroll within these same organizations:
“It is not surprising that employment growth should be a bellwether for rising health care expenditures because salaries and wages account for an average 55% of operating expenses for hospitals, physician offices, and outpatient care, and nearly 70% of hospital expenses”
Even Ezekiel Emanuel has recently seen a little light on this issue:
“Because health care is so labor-intensive, wages to workers are the real reason it costs so much. Wages explain why hospitals are so expensive: They are filled with workers.”
Ezekiel is not wrong on the fundamental domestic arithmetic: health spending and health employment are linked at the hip in the long run.

The health share of the workforce has increased about six-fold (!!!) since 1950.
We also find help health employment explains much between states (while prices explain very little).

The rapid increase in health employment argues quite strongly against several conventional narratives on the causes of high costs, and it lends further support to the notion that the rise is real (quantities per capita). Much the same goes for the United States relative to other high-income countries. Claims to the contrary, such as those from this highly influential famous paper, are at odds with the reliable price and quantity measures, and they are just plain wrong vis-a-vis inputs.
“Because the US is still not devoting more real resources to medical care than the typical OECD country, we believe that the conclusion that “it’s the prices, stupid” remains valid.”
All of our extra health workers must be doing something and, if nothing else, they sure as hell demand to get paid. The rapid increase in health employment dramatically reduces the scope for high wage rates, profits, value-add, and economic rent to explain much. Every dollar paid out by physicians’ offices and hospitals for staff, and intermediate goods is a dollar not going in the pockets of physicians, hospital executives, and other assorted boogeymen.
High overall wage rates and profit margins cannot explain much.
Many people have latched onto unreliable price estimates, along with a smattering of poorly characterized facts, to arrive at the notion that healthcare wages and profits are unusually high in the United States and that the cause of our increasing healthcare costs is somehow primarily attributable to increases in these figures. The implicit message is that the high-incomes earned by physicians, hospital executives, and other powerful actors drive spending and that we are going to be able to dramatically slash costs by reducing their income:
“Because of America’s high prices, there is a $3.5 trillion industry invested in the status quo. Cutting prices, whether through global budgets or price-setting or other rules, means cutting income for health care providers.”
Undergirding this is the notion that we are likely to get something for nothing: that we can spend much less while still getting at least the same quantity and quality of healthcare Americans have come to expect. This just isn’t plausible.
If anyone actually bothers to check, it’s readily apparent that average compensation in healthcare in unexceptional and that it has not increased for decades.25

Average compensation may have increased decades ago, but this stopped around 1990. That increase can be attributed primarily to rising wages for nurses, who were initially poorly paid and whose training has increased relative to the population, along with increased nursing staffing ratios.26 similar changes likely played out in other countries for similar reasons.27
In any event, this average includes physicians, nurses, technicians, administrators, assistants, housekeepers, food services workers, and much, much more. The high and rising spending in this sector as a share in income clearly cannot be explained by high and rising compensation, but rather the high and rising density of these workers. Some of these occupational groups may earn relatively high-incomes (e.g., physicians), but then there must be many more earning relatively low-to-middling incomes.
Lest you believe the “profits” of providers’ offices and hospitals are what distinguish this sector, we can quickly dispense with this notion by comparing their profits to those other sectors.

Likewise, we can compare the net operating surplus (~=earnings) as a share of output (~=receipts) in human health activities (providers’ offices and hospitals) to that of other countries. 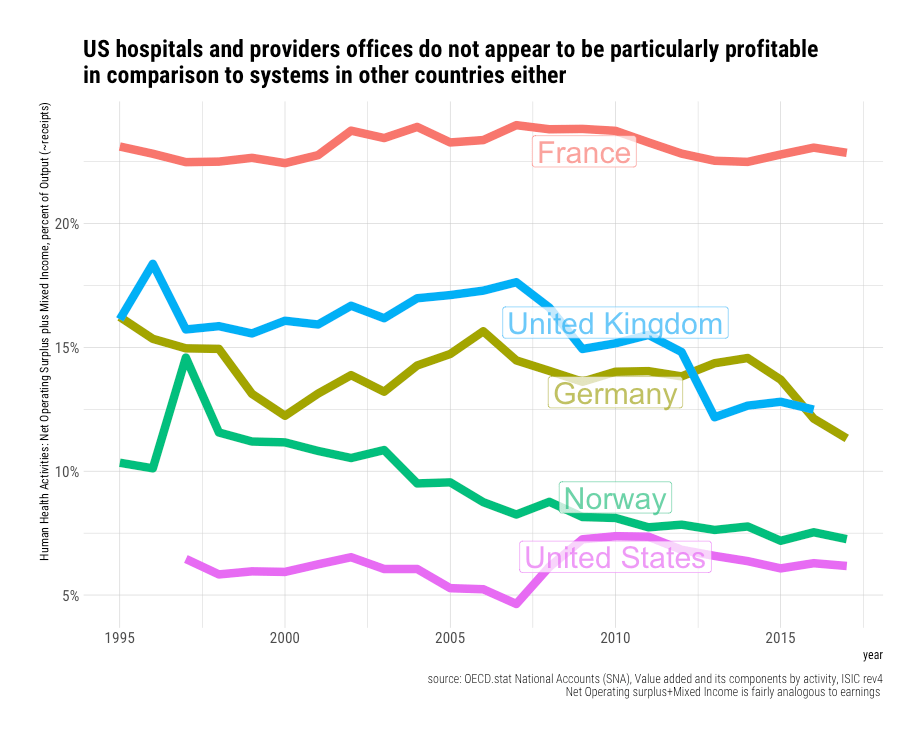
We can also compare their gross-value-added share.

This implies American health services compensation and profit share of receipts are actually somewhat below average.28 If US prices are (presumably) inexplicably high because providers were making out like bandits with exceptionally high margins, I’d expect to find some evidence of this in one or both indicators.
Similarly, null results are found when GVA is broken out on a per-worker basis (a proxy for real inputs).

Likewise, if we just focus on the labor compensation component.

You may also notice that the elasticity of GVA and CoE per health activities worker is substantially less than one, which implies that rising income per health services worker cannot arithmetically explain the observed health increase in health spending. That is, real incomes are rising faster than the rate at which we are increasing the real incomes of physicians’ offices and hospitals on a per head basis.29
Again, health spending is rising in the United States, as in other rich countries, because we are putting a lot more real resources into healthcare as real incomes rise, both as a share of the population and as a share of total employment. If we simply divide the oft-cited health spending statistic by total employment amongst hospitals and providers’ offices, it’s readily apparent their employment growth explains much.

This numerator (SHA current health expenditures) includes retail pharmaceuticals, medical devices, insurance/administration, and much more, whereas the denominator just reflects people that work directly in hospitals and providers’ offices. Real incomes are rising faster than real expenditures per employee in cross-section, ergo the denominator (health services workers) must be growing significantly more rapidly than overall health spending. This is a good indication the observed excess cost growth is unlikely to be explained by the combined increases in wage rates, profit margins, health insurance, drugs, devices, and the like over and above general economic growth. All of these extra workers in hospitals and providers’ offices demand to get paid at rates that approximately reflect the prevailing real wage in each country.
America is distinguished primarily by the sheer quantity of resources it puts into healthcare.30

Physician take-home pay explains even less
Few would dispute the total earned income of physicians is high relative to the average worker, much of which follows from their relatively higher skills, education, training, and responsibilities.
Most importantly, for comparative purposes, their relative income has long been high in the United States and other developed countries. To appreciably explain the relative increase in health spending31, relative physician incomes must have grown tremendously, and they must be much higher than presumably “comparable” countries. The best available evidence suggests physician incomes have not increased appreciably in relative terms.32

There is not much sign of a trend here, and the increase is really quite modest (especially given likely compositional changes within and between specialties)33 These data are generally consistent with most other reasonably credible data sources.34
It’s also worth noting that there appears to be even less evidence of change when physicians are compared to the 90th percentile of all workers in the United States.

To the extent the modest apparent change is a product of broader macro-economic forces driving inequality higher, such as skills-based technological change or globalization, it indicates (1) the cause lies outside of health policy and (2) there are likely to be some offsetting effects vis-a-vis relatively cheaper wages elsewhere within healthcare.35
Physicians, particularly specialists, earn multiples of the average wage in most high-income countries.

These multiples are not too far away from multiples reported for the United States in 2003 for self-employed specialists (5.5x) and self-employed GPs (3.4x).36 This puts the estimated relative wage of American physicians within 20-30 percentage points of many high-income countries (less than some), and there are good reasons to believe the lower multiples reported for some countries are significant under-estimates37. Given that physicians account for roughly 5% of the health services employment in the United States and their total take-home pay perhaps eight-to-ten of percent of health spending, such differences simply cannot explain more than a tiny fraction of aggregate costs or relative prices.
When viewed from the perspective of the national income distribution, these differences appear to be even less impressive.

When it comes to the viability of pay-setting practices, and the associated tradeoffs, relative wages of this sort are apt to be much more instructive than absolute comparisons.38
Regardless, differences in the national wage dispersion and returns to skill are likely to cut both ways: relatively higher wages for physicians are likely offset by relatively lower wages elsewhere within healthcare. There is no fundamental reason why relatively high wages for physicians mean price-to-income ratios must be higher than other countries as health prices are ultimately determined by much more than the cost of this one category of input.39
The composition of the American health workforce is consistent with trends observed elsewhere.
While the density of physicians in America increased significantly over the past several decades, it’s likely much of this was due to technological changes within health care as opposed to independent income effects.40 When we look cross-sectionally, it’s quite evident that physician density is highly idiosyncratic. There is not an obvious statistically significant relationship between physician density and income levels or health spending.
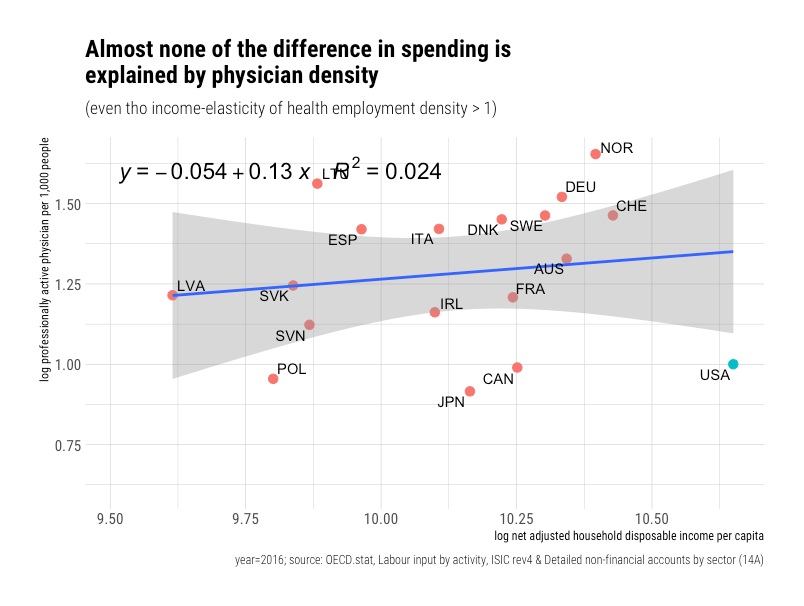
Part of this may be due to differences in scope of practice laws and productivity. For example, it seems the United States has long had significantly more nurse practitioners in primary care roles. What is clear, however, is that the physician share of the health workforce tends to decline rapidly with income levels.

Put simply, non-physician occupational categories have clearly risen much, much more rapidly in the United States and other high-income countries. This hiring seems to be primarily through occupational categories such as nurses, personal care workers, physiotherapists, and others.41
Since hospital staffing (administration) has received much attention in America, it’s notable that the density of non-healthcare hospital staff rises sharply with income levels.42
People assume the growth in “administrators” is a uniquely American problem. Still, it’s very likely to be explained by inherent increases in complexity of healthcare, which is ultimately determined by income levels, and to a lesser degree, by definitional issues.43
Commonly proffered utilization indicators do not show what people believe.
Even if one wants to summarily dismiss all of the other reliable evidence concerning the United States44, it makes no sense to use a handful of utilization measures (proxies for overall volume) of unknown validity to argue prices must be inexplicably high simply because these indicators are not as high as we would implicitly expect given what we are spending on healthcare. There must at least be a compelling relationship with health spending and a significant residual for the United States for this to count as meaningful evidence.
One should not just assume a 1:1 relationship exists for any and all indicators. If there is no apparent relationship, and if America is reasonably close to the trend (or lack thereof), there can be no meaningful residual to explain vis-a-vis implicit quantities. Even when there are unambiguous statistically significant relationships, the US residuals must be substantial and in the “wrong” direction (typically lower volumes) for this to rise to the level of compelling evidence. These data genuinely do not make their case.
To take a recent widely cited, representative example45:
“Similar to previous work by Garber and Skinner, Reinhardt et al, and Anderson et al, that examined US health care spending relative to other OECD countries, we found that the United States spent significantly more on health care despite having similar levels of utilization“

The problem with this particular analysis is that observed US behavior in these utilization indicators are mostly very consistent with its spending levels. America’s position is directly proportional to the direction of the relationship and the strength of the relationship between the indicator and health spending.
The US is unexceptional in those indicators that are not robustly correlated with higher health spending.

Conversely, when we look at indicators where America skews high, these are precisely the sorts of things high-income, high-spending countries like the United States do relatively more of. Indeed, a fuller accounting of the procedures would likely push the United States somewhat higher still.46 Although there is some idiosyncratic variation, and the US is sometimes slightly below trend, the United States is not the outlier they need to make this argument47. There are no smoking guns to be had here.

FYI-Even though America’s rank in angioplasty (PCI) procedures is not notably low here, this picture would have looked quite a bit different just a few years before (new clinical evidence changed behavior)48
The results for the comparable data indicate the United States also performs at least as many cataract procedures as its health spending would predict.49
Cataract procedures

Cesarean section procedures
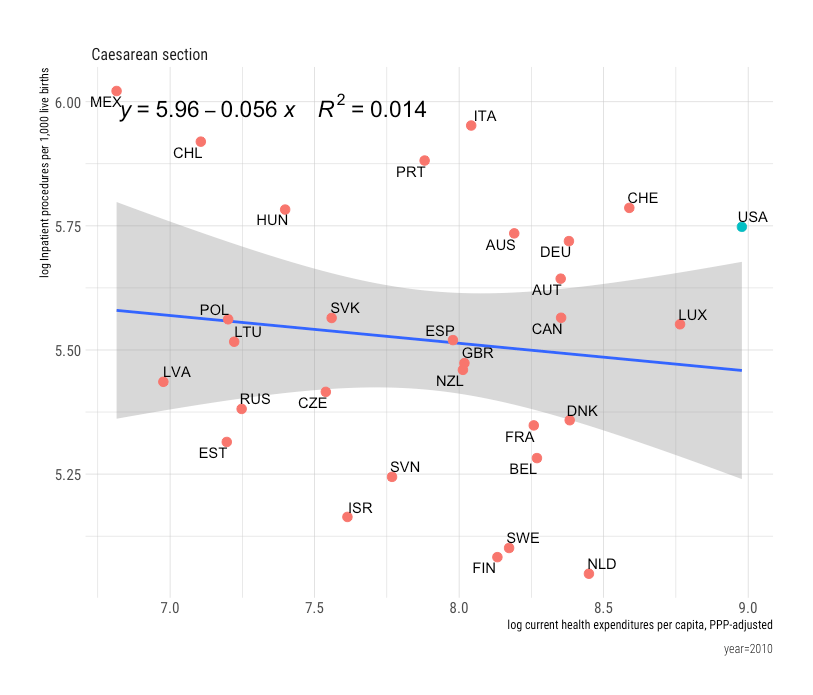
Of the procedures listed, only hysterectomy shows any signs of a potentially significant residual away from that which would be (weakly) predicted by health spending, but this is likely explained by evolving preferences and technological change (ambulatory procedures in particular)

Higher-income, higher-spending countries are, if anything, associated with shorter hospital stays and are clearly trending towards shorter stays in the long run!

Presumably, the United States inexplicably uses vastly more imaging technology than other developed countries, but mostly these track with income and spending levels.
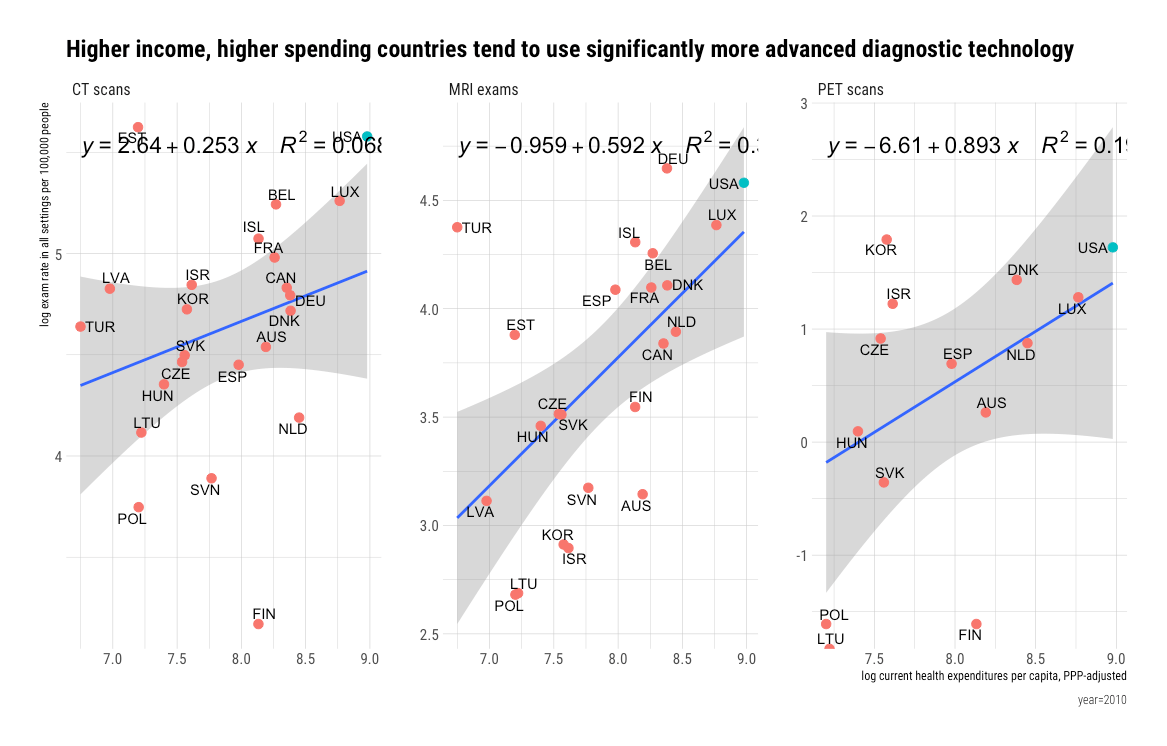
In short, none of the selected “utilization” indicators published by Papanicolas et al. make a compelling case that the United States does appreciably less than that would be predicted by its level of expenditure.
 Indeed, there is a decent case to be made that US utilization is, on balance, consistent with even more developed healthcare systems.50
If we look at some other oft-cited indicators, which Papanicolas et al. also cite, we find similarly weak relationships. For example, office visits just don’t correlate significantly.51
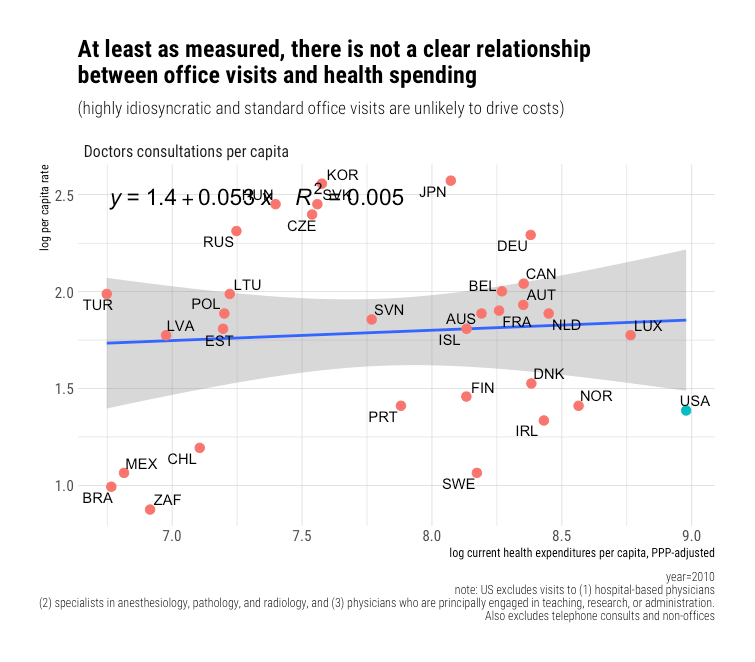
Likewise, hospital discharge rates (all causes) don’t obviously correlate with spending either.

This should not be entirely surprising for the United States, at least since hospital revenues and procedures have been shifting rapidly to outpatient settings for many years.

For many categories of procedures and treatments, due to the rise of minimally-invasive technology and other factors, inpatient admittance has ceased to be a reliable proxy for health system activity. This wasn’t always the case. For example, if we revisit the same indicators the paper above cited for 1996, we find results consistent with high-income elasticity52 whereas fourteen years later, there is barely any slope to be found, and the variance explained is trivial.

 The problem with this whole enterprise is that the constant change in the technological frontier is likely to badly confound attempts to infer the volume of health system activity from observed utilization rates from lagging (obsolete) indicators of technological progress. Demand for specific technology is finite, relative prices fall, and real incomes rise. Consequently, observed utilization in lower-income countries rises while it stalls in rich countries. By the time these indicators are published by international authorities, and “recent” snapshots of them are cited, wealth (health spending) has often ceased to be a significant determinant of the variance.53
We can see this pattern unfolding with MRI exams in OECD panel data.
 Extensive use of MRIs in healthcare is a relatively recent development, but it is still likely we won’t find much of an income or health spending signal here in a few more years.
Better technological indicators are required to fully capture rising volumes through proxy measures
Technological change is fundamental because these innovations drive costs even when we have trouble identifying them in the available cross-sectional evidence. Yes, income is the ultimate (distal) cause of health spending, and itself explains almost everything, in the long run. Still, the primary proximate cause of excess spending growth is the adoption of technological change.54
I am hardly alone in emphasizing technological change. Most health economists have too. Even when these economists’ conceptual models explicitly treat income, insurance, relative medical price inflation, and more as independent variables for explaining the growth in real health spending, they attribute the majority of spending growth to technological change.55

Most of the indicators published by OECD and others reflect fairly old technological developments, but there are a handful of indicators here.
For example, we can compare surgical transplant rates.


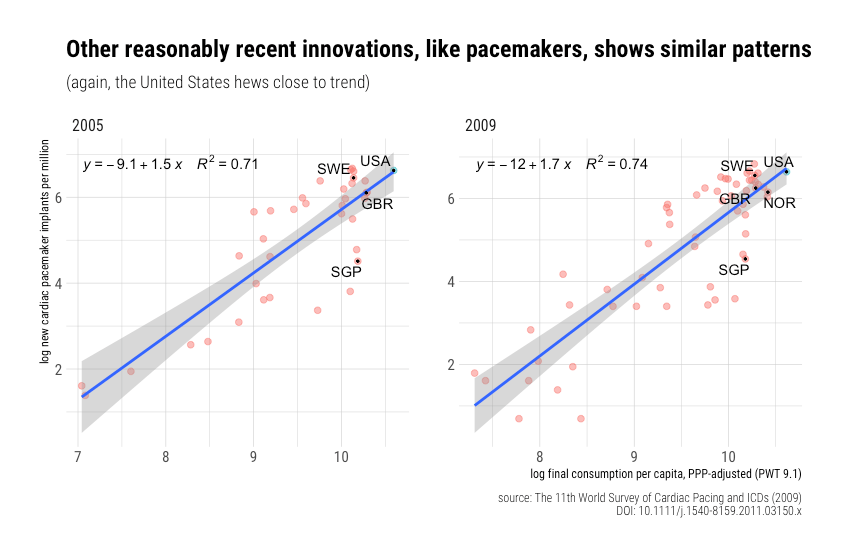
Likewise, similar results out found for pacemakers.
Likewise for Implantable Cardioverter-Defibrillators (ICDs)

And a variety of fairly expensive medical equipment (imaging/diagnostics):

And insulin infusion pump therapy penetration amongst type I diabetics.
“Although Western Europe has been well covered by reimbursement for many/several years, including close to or more than 10 years in some countries, it is noticeable that (1) the higher users are still behind the United States and (2) some significant heterogeneity remains about pump penetration among the various countries.”

For reference, pump therapy rates in the United States have clearly been substantially higher for longer.
Likewise for ADHD prescriptions (standard units)
 There are certainly more data of this sort out there if one cares to look.
Please note that all of these indicators indicate quantity and that the observed income elasticity of demand is very high. As in, a 1% increase in real household income levels (or at least reasonable proxies for it) is often associated with a 1.5-3% increase in the adoption of relatively novel technology. If you further appreciate that these indicators tend to come with at least corresponding increases in labor to deliver this care56 and that these new workers tend to demand wages that approximate the prevailing national wage (Baumol’s effect), it shouldn’t be too difficult to understand how the adoption of this sort of health technology can drive aggregate cost growth.57
While it’s clear there are some idiosyncratic factors and that there is some role for particular reimbursement policies insofar as precisely what gets reimbursed, under what conditions, and how quickly58, it’s nonetheless true that income is the major determinant in the long run. Lower-income, lower-spending countries may occasionally show idiosyncratically high usage and high-income countries low usage, but they rarely do so consistently across categories. At moderately high levels of aggregation, idiosyncratic differences are apt to get averaged out to closely reflect health spending and (ultimately) income levels.
Beware of false profits (intensity is distinct from price)
Several high profile researchers and advocates have advanced the notion that “prices” explain the increase in spending by estimating the average cost per health system encounter. Typically they call this something like “service price and intensity” in their research papers, but then take calling it “price” when communicating with the public.

Disaggregating the data in this fashion (amongst others) might be analytically useful in some circumstances, but it is not an indicator of price, and it’s very misleading to imply otherwise. It is particularly misleading when the reliable price indexes have failed to find a genuine price signal anywhere near this magnitude, and more detailed studies of similar nature clearly show that what they label “price and intensity” is explained by the intensity component.
When the data of this sort are disaggregated even further, it’s self-evident that (1) hospitals and ambulatory care providers are doing substantially more per encounter, and (2) it is poorly explained by factors like aging and rising disease burdens. The data also typically suggest people are not visiting the doctor that much more often. The data implies the rising health share of income has approximately nothing do with aging, disease burden, increasing propensity to seek care, or prices (over and above income growth). Instead, the data suggest that when people do seek care, much more is apt to be done on their behalf.
All of this is very consistent with the increasing adoption of technological improvements as income levels rise. People are more likely to get diagnosed and treated as average income increases in the long-run, ceteris paribus, and this doesn’t necessarily correlate meaningfully with the rate of encounters.59 To put this in more concrete terms, this primarily plays out through technological changes that allow for better diagnosis and better treatments. In the short run, when viewing granular time series, these changes might appear to be marked by discrete changes as genuine technological innovations in any single area are rarely perfectly continuous, and payer reimbursement policies can change behavior quite suddenly in response to pent up demand. However, when these technological changes aggregated, these stepping issues are bound to dissolve into fairly continuous changes in real expenditure that are converging on some equilibrium, one primarily determined by average income in the long run.
Income predicts cross-sectional spending because it predicts intensity
That intensity rises sharply with income levels should be reasonably self-evident because (1) we know that income levels are exceptionally linked to health expenditures, both in cross-section and time-series, and (2) there’s no good reason to believe higher-income countries are systematically much older, sicker, or much more likely to seek care. If we actually check the data, we find richer, higher spending countries just are not more likely to visit the doctor, be admitted to hospital (inpatient), or even spend more bed-days in the hospital. Nor are they appreciably older, suffering from much higher rates of diabetes, etcetera, etcetera. We also know health prices are not rising faster than income in the US time series and in international cross-section. Still, health spending clearly rises sharply with real income levels.
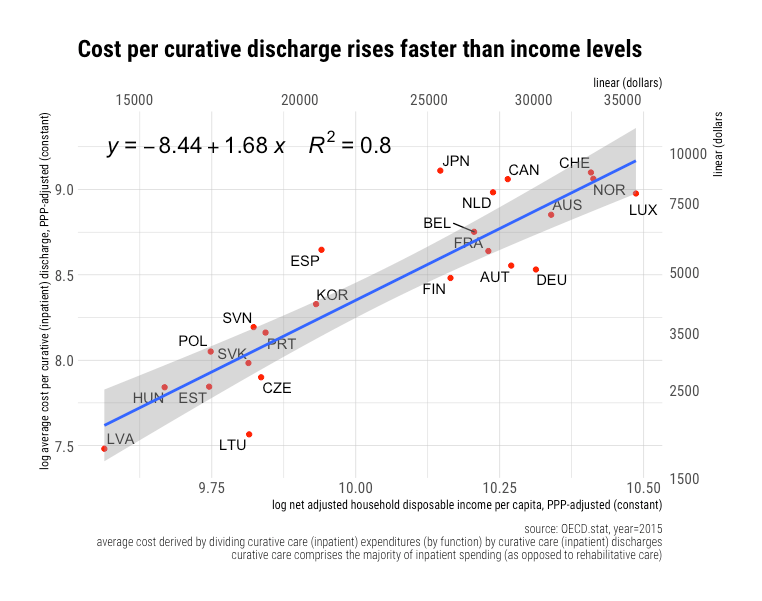
If we approach the international data from the perspective of cost per encounter, as others have done for the US to argue “prices,” we can clearly see that “price and intensity” rises very rapidly with income. For example, we can compare the average cost per inpatient discharge with income levels.
 Comparable results are obtained for the somewhat narrower curative care subset of inpatient activity (excludes rehabilitative care).
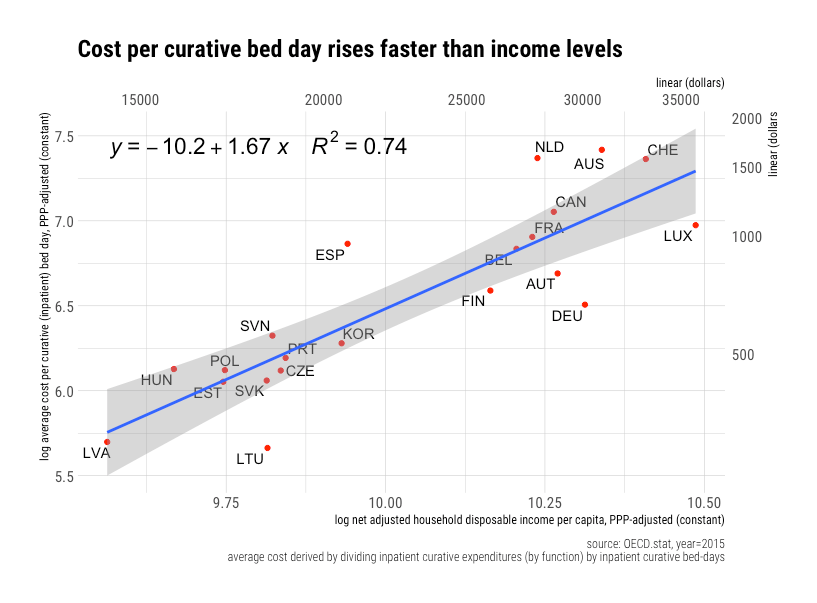
 The results for cost per bed-day are comparable — factoring in length-of-stay doesn’t appreciably change these conclusions.
Given that we know for reasonably certain that the price of hospital services is not rising appreciably faster than income, it’s highly likely costs increase above unity (elasticity > 1) can be attributed to intensity rising with income. This is consistent with other lines of evidence on technological change and rising real inputs (worker density) in hospitals and health care writ large. Mostly, much more is being done per hospital inpatient encounter in wealthier countries.60
If we look at the best available data that also includes the United States, it also fits quite nicely on the trend.
 Costs likely rise because hospitals in more prosperous countries can and do so much more vis-a-vis cutting edge medical technology (procedures, diagnostics, pharmaceuticals, etc.). Further, as hospital costs rise and as technology gets better, a substantial share of procedures get shifted to ambulatory settings, as in, hospital outpatient departments and alternative ambulatory surgery settings (e.g., ASCs), which moves the composition of hospital inpatient care to more complex cases that require invasive procedures and higher overhead.
Comparable results are obtained for average costs in ambulatory and comparable encounters outside inpatient settings.61
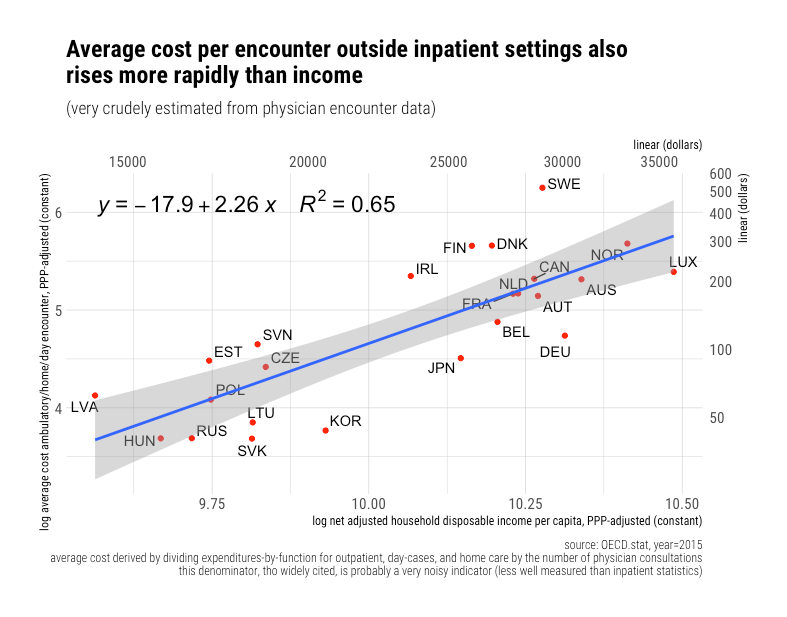
Though the apparent slope (elasticity) likely reflects an underlying truth vis-a-vis costs rising rapidly with technological change (intensity of care), it’s probably less interpretable than the inpatient estimates because the underlying data aren’t as good and numerator and denominator aren’t necessarily quite as well matched. In high-income countries, the cost of these encounters (the numerator) is likely to heavily entail ambulatory surgical procedures, therapies, advanced diagnostics, and much, much more62.
The high health expenditures observed in high-income countries simply can’t be explained based on the frequency of contact with the healthcare system (especially traditional office visits). The average costs per encounter are clearly rising much more rapidly than incomes even though the reliable price evidence does not suggest excess price growth of this nature.
Rising productivity has consequences (“we ain’t gonna starve”)
The technological-led excess cost growth in health care means that other expenditure categories must fall as a proportion of consumption. A surprising number of people have taken this to mean that health care will eat our entire economy and that we will “starve.” These concerns are surely misplaced as these technological changes, and associated excess cost growth is very much linked to real income growth in the long run, and this growth is clearly not unchecked. The rate of excess cost growth and its relationship to income (ultimately productivity) growth matters
Because productivity is increasing and because excess cost growth eventually follows from this, it’s entirely possible to spend an ever-larger share of income on health without reducing our real consumption elsewhere. Indeed, the apparent rate of real income growth paints a considerably more pessimistic view of the fundamental necessities of life because prices also move relative to each other (which ultimately follows mostly from productivity). As the share of health, education, daycare, and other labor-intensive categories rise, the apparent rate of income growth seems to decline as these areas routinely show much less than average productivity growth, hence price indexes are increasingly weighted towards them. The flip side of this, however, is that the measured productivity growth and price-to-income ratios outside of these few labor-intensive categories are much, much more favorable than would be implied by the apparent average real income growth. Most prices have fallen exceptionally rapidly relative to average income levels within our lifetime.

With the same fraction of average income, we can buy much more of the basic necessities of life. This has consequences for how households choose to allocate their consumption expenditures. This can be clearly seen in the long-run in the share of consumption expenditures allocated to groceries.

The typical American household is much better fed today than in prior generations despite spending a much smaller share of their income on groceries and working fewer hours. I submit this is primarily a direct result of productivity. We can produce food so much more efficiently that we don’t need to prioritize it as we once did. The food productivity dividend, as it were, has been and is being spent on higher-order wants and needs like cutting edge healthcare, higher amenity education, and leisure activities.
Similar patterns have doubtless been playing out in other essential consumption categories.

Because the price-to-income ratios are falling so much more rapidly than the health-expenditure-to-income ratios are rising, potential consumption63 has clearly been trending steadily upwards across the vast majority of expenditure categories.
 The actual quantities per capita have trended steadily upwards too, although the precise slopes vary some (partially determined by demand).64 So long as the relationship between these ratios don’t fundamentally change this trend can continue on without bending towards metaphorical “starvation.” Indeed, these trends indicate that the rising health share is robustly linked with a generally constant long-term of increasing in real consumption across essentially all other major consumption categories.
Comparable patterns are found with PPP benchmarks in international (OECD) cross-section vis-a-vis potential consumption per capita and health share of income. (You may also observe that the United States, the blue point, has much higher potential consumption after adjustment for purchasing power and that it’s generally very close to trend)
 Comparable patterns for potential consumption are observed in virtually all of the more granular categories (save, perhaps, education). Reliable price indexes (PPPs) indeed indicate that rich countries can continue spending larger shares of their income on healthcare and still consume much more of virtually everything else in real terms. While the particular slopes may vary, the quantity per capita indexes are much compatible with this observation.
 (likewise in more granular data)
Allocating larger shares of income to cutting edge healthcare clearly comes with tradeoffs, and it’s likely subject to rapidly diminishing returns. Still, there is no fundamental reason why the current trends are inherently unsustainable. Whether people believe this ever more technology-intensive, labor-heavy healthcare is genuinely valuable or feel they need to “show care” for other members of society, it shouldn’t be difficult to understand how real increases in average income can cause even more rapid increases health care spending.
The contribution of real national income and the associated differences in price levels between categories of consumption is likely significantly underestimated. Besides the role of other known factors within developed countries65, which likely diminish the role of individual and regional income are a determinant of spending, the very fact that income at sub-national units of observation are unlikely to correspond to systematic differences in relative prices on nearly the same order is likely to be a significant partial explanation.
Diminishing returns to spending and worse lifestyle factors explain America’s mediocre health outcomes
America’s mediocre health outcomes can be explained by rapidly diminishing returns to spending and behavioral (lifestyle) risk factors, especially obesity, car accidents, homicide, and (most recently) drug overdose deaths. [Please read this post for the full explanation]
The diminishing returns are evident in cross-sectional analysis. Higher-income countries like Norway and Luxembourg spend twice as much as the likes of Spain and Italy and probably experience worse average outcomes.

Diminishing returns are also evident if we compare trends for countries within the OECD. Countries that were initially closer to the health frontier have seen much slower gains in life expectancy. Whereas life expectancy in Korea increased nearly 20 years, it increased by just 5 years in Sweden in this same period — these things clearly track robustly with the initial state of healthcare as indicated by initial health spending.

Likewise, the least developed parts of the world have converged rapidly on the most developed countries despite little-to-no convergence in income levels, health spending, and the like. Controlling for the change in health spending does not appreciably change these results. The supposedly radically divergent slope observed for the United States in widely circulated plots popularized by “Our World In Data” can be readily explained by distance from the frontier and the change in spending. America’s long-run rate of improvement in outcomes can be readily predicted based on patterns observed in other high-income countries — the US doesn’t even need to be included in the model to obtain such results.
This really just leaves the intercept to be explained. America has never compared favorably conditional on income or health spending — it’s long been about two years below expected life expectancy. As some less developed OECD countries have closed substantial ground in high-efficacy medicine and essential public health measures, they have been able to converge on the outcomes of higher-income countries and even surpass many since they are less encumbered by many of these same lifestyle factors. Cutting edge medicine, like recent advances in cancer therapy and heart procedures, simply don’t have sufficiently large effects on nation-wide indicators of health outcomes (e.g., life expectancy at birth).
America, meanwhile, has long suffered from much worse behavioral and lifestyle risk factors. Obesity, homicides, and car accidents have long separated the United States from most other high-income countries. Differences of this sort may be trivial in comparison to the much more significant issues faced by most developing countries, but amongst developed countries, they loom very large indeed. Obesity alone sharply distinguishes America from its high-income counterparts and probably explains about half the gap. Substantially larger fractions of our population are suffering from extreme forms of morbid obesity, where the effects on mortality risk have been found to be unusually large.
 While it is true that BMI has increased in most countries, developed and otherwise, they’ve grown at least as quickly for the United States, which implies somewhat more significant effects on life expectancy gaps.
The effects of primarily idiosyncratic external causes of death, such as homicide, car accidents, and drug overdoses, are quite simple to calculate from the data. Research published by CDC affiliated researchers has shown that accounting for these directly (arithmetically) explain between 30 and 50% of the gap, depending on the gender and reference group countries. These estimates are also pretty close to those provided by IHME with somewhat different methods.

If we add the obesity (metabolic) risks together with the risks (causes) from homicide, car accidents, and drug abuse, there’s very little left to explain.

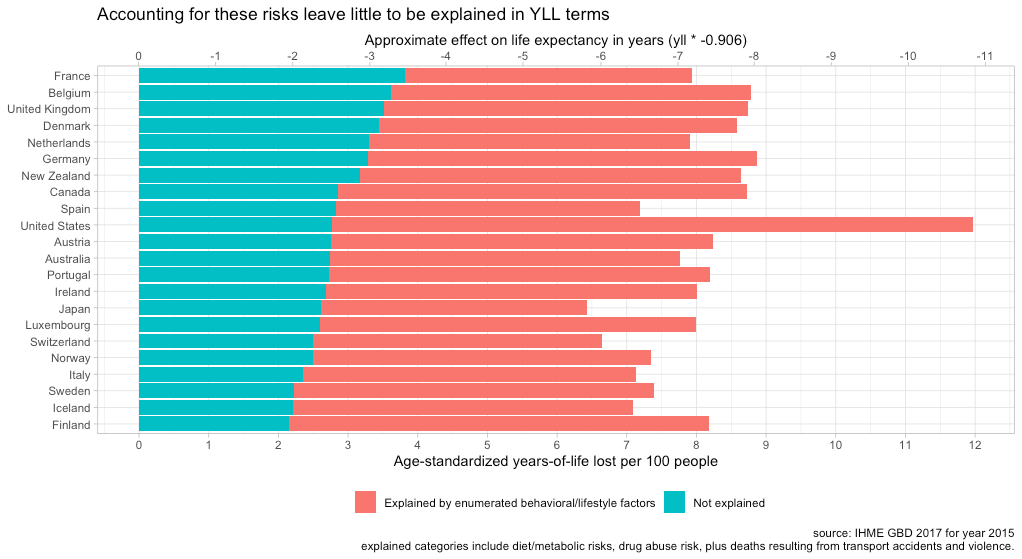
Comparable results are also obtained for individual US states. Those states that see reduced life expectancy are well explained by their much higher risk factors (which are unlikely to be significantly attributable to lack of health care provision).

The development of health care technology matters in the long-run, but not so much amongst developed countries since they’re all spending on high efficacy treatments and most of the marginal expenditures are going (increasingly) to cutting edge treatments that tend to have small effects on mortality. Some incremental spending in more cutting edge treatments for cancer, cardiovascular, metabolic, and other major categories of diseases may help the afflicted to some extent. Still, the fraction of people treated multiplied by plausible effect sizes implies this activity is not likely to visibly move the needle when we look at nation-wide measures like life expectancy at birth, especially not in comparison to some of the previously enumerated causes of mortality that (mostly) vary idiosyncratically between countries. Amongst developed countries, lifestyle is the 800-pound gorilla in the room.
Notes
(see below)
- Their dependent variable, hospital expenditures, may not be a perfect proxy for overall health spending, though it’s not an unreasonable choice.
- More technical issues aside, CPI-M only captures out-of-pocket spending, which reflects a small and falling fraction of health spending nationally (~10%). Indeed, the OOP share of GDP has declined despite rising health spending (it’s third party payment that has increased).
There’s no good reason to expect OOP “prices” to correlate meaningfully with trends in the overall price of healthcare, especially the prices paid by public and private payers. Indeed, given the rising gap between list prices (charges) and negotiated rates for hospitals/providers, with similar issues in pharmaceutical pricing, there’s plenty of reason to expect CPI-M and CPI hospital services price indexes to be uninterpretable as any kind of general indicator of health prices. It might indicate some issues insofar as prices faced by the uninsured or otherwise out-of-network transactions, but this clearly does not reflect the average prices paid. It’s even less likely to contain a useful signal for the other ~90% of health spending paid for by private and public health plans.
- That is, ignoring that it’s not designed for this and its tendency to substantially over-estimate apparent health inflation
- As predicted by Baumol’s effect
- This can be accomplished by dividing well-measured health prices (as in OECD’s health PPPs) by prices for a broad bundle of consumption.
- This simply gives us a reasonable indication for how much more (or less) of a broader basket of goods and services could be purchased within each country for a comparable basket of health goods and services.
- Or other indicators of material living conditions (e.g., Actual Individual Consumption).
- Setting aside potential unmeasured quality differences.
- This, however, does not mean that costs per encounter are lower relative to income. The standard of care (intensity) is very likely much higher as much more effort is put into healthcare in high-income countries. It may seem more “expensive,” to the extent people see the true costs of their care or are made to share some of the costs, because relative costs (intensity) likely increase healthcare prices, properly understood, tend to stay about the same to even decrease somewhat in the long run.
- Some expenditures lumped into “services” are things like telecom and transportation services where a large fraction of their costs are driven by the price of equipment and their maintenance. The prices of these can fall rapidly for reasons largely unrelated to developments within these specific sectors, as in, the price of their intermediate inputs can plummet as a result of productivity gains (more akin to “goods” than “services”)
-
Pharmaceutical prices are likely to be much easier to compare across countries since these are (almost) entirely market transactions, and it is generally easier to makes “apples-to-apples” comparisons with drugs than, say, procedures. I concede the prices we pay for branded, on-patent pharmaceuticals are likely somewhat higher than expected.
However:
- This residual explains little spending overall and cannot be generalized to healthcare prices writ large.
- Richer countries typically pay higher prices for drugs.
- This is a policy choice we’ve made as a society, and it’s one with substantial trade-offs (ex-ante incentives -> long-run innovation).
- We likely pay lower prices for generic/off-patent prescriptions (which comprise roughly 90% of prescriptions in the United States).
- (Even here, IFHP’s reported drug prices for the US are likely over-estimated because they exclude rebates, amongst other issues)
- In relatively market-based systems, such as the US, the list price can be much higher than the negotiated prices (especially factoring in discounts, rebates, etc.). In countries where these goods are supplied “in-kind” through non-market (government-employed) providers, the administrative prices may bear little resemblance to the costs to deliver the care.
- Not to mention several associated working papers produced by these OECD affiliated researchers.
- Usually these are little more than several PowerPoint slides with some sparse, typically ambiguous methodological notes.
- If their methods and data were transparent and sensible, I honestly wouldn’t care who published them (I don’t even believe private third-party payers are a major problem in general!) However, many people citing IFHP’s data would otherwise be very suspicious given the potential conflict of interest and the many degrees of freedom they have here. It’s not difficult to imagine how it serves their American members (e.g., America’s Association of Health Plans, Kaiser-Permanente, Independent Health) to deflect attention away from their industry towards providers, hospitals, pharmaceutical companies, and so on.
- Even if one wants to argue that the OECD health PPP research somehow obtained incorrect price estimates for the United States over several benchmark years and that it’s worth seeking out alternative sources, such as IFHP, it’s still obvious that the real prices and the labor costs associated with these procedures are strongly associated. That we fail to find this pattern suggests the prices they’ve obtained are not representative of prices in these countries or the costs to provide this case.
- I am referring to the net price here to distinguish from the list prices (charges), especially those found in hospitals, that are typically much, much higher than the net prices, i.e., what they actually get reimbursed for actual contractual allowances and discounts are accounted for. The charges, which are sometimes cited by media and self-pay patients, are typically multiples of the average prices actually paid today, both by private and public payers.
Comparison between net and gross in CA hospitals (2018 state-wide)
The issues associated with charges have more to do with transparency and the odd self-pay patient (who may theoretically be exposed to the full list price since they’re not benefiting from the negotiated rates, though collecting even a fraction of this money is typically tricky for hospitals) than real economic costs that determine spending nationally
- The role of “profit” is greatly overstated
- My view is that some risks that would be considered acceptable tradeoffs in poorer countries are unlikely to fly here. ASCs are likely to be increasingly burdened by demands for more equipment, training, more extended observation periods, and the like to cover eventualities if and when they venture into procedures with higher rates of serious complications involving death and serious injury (even if a more rational economic analysis may recognize such changes are not worth the cost)
- Some countries may choose to hire relatively more dedicated administrators and other support staff instead of having health care staff perform them. The need for administration doesn’t necessarily go away just because those tasks aren’t being fulfilled by administrators (setting aside idiosyncratic differences in what different countries call an equivalent set of job responsibilities)
- This includes payments to self-employed professionals/organizations, which is obviously still common for physicians in the United States, and other intermediate goods and services that come out of hospitals’ revenues (e.g., pharmaceutical, medical equipment, disposables, and assorted other supplies)
- The the distinction between day cases and outpatient (ambulatory) visits can be a little blurry in practice. The important thing is that most developed countries have shifted to sharply to avoid overnight stays and, even when they do, significantly reduce the number of days spent there.
- However, I very much doubt these moves have or will result in lower spending in the long-run as I believe spending to be primarily determined by the willingness to pay. As prices fall, public and private payers are likely to loosen the pursestrings. The lower out-of-pocket costs faced by patients may even spur demand.
- Additional details on “human health” activities can be found on page 252 of the SIC rev4 document. These activities map quite cleanly (at this level of aggregation) to BEA’s health services / NAICS codes (Hospitals and Ambulatory care)
- This despite an increasing share of physicians switching from self-employment to labor income
- Louise Sheiner’s analysis makes this plain.


- As in, increasing complexity within healthcare as real incomes increased, which has implications for skills required of nurses, and a general increase in the career prospects of women decades earlier (more competition). Obviously, nursing was and still is primarily women, so factors affecting their employment prospects generally are likely to be particularly visible in occupations predominantly staffed by women (e.g., health and education)
- This implicitly means intermediate costs share is a little higher. As in, this is money that will not eventually end up in the pockets of providers’ (hospital executives) pockets because it’s going to outside organizations to pay for things like new equipment, supplies, rent, malpractice insurance, etc.
- This also implies that compensation and incomes outside of the health sector are rising much faster. Indeed, the cross-sectional results are consistent with this. It is also quite clear that physicians earn multiples of the average wage in most high-income countries
 Comparable patterns in relative growth are obtained for GVA per worker.
 - Yes, I realize this isn’t adjusted for population size, but this just drives home the point. I have already shown that the density of health workers is strongly connected to income levels. We employ many more workers per capita than the typical OECD country, especially the relatively less wealthy countries. Besides, it should be fairly obvious that the population of the first several countries here add up to more than the United States.
- Setting aside the evidence we already have for wages, GVA, prices, and so on
- This is the median of the combined wage income and business income of physicians as compared to other workers. The median was used here because it’s readily apparent that a considerable share of physicians had their reported income top coded in the microdata from which this is derived (census CPS). The median can generally be expected to correlate well with the (true) mean, and the median was below the various top coding thresholds used in these microdata series, so it’s a much more reliable indicator of trends.
This runs contrary to the indexes published by others for physicians.

The “physicians” part of the index is likely to be badly affected by top-coding (large upward bias in the trend).

- In other words, the implied effect on prices was likely smaller still since compositional changes could be expected to increase the overall physician income distribution, as they shifted to more demanding, better-compensated areas, while not necessarily changing the conditional remuneration. The conditional wage trend is likely much more relevant for price trends, properly understood. Whereas the modal physician in the 1950s was a general practitioner that could do little more than tell their patients to “take two aspirin and call me in the morning,” that’s clearly no longer the case. The nature of medicine has changed with technological advancement, so we should be aware that medicine today is, in many ways, more demanding than it once was. The higher incomes are generally flowing to the more demanding specialties as opposed to GPs (especially for routine office visits and the like)
- Notable exceptions include Alex Tabarrok and Erik Helland’s “Why Are The Prices So D*mn High.” Though I enjoyed the book and respect their work, it’s pretty clear the results they obtained for physicians (specifically) were an artifact of top coding in underlying microdata (see footnote above).
- This is consistent with what we observe for relative healthcare compensation trends in the United States and in comparison to other high-income countries. There are a vast number of people at a lower-to-middle skill, training, and income distributions within healthcare, so this is not a trivial point!
- Estimates for self-employed are significantly higher in most countries, including the United States, so this is likely to upwardly bias the United States in comparison to those only reporting multiples for the salaried.
- Not to mention compositional effects in specialties, hours worked, productivity, and so on.
- The returns to skill in the United States are obviously much higher in relative and absolute terms. Would-be physicians are weighing their career paths relative to other opportunities available to them as relatively highly-skilled, motivated people. If pay was arbitrarily cut by a large amount, I have to believe it’d have some implications for the caliber of physicians we would attract and potentially even retain. It may not matter much in some less demanding specialties, but in others, I’d be surprised if it didn’t.
- Indeed, even looking more narrowly at the services traditionally provided by physicians, differences in scope of practice laws, labor augmentation, and general differences in productivity can easily offset modest differences in relative wages for physicians. That is, above and beyond the overall efficiency of health care provision and the cost of other categories of labor inputs.
- As in new technologies and know-how likely expanded demand for certain physician services (especially amongst specialists). While I believe the vast majority of expenditure growth is explained by changes in real income in the long-run, as opposed to technological change or general independent secular trends (implicitly technological), technological changes are likely to affect the composition of health spending.
- Given differences in licensure and occupational designations, some of which OECD notes in their documentation, these data are likely more useful for characterizing the direction of spending as opposed to drawing strong comparisons between particular countries.
- In OECD.stat this variable, HOEMHOTS, is labeled “Other staff employed in hospitals.” While definitions vary between countries, this is a bin for all “other” staff in hospitals that are not providers/nurses, technicians, or otherwise directly assisting providers (e.g.., administrators, medical records staff, and other overhead functions not directly providing care).
- Countries don’t necessarily apply consistent labeling to occupational roles and job responsibilities are likely to vary between countries. Even if a country has many fewer dedicated “administrators” (however defined) in conditional terms, it doesn’t necessarily mean it spends less on administration or, especially, that it saves money in the final analysis. For example, it’s probably cheaper to have less highly paid clerical staff do clerical tasks than having providers spend relatively more of their time doing these tasks themselves. Likewise, there are other ways to reduce apparent administrative expenses while not necessarily saving money.
- As in, price, quantities, labor inputs, intermediate consumption, average employee compensation, and operating surplus, amongst others, most which can be observed in time series and in cross-sectional analysis. These indicators generally paint a consistent picture vis-a-vis the relative role of prices and quantities per capita as it relates to income levels
- This is sort of a casual attempt at “steel-manning” this particular line of argument and an attempt to cut to the chase. I’ve not found better evidence (indicators) for this position, and widely cited literature of this sort really should be amongst the best. I am not trying to find people with weak data here!
- Available OECD.stat data for US procedures are inpatient only. A non-trivial share of some of these procedures are being performed on an outpatient basis, and the United States is likely leading the charge here (tends to be cheaper, faster recovery, etc.)
- While age structure and disease burden is unlikely to be a significant determinant of overall health spending in the developed world (it’s overwhelmingly income levels), such factors likely have some influence on where and how the available pool of resources are spent. In other words, an older society is likely to do somewhat more hip replacements, ceteris paribus, even if they don’t necessarily spend more money on average. Other causes of idiosyncratic variation here are likely to be attributable to the tendency to do procedures on an outpatient basis. The United States is very likely on the vanguard of the movement to do procedures in ambulatory settings, both hospital-affiliated outpatient centers, and free-standing surgical centers, especially for newer minimally invasive alternatives.
- It’s quite obvious results from the COURAGE trial had a large effect on utilization of these procedures in the United States starting around 2007.


- US data only reported for day cases and only for 2006, but OECD.stat and an OECD report indicate the vast majority of cataract procedures are performed as day cases in other high-income countries, so the results with a fuller measure should be quite similar.
- While this runs 180 degrees from received wisdom, I don’t find it implausible that the US healthcare system is actually more efficient at delivering the sort of care people demand (whether it helps move the needle on outcomes is a different question). These results are also consistent with OECD’s health PPPs — conditional on income levels or health spending, US prices are slightly below trend.
- Aside from the lack of statistical significance and likely non-trivial issues with comparability, effects of age-structure, and so on, doubling health spending only predicts a 5% increase in this office visit measure. More developed health systems aren’t spending their money by increasing the number of encounters with physicians, especially in the narrower office visit framing. Costs are clearly more determined by what happens when people encounter physicians or otherwise have contact with the health systems, as in, procedures, diagnostics, therapies, etc.
- I am using AIC as a proxy for disposable income here since it is more widely available.
- Population age-structure, disease burden, and other idiosyncratic factors are likely to take on proportionally more influence as income ceases to predict.
- in the broader economic sense, as in, drugs, devices, procedures, therapies, etc. Mostly, all of this stuff requires many more workers in hospitals and providers’ offices to deliver the care.
- When modeled to explain excess cost growth, i.e., spending over and above income growth, the coefficients on relative price inflation would be at or below zero, which implies a relatively larger role for technological change. Not to mention that, so far as I’m concerned, including income, administrative growth, and the like as somehow being independent is really missing the point and makes these coefficients unnecessarily hard to interpret (really needs something like a DAG to model pathways from income to technology, relative prices, etc.). In other words, these are likely lower bound estimates for the effects of technological change!
- As in, surgeons/physicians, skilled nurses, lab technicians, physical therapists, health care assistants, administrators, and many more.
- The claim isn’t so much that the cost of technological goods themselves drive this, but that the labor required to provide this care does. It’s clearly not being driven by the price of goods, not on an apples-to-apples basis, at least. Indeed, as incomes rise, the relative price of goods tends to fall relative to income, and it’s pretty clear this holds for health goods on average. Mostly, it’s the people in the health services side. To a lesser degree, it’s rising real consumption of health technology itself, which is reflected in the rising costs to bring this ever-expanding basket of goods to market. This can be observed with the rising importance of health R&D (pharmaceuticals/biotech, medical devices, etc.) and related costs required to bring economically viable products to market.


- This isn’t to say these policies have large effects on aggregate spending levels in the long run, but mostly that there’s some evidence for idiosyncracies at the more granular level, particularly in the short run.
- Providers are primarily responding to the underlying conditions and complaints.
- Much of the variance (error term) is likely attributable to the preferences of different countries to do procedures in inpatient as opposed to ambulatory settings, not to mention some idiosyncratic preferences in length of stay. For example, Germany does (or at least reports) a much higher share of procedures in inpatient settings. Shifting relatively minor procedures to inpatient will tend to reduce the apparent average cost, though it’s unlikely to lead to genuinely lower costs (quite the contrary!)
- This is the sum of day, outpatient, and home-based curative and rehabilitative care in the expenditures-by-function perspective. These reflect most healthcare spending that’s not inpatient care. It excludes things like preventative care (trivial), retail medical goods, long-term care, insurance/administration, and some other secondary items. In theory, it should map reasonably well to the denominator.
- In some (very) small part this might be understood as a compositional problem as procedures and tests that are performed exclusively on an inpatient basis are increasingly being performed in ambulatory settings instead with less invasive technology. The larger issue, by far, is that so much more is being done even if the price of these things is declining relative to income.
- Potential consumption here is defined as the maximum amount of real consumption per capita possible out of income after deducting health spending from income and accounting for the prices faced in each of these expenditure categories.
- Some people might quibble with exacting interpretations of widely separated price and expenditure indexes, but (1) a few decades are not that widely separated (2) they are effectively credible, central estimates of experts [probably at least as likely to be conservative under-estimates of quantities] (3) it’s unlikely such large secular differences in price and productivity trends across so many categories are mere artifact.
- Such as transfers, third-party payers, and (substantially) nationally-determined standards of care


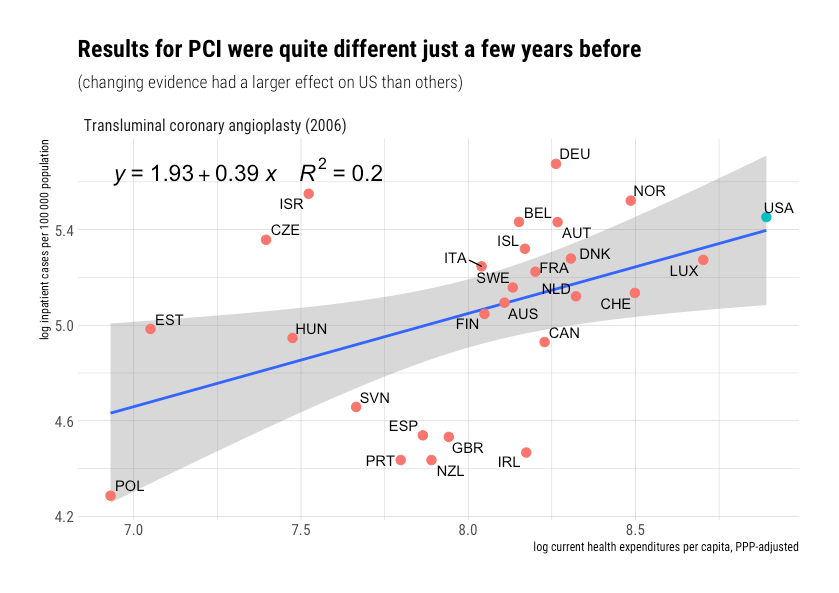


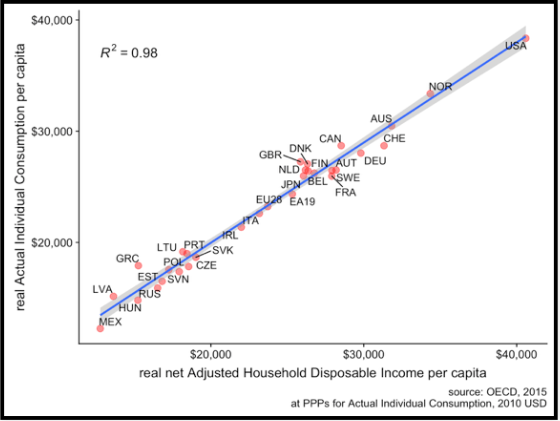
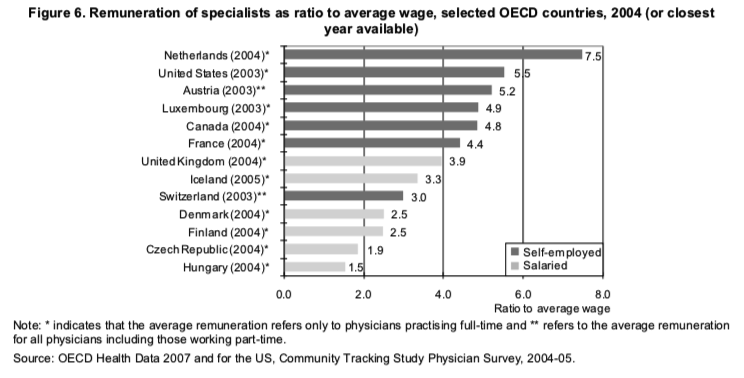
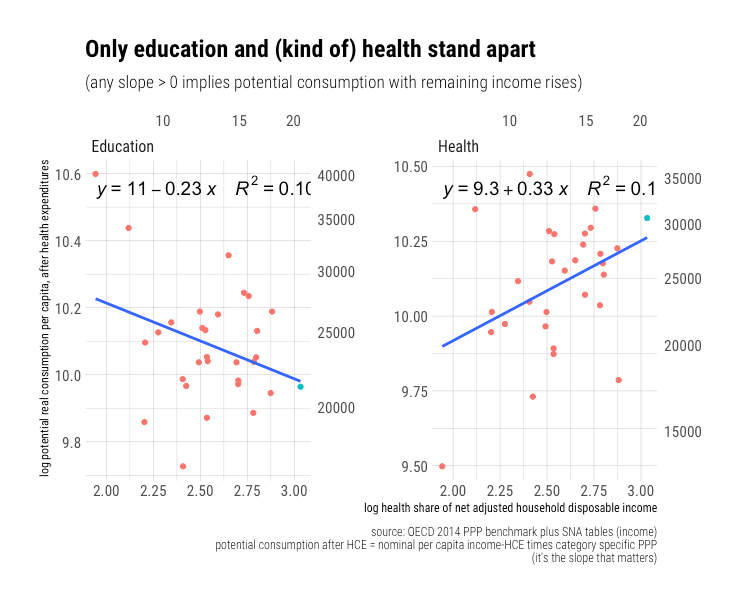
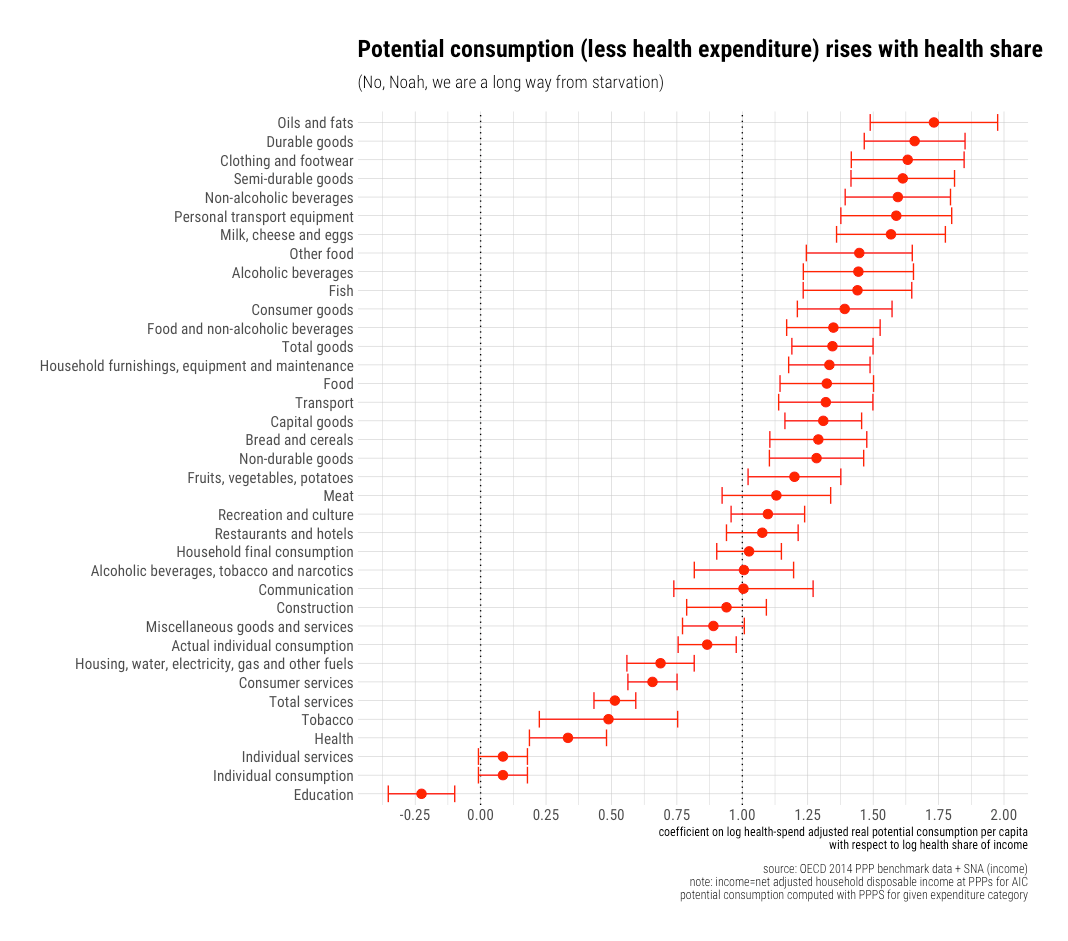
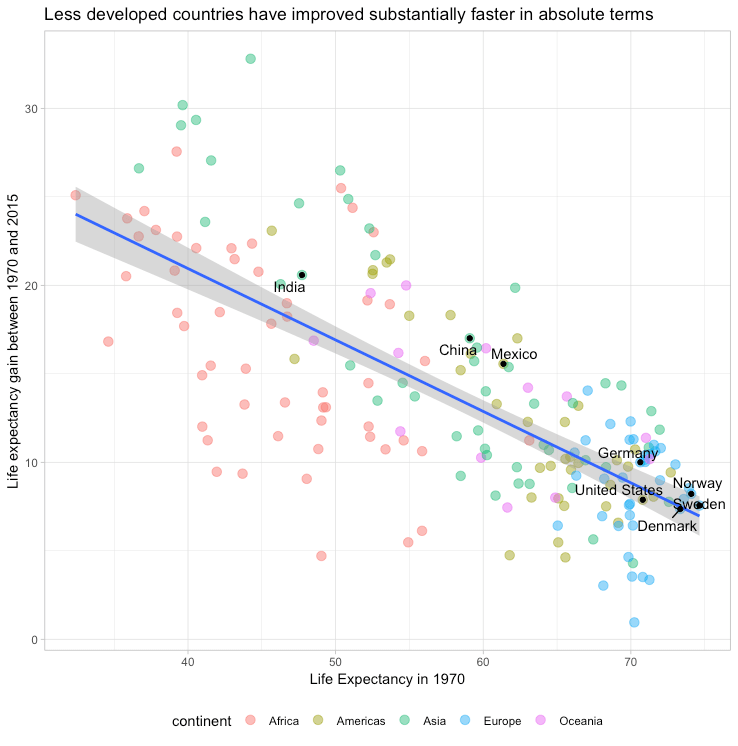
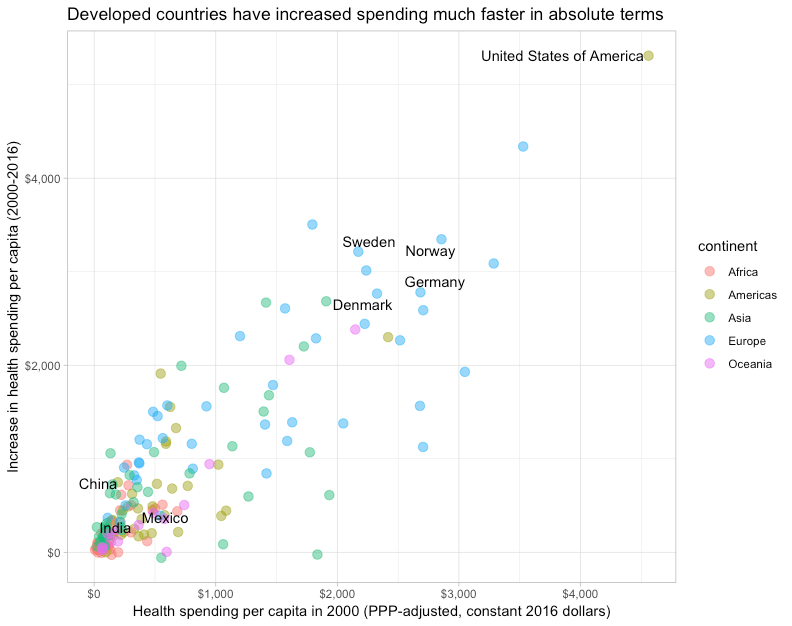
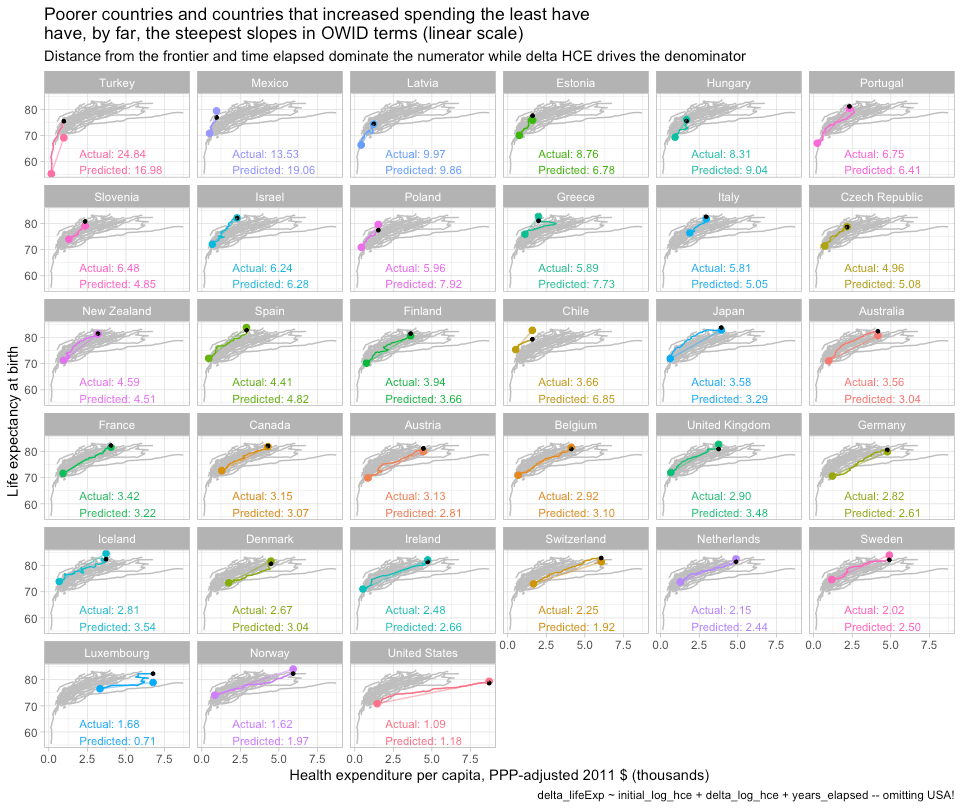
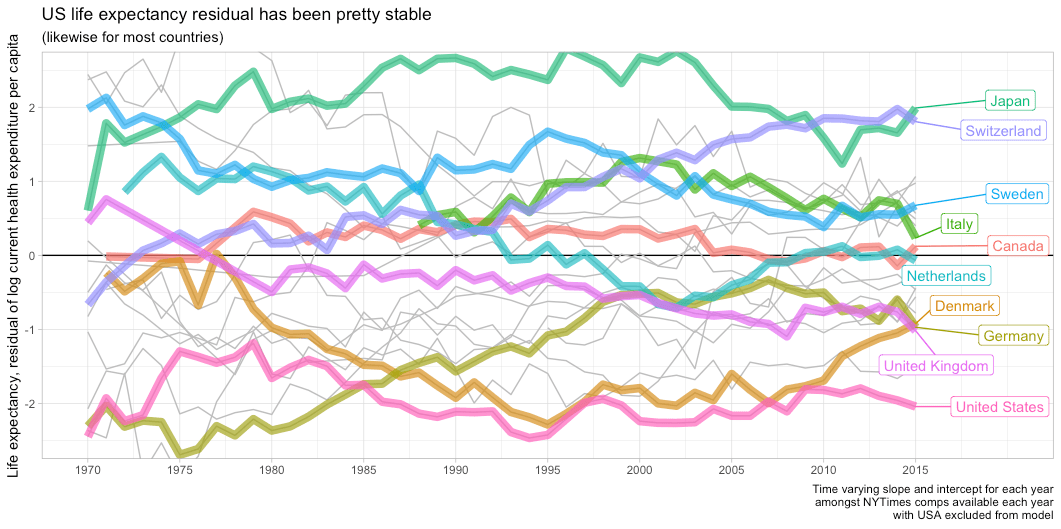
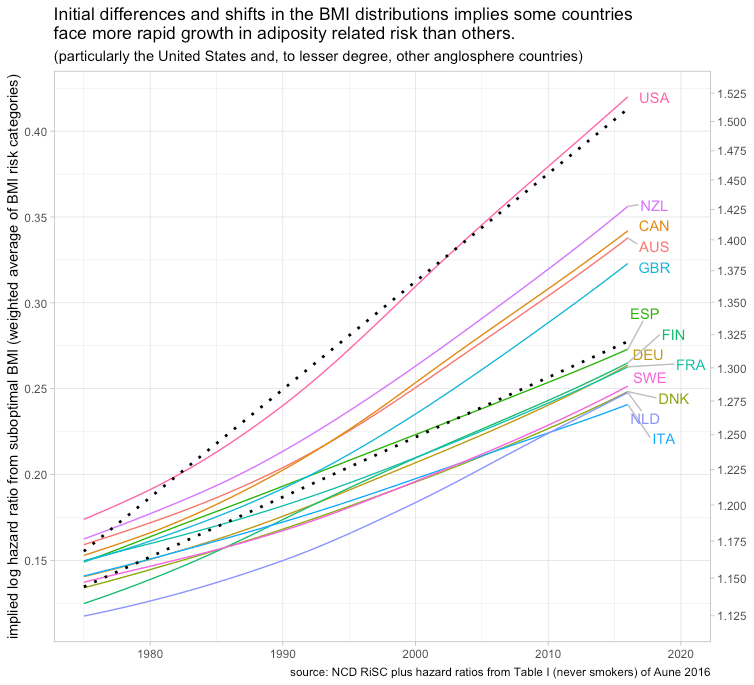
The table of contents is really annoying. You should change it so it does not keep taking keyboard focus.
Hi. I know what focus is, but I’m not noticing it on my end and I’m sure what you mean by that here precisely. What are you trying to do where this focus stealing is an issue (how can I reproduce)?
FWIW, I think your tables of content are great, and in general the idiosyncratic (“unique”) customization of your website is great.
(The content is fantastic too, but now I’m just being sycophantic)
I have the same problem. If I use the arrow keys to scroll down the page, it works fine until I hit a new section. At that point the focus changes to the TOC and I can no longer scroll with arrows until I click on some portion of the main body text.
Thanks for this. Look forward to getting into it in more depth.
Your first graph of income vs consumption has me stuck. It appears that income per capita (PPP) is much higher in the US than in Norway, but all the data I’ve found shows the reverse. The discrepancy might be due to your use of net disposable income per capita – but what exactly is meant by “net” and “disposable?” I am guess that taxes have been removed – but if that is the case, a good part of that tax burden in Norway may be for health care. So, the extremely close log linear relationship you show may not be the appropriate graph to see if the income/health care spending relationship is out of line in the US.
One of the best articles I’ve ever seen on health economics.
I’ve read a few articles of similar length, several analyses, and a couple books…and this is magnificent.
Thank you.
If I were to have one further wish here, it would be to include Singapore in either this analysis or in a nearby analysis … there is at least some reason to believe that the Singaporean health system is actually Better, Faster, Cheaper … off-curve in good directions … due in no small part to technocratic decisions pushing health costs down. (HSA basis, Catastrophic mandatory insurance, Out-of-Pocket, Price Comparison mandatory, Health education, etc, etc.)
Hi! Thank you for putting together this summary of your thoughts, perspectives, and analyses on the American healthcare system. I think it’s great that you put this material out there for discussion. I wanted to share some thoughts and observations of this analysis and would love to get your feedback.
Your analysis lumps together commercial and government prices. By lumping these two pricing regimes we may be obfuscating some of the issues in U.S. Healthcare. Government prices have been flat while commercial prices have been growing faster than income. Commercial prices are between 200-300% of Medicare. Medicaid prices are much less than Medicare Prices. The gap between those two pricing regimes is widening even after adjusting for income (Medicare Household = $30,000 to Private Household = $49,000). While government healthcare can become more affordable, commercial healthcare has become less affordable (price growing faster than income). The United States can still have the biggest affordability problem in the world with your analysis still holding, if you consider the prices facing non-government covered consumers.
Regarding section 4 – I think it’s misleading to say “The rising health share is explained by rising quantities per capita (not prices!) In general, I don’t see how making a statement on price growth by adjusting by GDP or disposable income makes sense. It’s also explained by rising prices, both things rise, all at the rate of GDP, it’s just more out of character for price to rise over time (when compared to most other goods)….
Prices and GDP per capita can grow at the same time, just because they are growing at similar rates doesn’t mean prices aren’t growing and can’t explain growth. GDP per capita is growing exponentially, Section 4 is basically telling me that inflation-adjusted healthcare price is growing exponentially too. Unit price still explains virtually all growth in healthcare spending, relative to other things we buy more of (probably other than education, a similarly messed up market).
Additionally, if you look at the Quantity Index and the Quantity Index of Health Services, they are moving evenly. Healthcare is a stable portion of the bundle of services that we buy, the amount of our wallet spending has increased, the portion has remained the same but the unit price has increased relative to other goods and services to the point at which it takes up a larger portion of the dollars we spend.
Also, the graph under “America spends much more because it consumes much more” doesn’t make sense to me. Why are we adjusting prices by household spending per capita? Section 6 has the same question, why adjust price by Income and say it’s not the prices?
Issues with OECD prices (citation 13) that you cite (the 2017 study) – Are these Medicare prices? That is quite possibly is the only thing that would make sense unless we are to believe that America uses 2.5X the health care units of Norway and 2X the healthcare service units of Switzerland. This seems kind of unreasonable considering we have fewer hospitals, beds, doctors, and other healthcare workers per capita. To calculate this ratio I am looking at per capital PPP adjusted expenditures on healthcare / price index for health. Also look at your graph in section 5, OECD then estimates we have the highest prices (since our AIC is over 20% higher than the next country in the OECD)? Are these price estimates substantially jumping around?
They are using the output methodology for the price estimate in the 2017 study. If they got this wrong, I don’t blame them, our healthcare system is crazy complicated, and we have multiple idiosyncratic pricing regimes. I think the AHRQ sends them data, we’d probably need to check on how the AHRQ weighs that data.
I think it’s fair to say America spends a lot and healthcare is no exception. As other countries spend more the rate at which they increase the share that they spend on healthcare increases. Also fair, is saying our healthcare system is less weird once you adjust for overall spending (AIC vs. GDP). Some of the other claims have issues. Your claims on unit price not being the driving force on the cost differential and increased cost is off.
Issues with Adjustments: Choosing to adjust by Median Income GDP per Capita, or other means of adjusting for income creates different results. Taking out healthcare from AIC also creates different results.
Section 4 Adjusting prices by GDP and Disposable Income, if you take out healthcare GDP and income share in both of those measures’ prices are growing relative non-healthcare GDP. All this is to say healthcare prices are raising relative to non-healthcare incomes.
Also, a lot of what drives high US AIC is extremely inefficient healthcare and education markets, I wonder what it would look like if we removed those two.
I also don’t have a deep understanding on AIC and don’t know if it’s the best adjustment. It also depends on what we want to assess (affordability for consumers, etc.)
Thanks for reading! I’m really into this topic as well.
This is a great article as a starting point for a heated subject. I think the conclusion is, to rein in runaway healthcare cost in the US we have to sharply reduce people’s income. Then healthcare cost will naturally come down.
Wow…more research here than I’ve ever seen.
I help people plan for medical costs in the US using underwritten insurance.
I believe the cost of healthcare for healthy people takes away from discretionary and disposable income.
Conventional thinking is that spending on healthcare is damaging to the economy.
Has it occurred to you that the US economy has benefitted from its inordinatey expensive healthcare system for the following reasons:
1. it generates spending- in the keynsian sense it boosts aggregate demand
2. it employs people in well paid jobs
3. the spending is largely local
4. it has provided a buoyant market to help justify R&D and investment into a buoyant world market
5.it has boosted welfate – albeit inefficiently
6. the foregone expenditure would have been more badly spent on things with less utility and with less beneficial outcomes
Hey, so one of the most convincing graphs on your site (according to me) is the one that shows that as countries catch up to US income levels, they also catch up to US health spending levels. You may want to consider putting that graph in the primer.
Why did you leave out Luxembourg and Switzerland in your first graph? The data is there for both countries. It seems that you chose the countries that would fit your spending theory.
I am not certain which plot you were looking, but the data are not available for all countries across all years. I rarely just drop an observation unless it’s obviously some sort of data entry error, which is quite rare and I don’t believe happened here.
When I omit something from regressions I indicate as much in the plot or here on my blog and I typically still plot the data. Switzerland is not one of those countries and it has tended to be strongly consistent with my thesis. I have occasionally found cause to omit Luxembourg (while also omitting USA!), such as in the link below, but (1) I indicate as much, (2) it’s very defensible because it’s a tiny city state (~600k population) with a large cross-border workforce that distort even these household perspective measures since cross-border shoppers show up as consumption, and (3) their trajectory is consistent with the same income effect (i.e., this is more of a fixed effect).
https://randomcriticalanalysis.com/misc/the_uk_is_the_outlier/
Another way you can look at this is to compare these trends as I indicated some time ago on Twitter. When a handful of countries like Luxembourg started seeing their GDP pull away from the United States several decades ago, neither their household’s consumption or disposable income moved, likewise for health spending. Health spending has continued to track the household perspective, not GDP.
https://x.com/rcafdm/status/1717951643264725169
This is topical right now: I was led to it by a Ben Shapiro splashline on utoob. Before I invest time engaging with your comprehensive analysis I’d like to get a copy of the datasets you are working with so I can do a little fiddling myself. Would that be possible?
I’ve had a quick look at the OECD website and GPT4 and failed in my initial attempts to replicate some data points, no-doubt due to user error.
I love your thoughtful analysis. Thank you for sharing your insights. I have a couple of questions to reconcile your analysis with the “it’s the prices, stupid” ideas.
We want to reject the hypothesis that it’s prices via frictions like monopoly driving US healthcare costs. I agree from a macro-perspective, US healthcare expenditure seems to be caused by income-driven demand for better healthcare technology and Baumol cost disease of complementary healthcare labor. However, from a micro-perspective, it seems like there is a strong case for monopoly rents inflating prices.
For example, in 2022, across all hospital inpatient and outpatient services (including both facility and related professional claims), employers and private insurers paid, on average, 254 percent of what Medicare would have paid for the same services at the same facilities (RAND report). That spread seems to indicate large price discrimination and monopoly rent, no? The US also has a thick layer of healthcare of administration due to the complexity. Per capita admin spending in the US is 3x higher than in Germany. Some reports estimate up to half of healthcare administration is wasteful bloat from services like duplicative payer contracts, prior-authorization ping-pong, out-of-network billing escalation, and IT bloat scale in direct proportion to the number of payers. Does this bloat not suggest an inefficiency that drives up prices?
I understand that dynamic efficiency might allow for monopoly rents as an incentive to innovative whereas static efficiency brooks no monopoly rents because it sets price equal to marginal cost. Prescription drugs is an area where the US seems to get this balance right. For generic drugs, where there is no more innovation to be had, the US has lower prices that OECD countries, which suggests static efficiency of price near marginal cost. For new drugs, where there is the potential for innovation, the US allows for temporary patent monopoly rents, spurring innovation. However, I don’t see this balance being struck in other parts of US healthcare. Granting hospitals permanent monopoly rents does not seem to generate innovation, but instead drives up healthcare prices.