It is well established that the United States has a much lower average tax burden than Europe (broadly).

However, some people seem to believe that ordinary people in Europe do not actually have to pay much higher taxes and that somehow (illogically) these countries with presumably lower income inequality are able to generate all of this tax revenue to pay for all this “free” stuff by just taxing the top 5% or some such. This is complete nonsense! These European countries generate this revenue, in the main, with a much broader tax base, both income and social security taxes (and consumption taxes to lesser extent).
Below are a bunch of graphs and figures produced from the OECD’s estimates from the statutory tax code (note: these are particularly sensitive to assumptions made)
Income tax plus employees and employer’s social security contributions as percentage of labor costs

If you look at the OECD’s 2014 “Taxing Wages” report these and many other estimates can be found.
The first two charts below compile the OECD’s estimates by the average effective tax rate (“tax wedge”) by percentage of each countries average wage rate by, first, single childless households and, second, married couple with two children (one earner).


The third chart is sort of similar, but it computes the “net” tax after cash-transfers, excluding “employer” social security contributions (!!!), divided by the labor cost. [Note: Most economists believe that the economic incidence of the “employers” contribution falls almost entirely on the worker so this method dramatically understates the AETR in Europe given their high social security contributions].

Here are a bunch of individual OECD charts
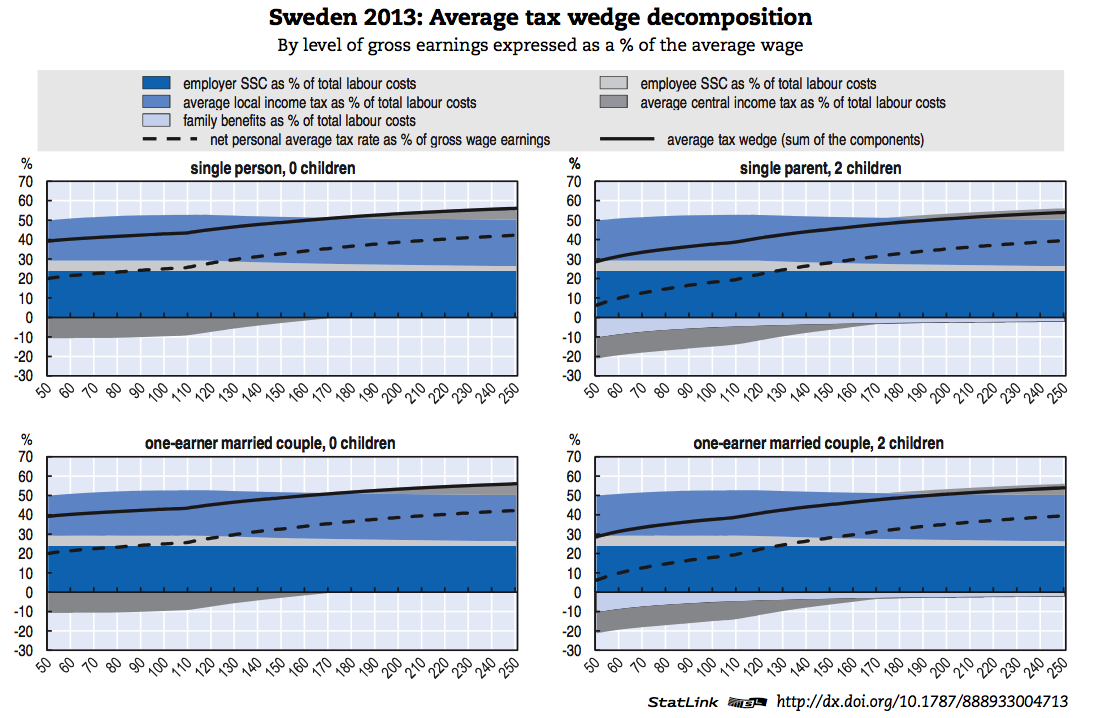
Note: Pay particular attention to the top line (solid black), i.e., average tax wedge.
United States Average Tax Wedge

France Average Tax Wedge
Germany Average Tax Wedge

Finland Average Tax Wedge
Sweden Average Tax Wedge

Netherlands Average Tax Wedge
Canada Average Tax Wedge


United Kingdom Average Tax Wedge
 Here is a handy table to explain their terminology and household/tax payer categories.

As you can see 50-250% of the average wage group in the United States face a much lower tax burden than does most of Europe (the only real exception, according to this data, is Switzerland), especially the more generous welfare states, even if you factor in the value of cash benefits. Canada and other other anglo countries come fairly close to ours at times, but ours is still lower throughout most of the distribution (not even top 5% territory).
This also does not include the effects of various consumption related taxes (e.g., sales, VAT, and excise taxes on lower income groups especially).
It also probably significantly overestimates the real US tax burden, especially in broad middle income ranges, due to the fact that healthcare benefits are not taxed and are not part of the “gross labor” estimates, not to mention that we generally have many more deductions, reliefs, and the like that narrow our tax base (more than most).
OECD Non-Standard Reliefs in USA
The basic non-standard relief is the deduction of certain expenses to the extent that, when itemised, they exceed in aggregate the standard deduction. For the purposes of this Report, it is assumed that workers claim the standard deduction. The principal itemised deductions claimed by individuals where the standard deduction is not being claimed are:– medical and dental expenses that exceed 7.5 per cent of income;
– state and local income taxes, real property taxes, and personal property taxes.
– Home mortgage interest;
– Investment interest expense up to investment income with an indefinite carry forward of disallowed investment interest expense;
– contributions to qualified charitable organisations (including religious and educational institutions);
– casualty and theft losses to the extent that each loss exceeds USD 100 and that all such losses combined exceed 10 per cent of income; and miscellaneous expenses such as non-reimbursed employee business expenses (union dues, work shoes, etc.), investment expenses, tax return preparation fees and educational expenses required by employment, to the extent that, in aggregate; they exceed 2 per cent of income.In 2010, the most recent year for which such statistics are available, the 36 per cent of taxpayers with income between USD 40 000 and USD 50 000 (the AW range) who itemised their deductions claimed average deductions as follows: medical expenses, USD 3 359; taxes paid, USD 1 831; charitable contributions, USD 2 310; interest expense, USD 7 951.
Contributions to pension and life insurance plans. No relief is provided for employee contributions to employer sponsored pension plans or for life insurance premiums. However, tax relief is provided for certain retirement savings.
The national currency is the dollar (USD). In 2013, the average worker earned USD 48463 (Secretariat estimate).
The United States also relies much less on consumption taxes, both as a proportion of GDP and as a proportion of taxes raised


Clearly most of this burden falls on lower to middle income households that consume nearly all of their incomes (not so much the “rich”).
It is also not generally true that Europe taxes capital and corporations more heavily (in fact, many of them have significantly lower effective rates on capital than the United States does!).
More on this subject later…
P.S., Here is an interesting statistic from OECD’s Social Expenditures Database (SOCX).

Make of it what you will 🙂