I was pointed to this work by Hussman through Business Insider.
The implication here is that total dissaving is not only strongly correlated with corporate profits, but is directly causative.
Although he doesn’t fully specify this methods, it’s obvious that Corporate Profits is after-tax corporate profits (including foreign profits) and I was able to approximate his results using this FRED2 link.
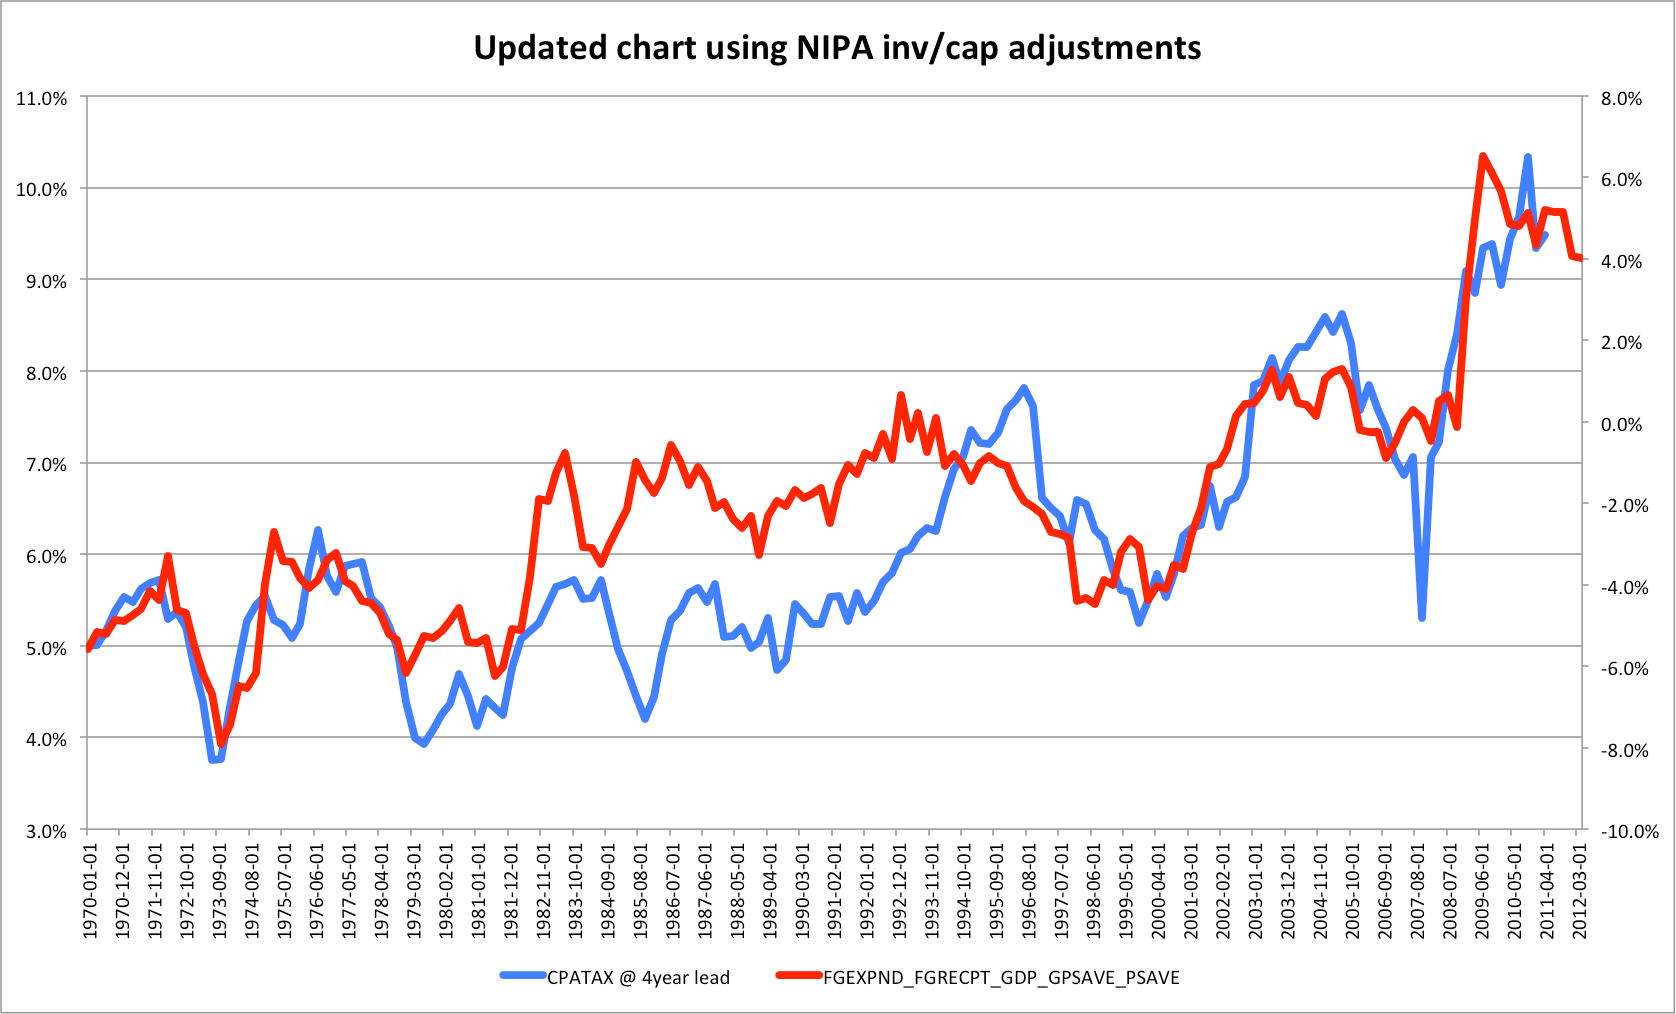
Update: I re-charted this using the NIPA corporate profits inventory & capital adjusted data that he clearly used (CPROFIT). It doesn’t really change the outcome here, but it matches his chart more precisely.
Corporate profits is, in other words, after-tax and including foreign profits.
Savings is approximately personal savings (PSAVE) + the Federal deficit/surplus (FGRECPT-FGEXPND) (multiplied by -1 to match to shape of the profit line)
There are many issues with this analysis
1: By showing after-tax profits he’s exposing his analysis to changes in the tax regime and business reporting (as I’ve alluded to in prior posts). The corporate taxes paid has direct mechanical effect on after-tax profits and the tax regime has changed. Further, in this most recent recession we have actually cut corporate taxes in the short term by allowing businesses to accelerate deprecation more rapidly.
2: Including foreign profits in this discussion also obscures the role that deficit spending (or consumer dissaving) might be playing here.
3: Cutting it off at 1970 obscures what is obviously a much worse correlation in earlier years, i.e., when savings were much higher and corporate profits were much higher.
4: Lagging quarterly data by a full year just doesn’t make much sense to me.
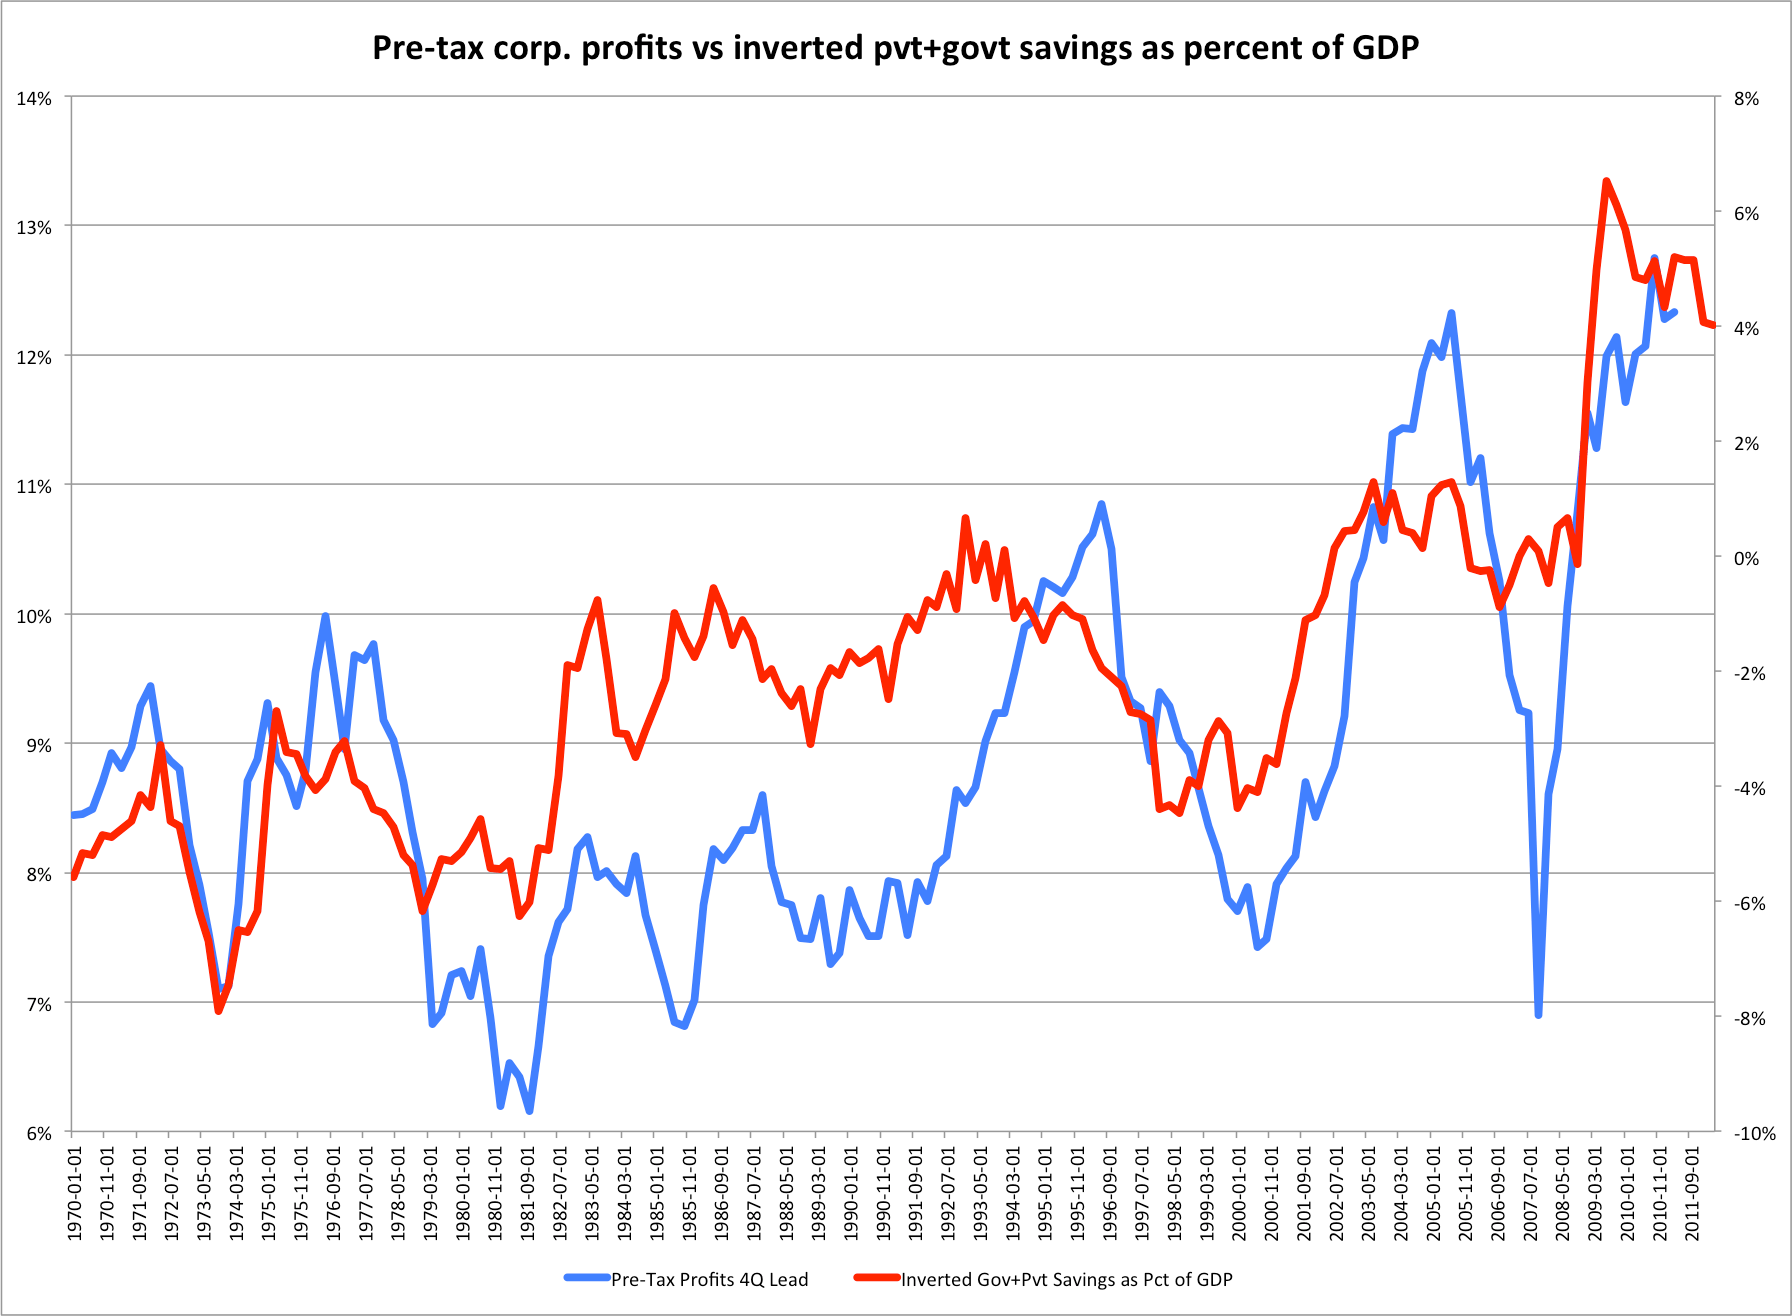
Same method, i.e., 4Q lead, using PRE-tax profits
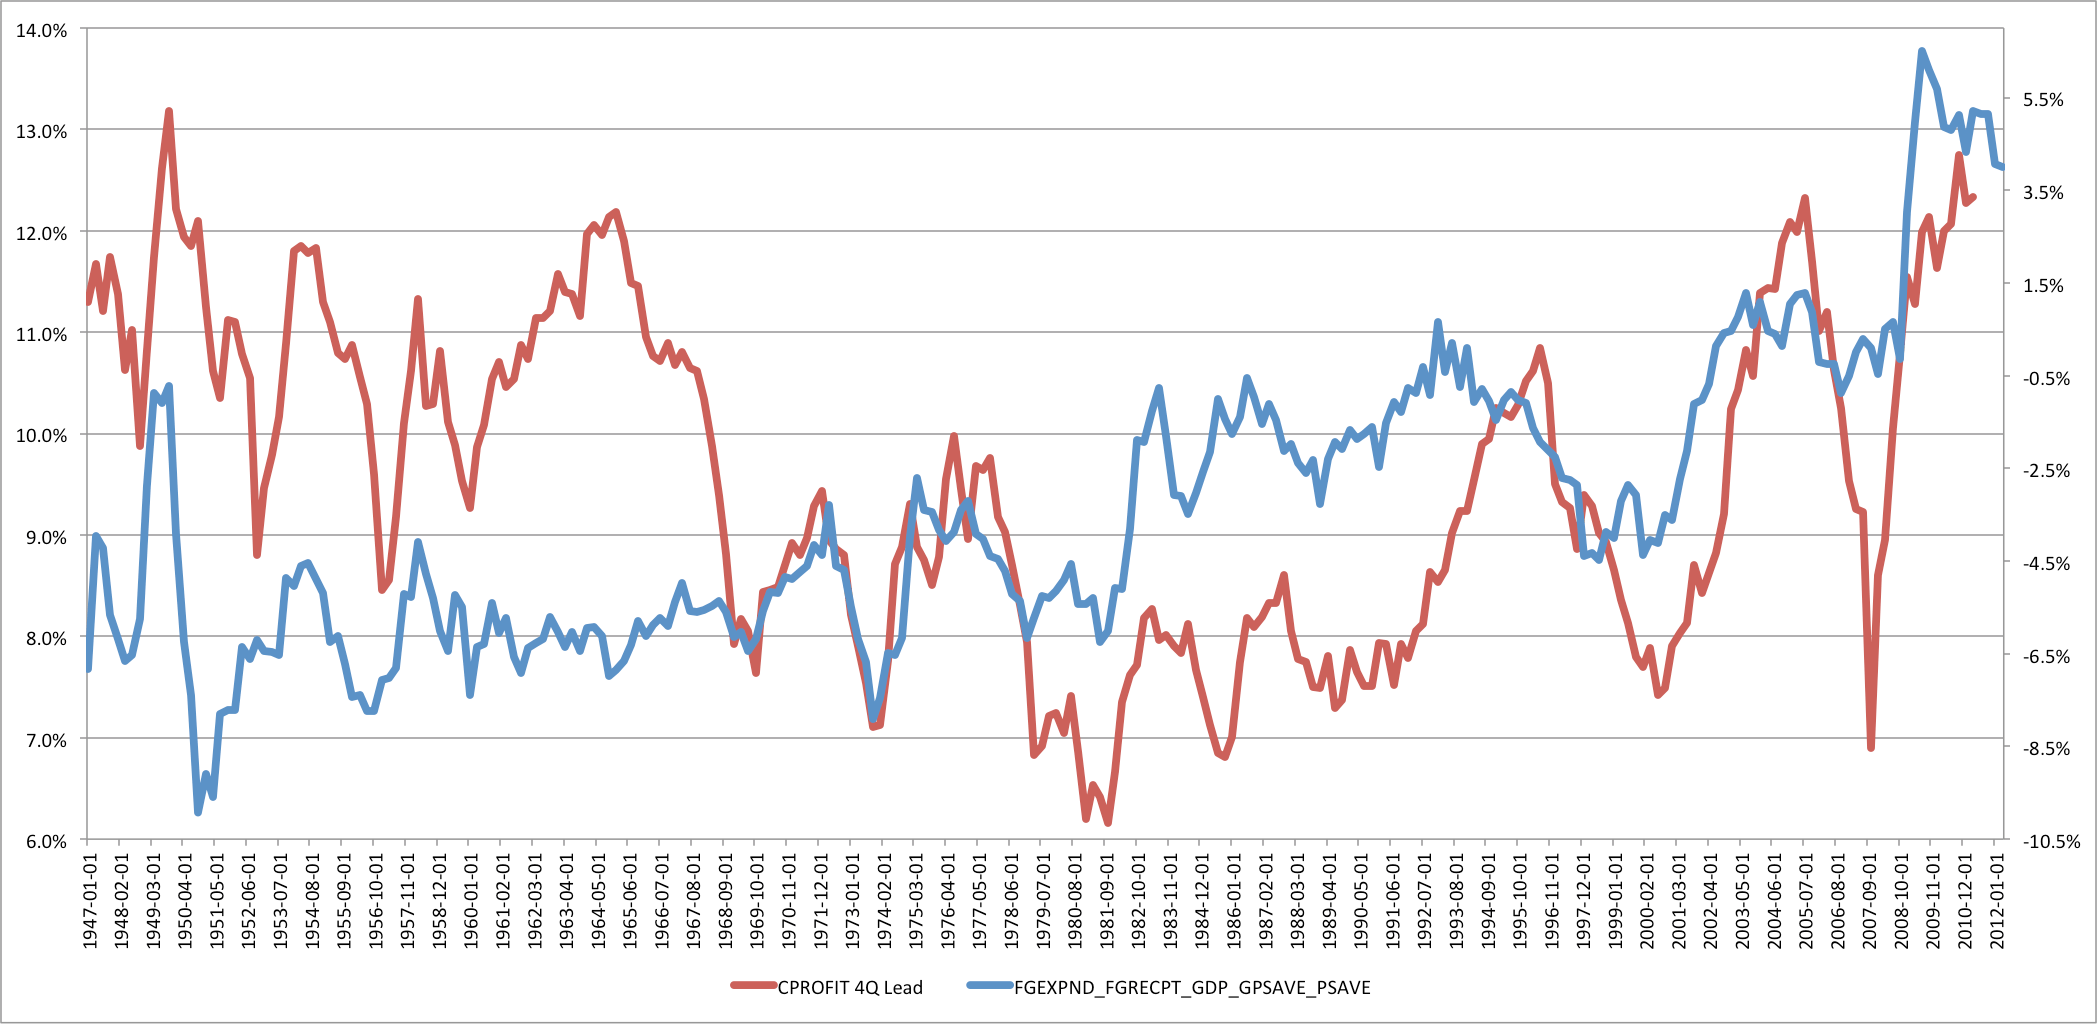
Same method over a longer time span (1947-2011)
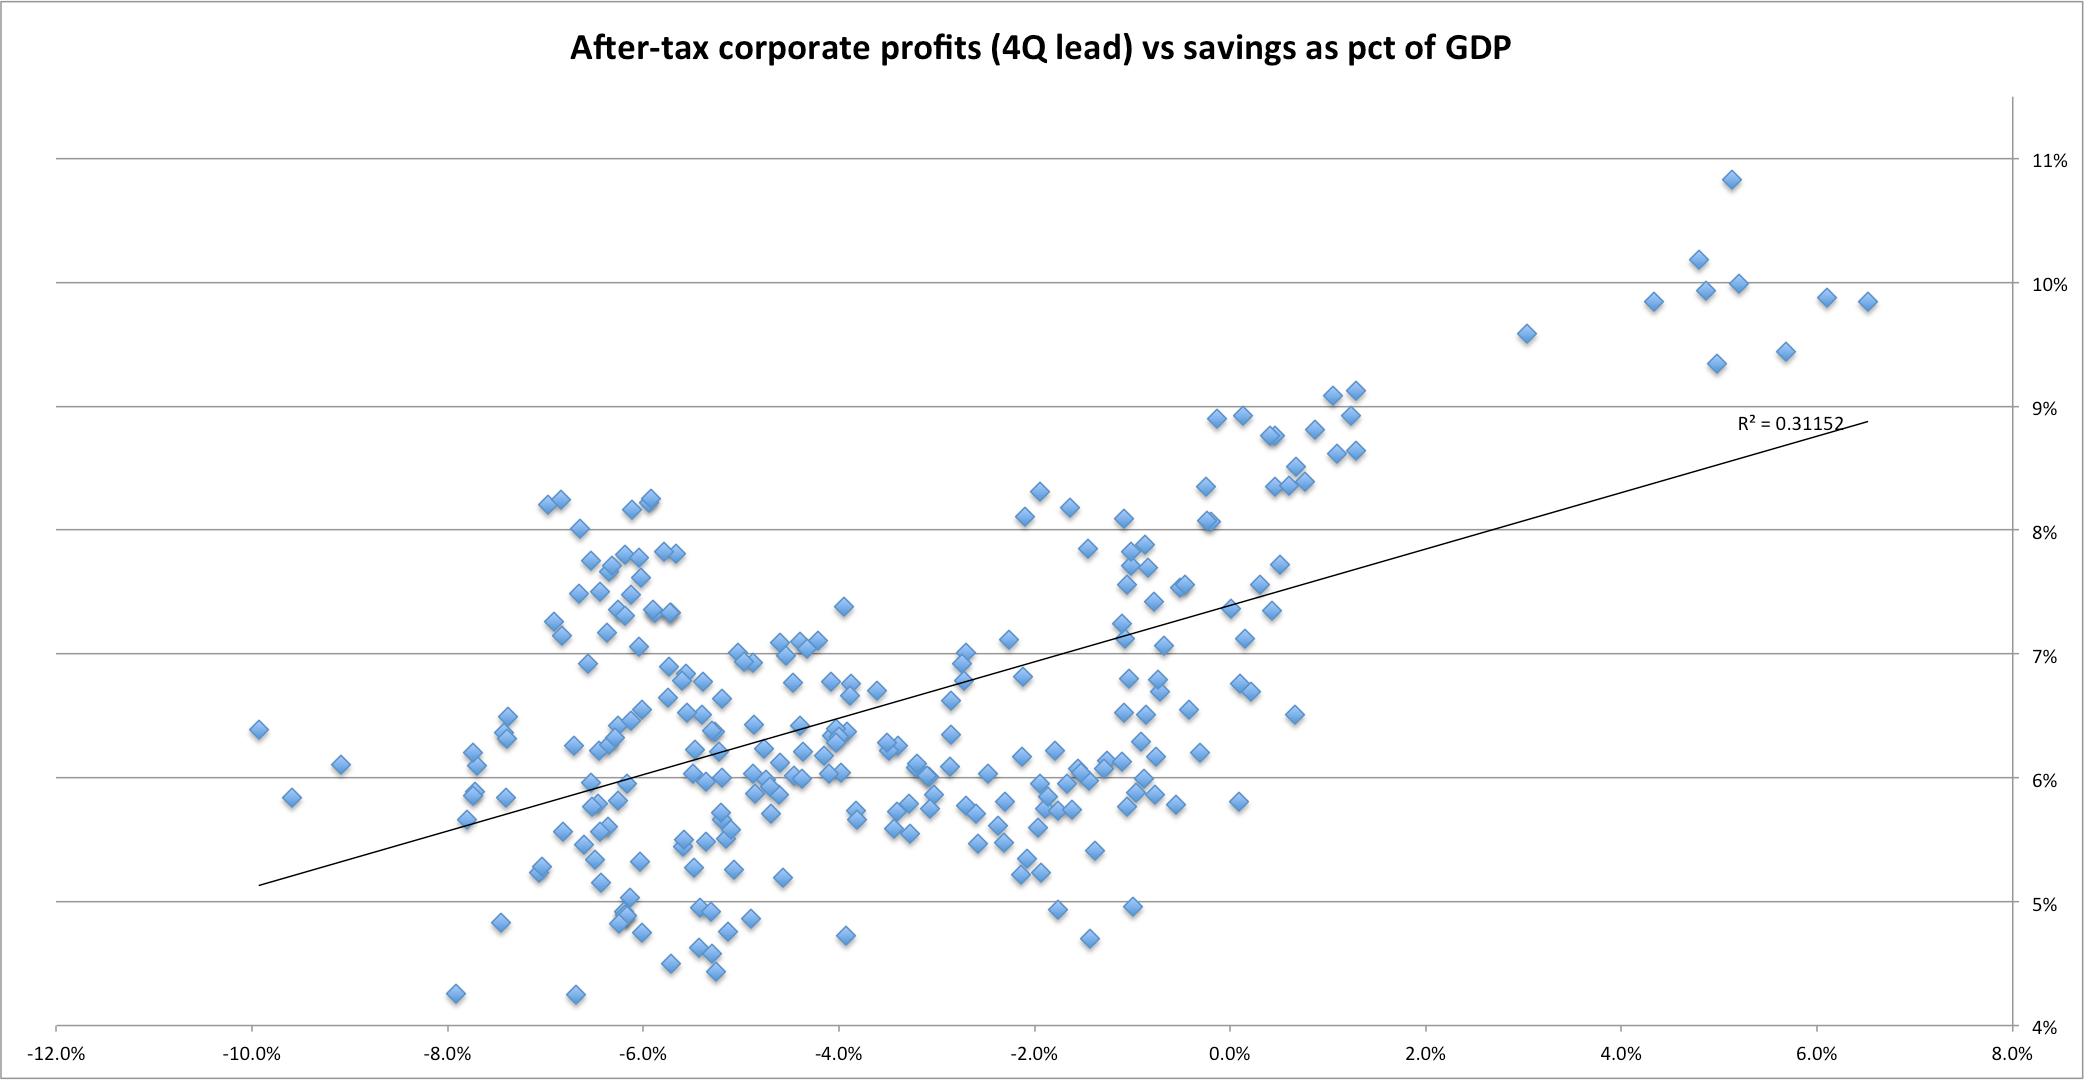
Scatter chart savings vs after-tax
Scatter chart: savings vs pre-tax profits
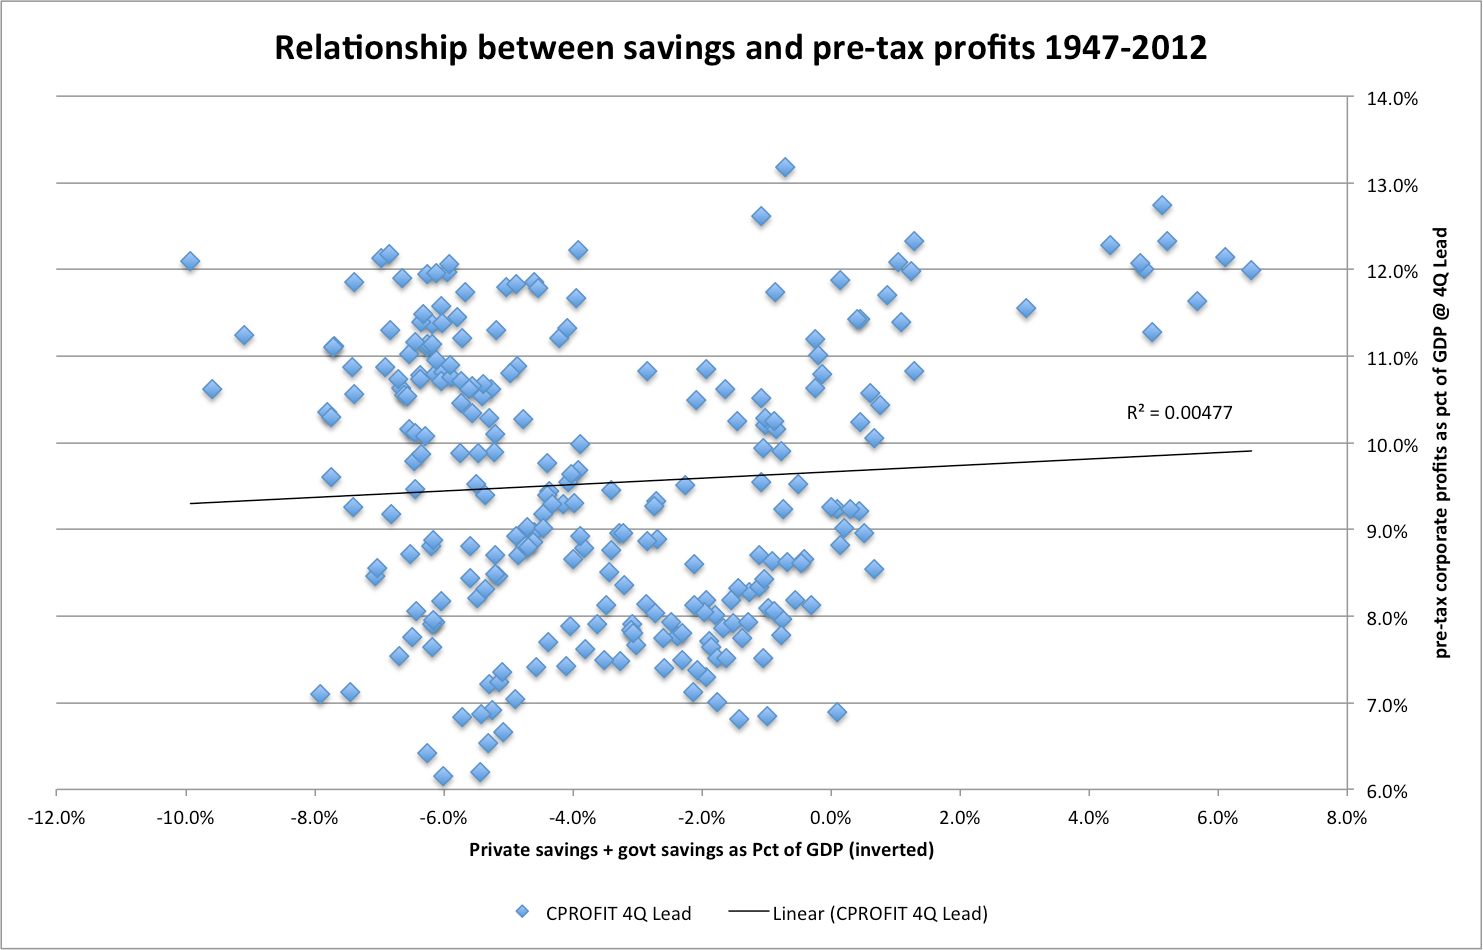
Observe: When you remove taxation from the equation the slope and correlation virtually disappears.
After tax profits vs Corporate Profits
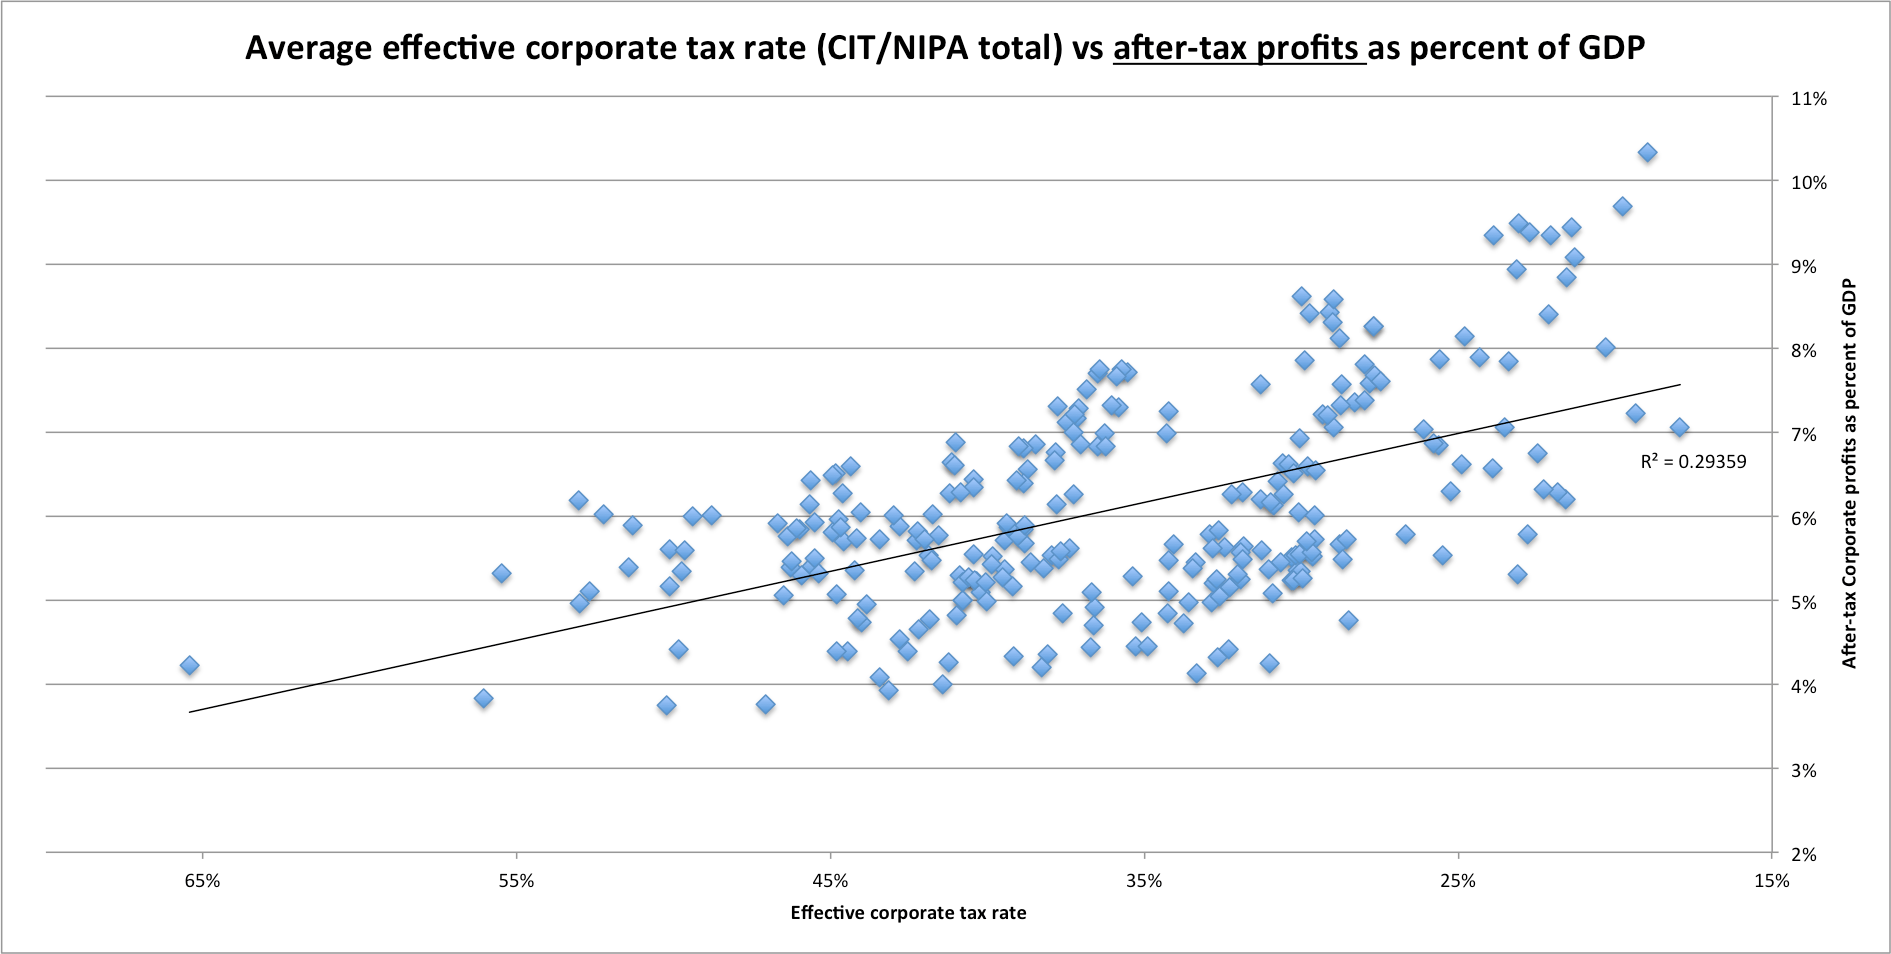
It’s almost as-if corporate taxes actually has a direct impact on after-tax profits (and thus accounts for most of this apparent correlation)! Who would have thought???
Note: This includes both foreign and S-Corporation profits.
Comparing domestic pre-tax profits with savings (notice: pre-tax corporate profits are NOT at record highs)

Quick Scatter chart with annual domestic corporate profits vs savings (this is annual, not quarterly, since I don’t have historic quarterly data)

If anything, this would suggest that higher savings are correlated with higher profits.

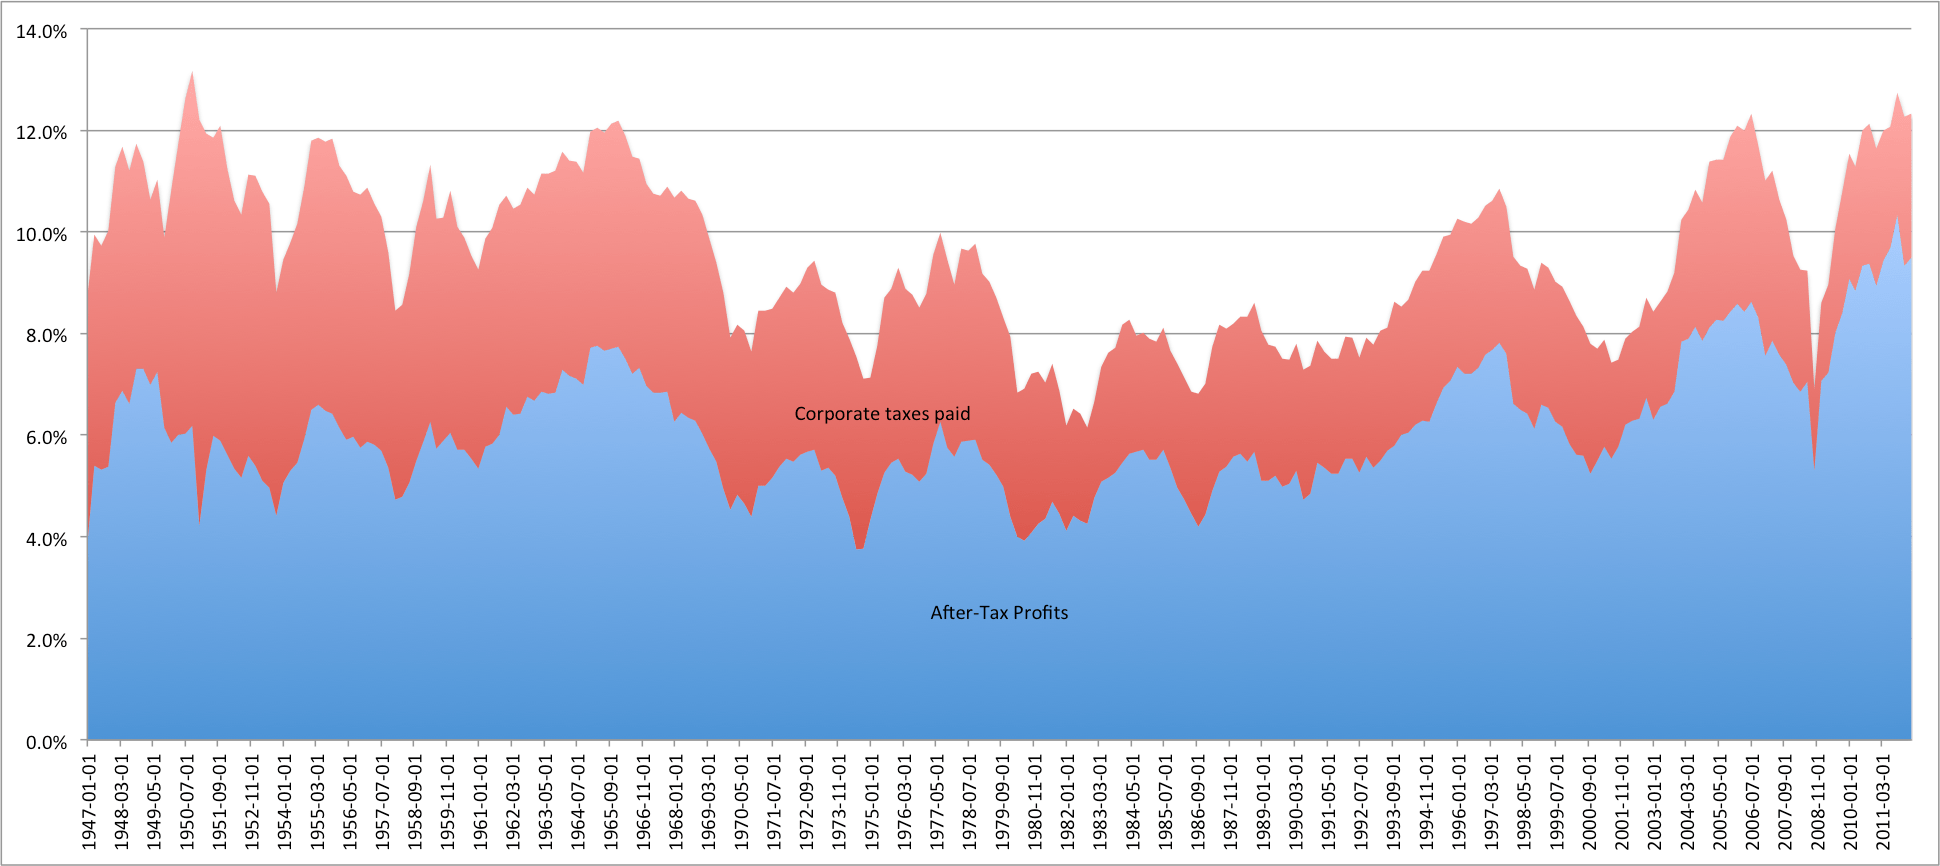
I am including the CBO chart to show that:
1: the taxation of domestic corporate profits hasn’t changed that much. If anything, this under-states the recent burden, relative to the the 80s, since a large and growing share of profits are being taxed at the individual level (S-Corporations), i.e., they are being factored in the denominator (profits) but not the numerator (corporate taxes paid).
2: my analysis of the NIPA corporate profit data matches their analysis almost exactly for the period they produced this data.
In short, the analysis conducted by BI and company is extremely misleading. Deficit spending and dissaving may have some short term stimulative impact, but it’s ultimately a net negative. These funds will have to be repaid in the future, both by tax payers and individual consumers, which will slow future economic growth.