IRS report on changing AGI income definitions
The Tax Reform Act of 1986 (TRA 86) made extensive changes to the calculation of AGI beginning with 1987. These changes made necessary a revision of the calculation of the 1979 Income Concept, in order to make tax years beginning with 1987 comparable to the base years, 1979 through 1986. The law changes limited the deduction of passive losses and eliminated unreimbursed employee business expenses and moving expenses as “adjustments” (moving expenses changed back for 1994) in figuring AGI beginning with Tax Year 1987. Since passive losses had been fully deductible for both income measures prior to 1987, the disallowed passive losses had to be deducted in the 1979 Income Concept calculation for tax years after 1986. Some income items, such as capital gains, that had been partially excluded from AGI under prior law were fully included. The new law also eliminated or restricted some deductions. Therefore, if AGI is used to measure income, comparisons between 1986 income and tax data with that for years after 1986 are misleading. A more accurate comparison can be made using the 1979 Income Concept because it measures income in the same way for all years. Table B shows total income and selected tax items for 2009 using AGI and the 1979 Income Concept, classified by size of 2009 income. Before TRA 86 became effective, a comparison of income measured by AGI with that measured by the 1979 Income Concept showed significant differences at income levels of $200,000 or more.
But, with the elimination of preferential treatment of various income items by TRA 86, such as the exclusion of a portion of capital gains, much of the difference disappeared. Under tax law prior to 1987, the capital gains exclusion accounted for the largest difference at the higher income levels between the two income measures. For 2009, 1979 Concept income was 2.2 percent higher than income as calculated using AGI. This difference was primarily attributed to the inclusion of more than $343.4 billion in nontaxable pensions and annuities (including IRA distributions) in the 1979 Income Concept. Income for all returns, using the 1979 Income Concept, decreased 8.2 percent for 2009; income for the $200,000 and above group decreased 20.0 percent. Total income tax for all returns decreased 16.1 percent in 2009 after an decrease of 7.5 percent in 2008; and total income tax reported for the $200,000 and above income group decreased 19.3 percent for 2009, down from the 12.0 percent decrease for 2008. The average tax rates (income tax as a percentage of total income) for each income class and both income concepts for years 1986 through 2009 are shown in Figure 4. For the population as a whole, average tax rates for 2009 (based on the 1979 Income Concept) were 1.1 percentage points lower than those for 2008. Between 1986 and 2009, the average tax rates declined in all income categories except the $1 million or more category.
Average income tax rates using consistent 1979 Income Concept (direct from IRS data table)

Observation: The very top income groups are paying roughly similar taxes as they paid in 1986 when we actually use a consistent methodology like this. Lower to middle income groups are paying substantially less and the methodology makes much less difference for them (AGI and TIC render similar results).
Comparison between AGI and Total Income Concept tax rate for selected groups
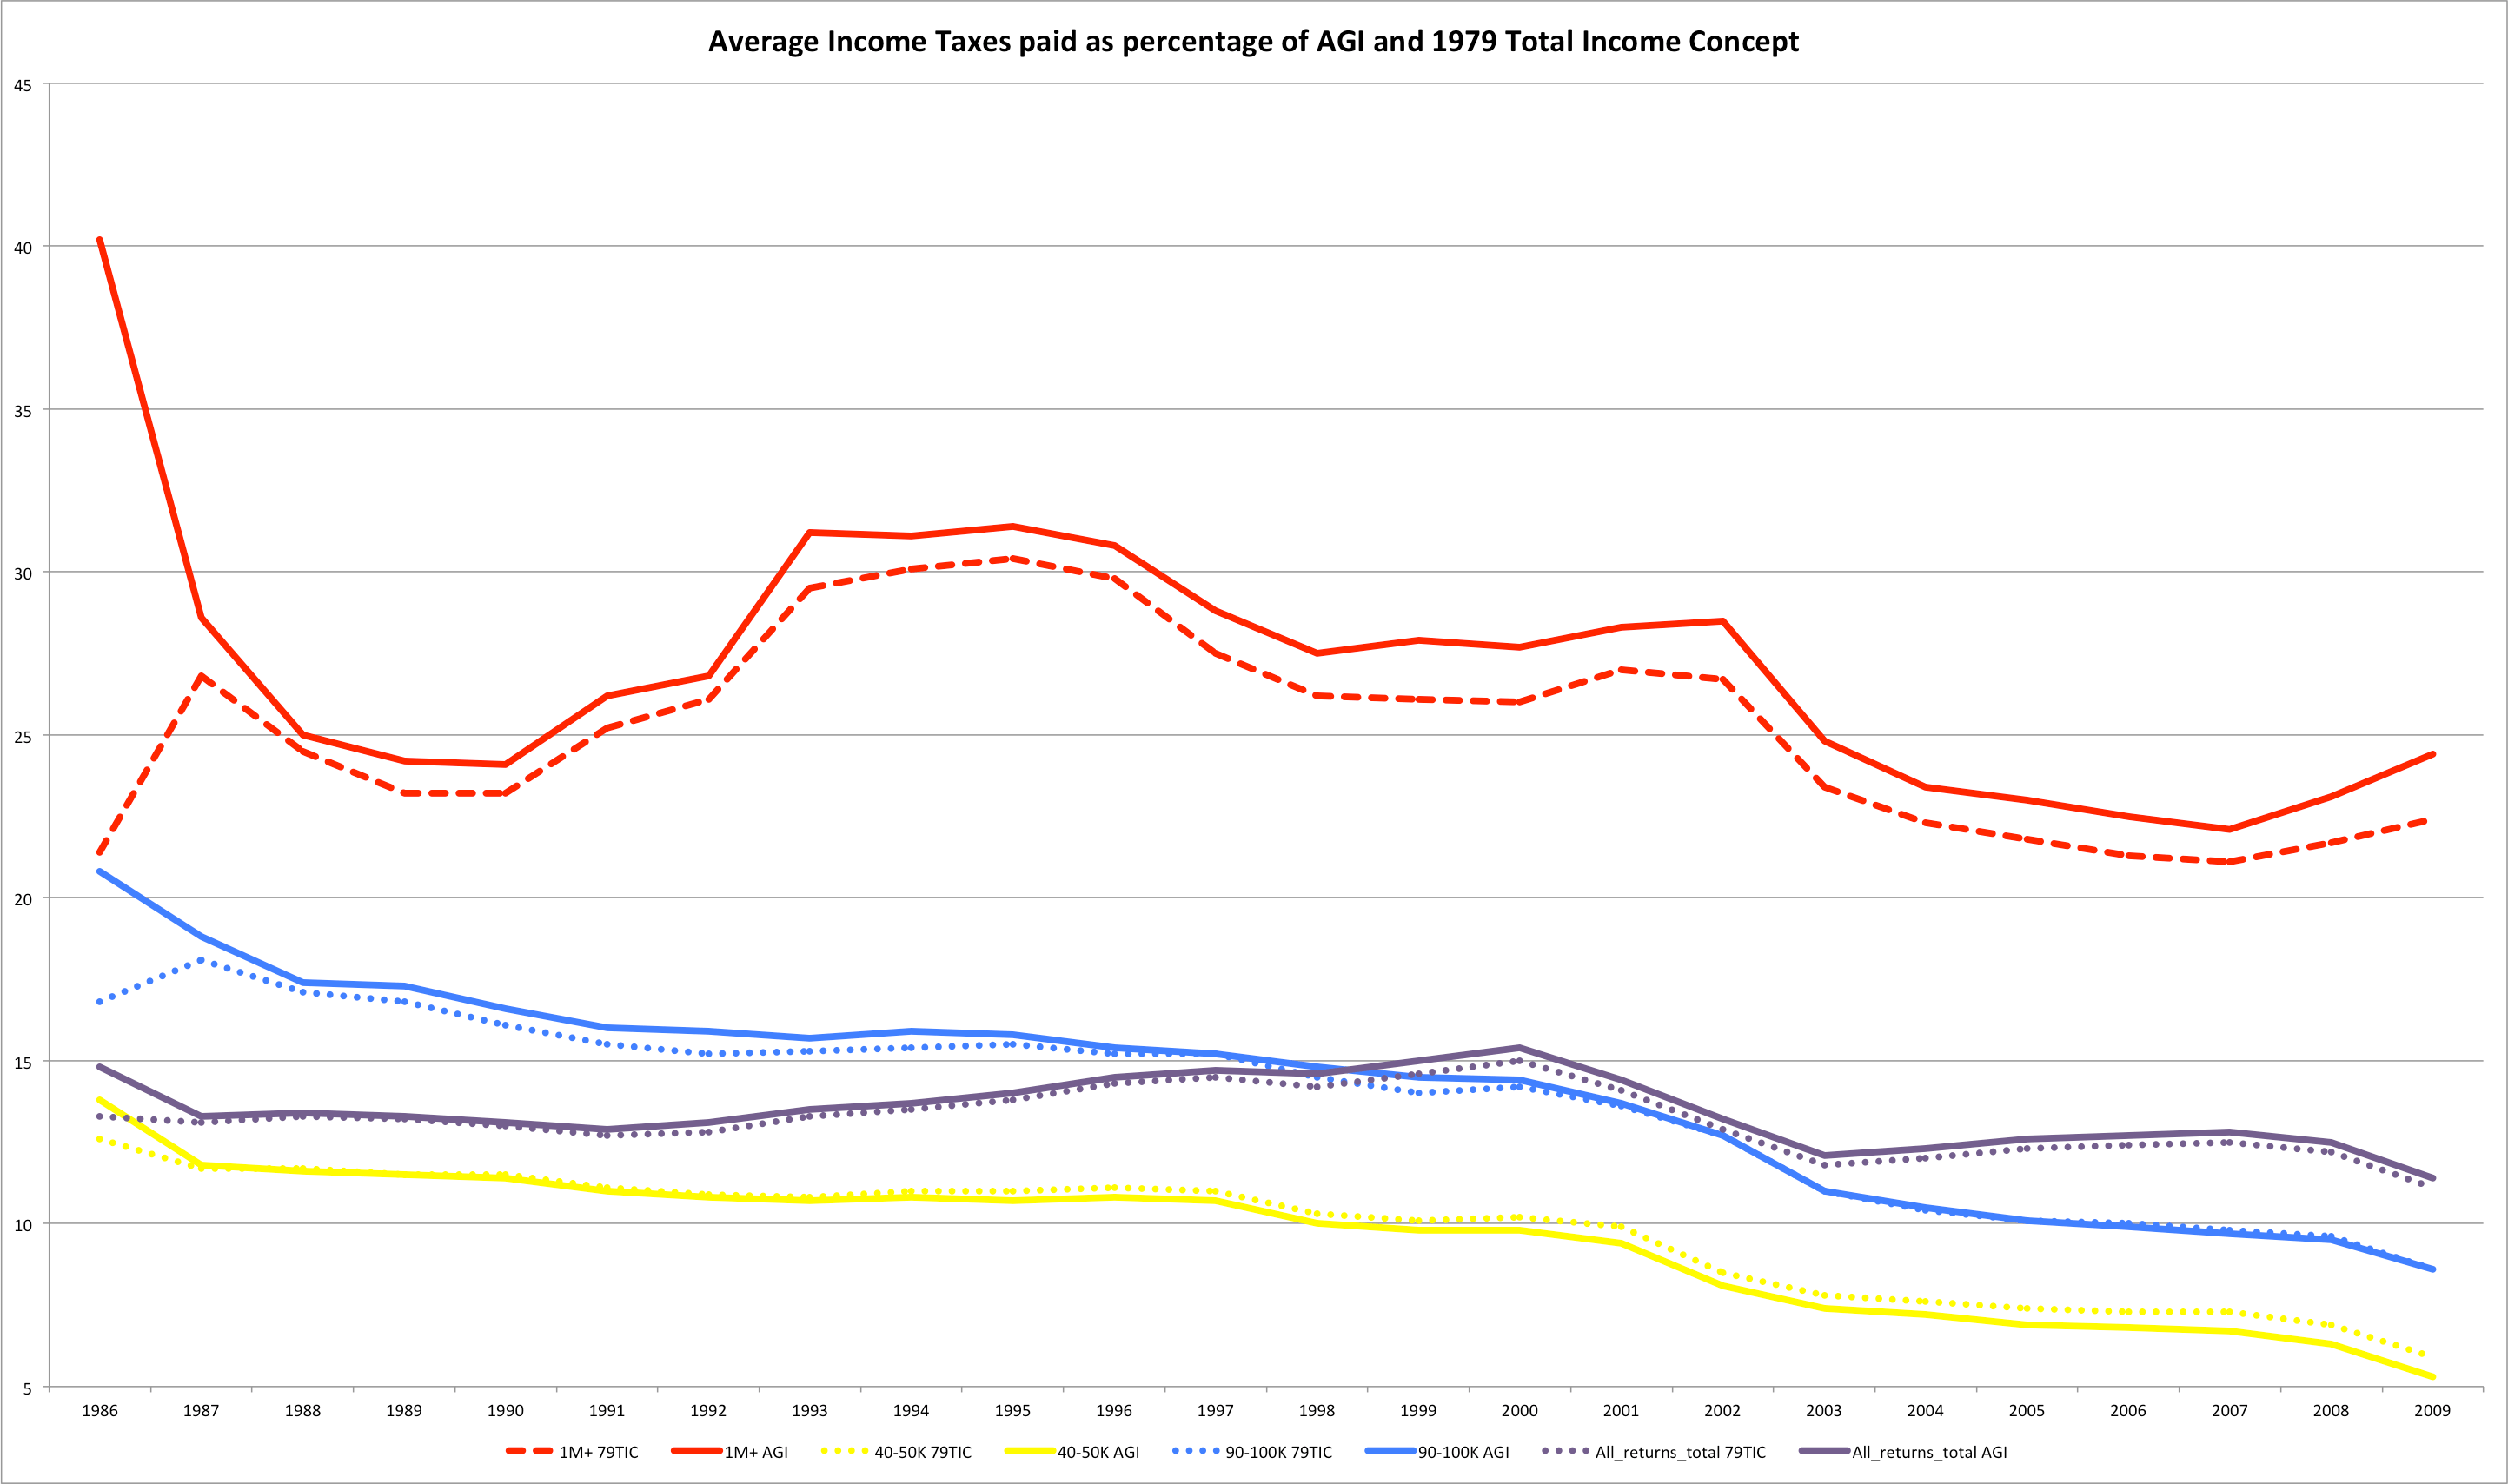
Notice how AGI and TIC lines actually converge much more closely after-tax reform.
Total income tax as percentage of AGI

Note: This is taxes paid as a percentage of the constantly changing Adjusted-Gross-Income concept that the IRS warns against. It’s also, not coincidentally, usually the one used by advocates of going back to the supposedly golden era when high marginal tax rates presumably collected much more taxes from the very rich [despite all the evidence].
Notice how similar the high income lines look here to the data reported by this CRS chart
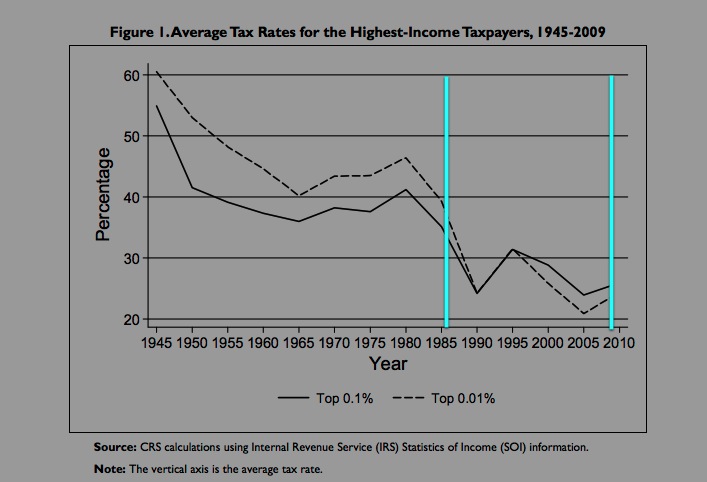
Although he doesn’t spell out his methods or even which taxes he’s including (payroll, CIT,…?), it’s highly likely that his analysis is simply naively dividing taxes paid by the AGI.
Some other charts produced directly by the IRS for the top 0.2%
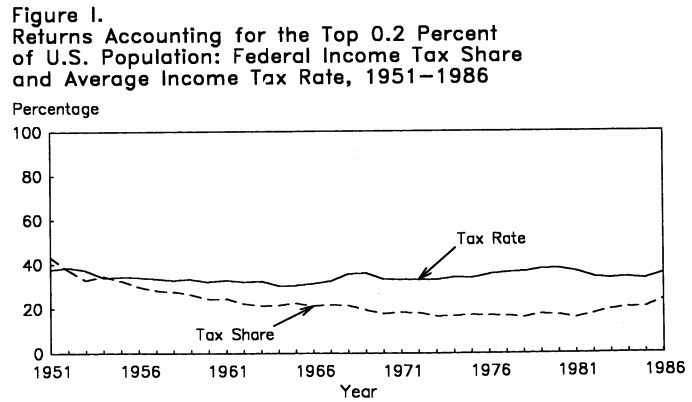
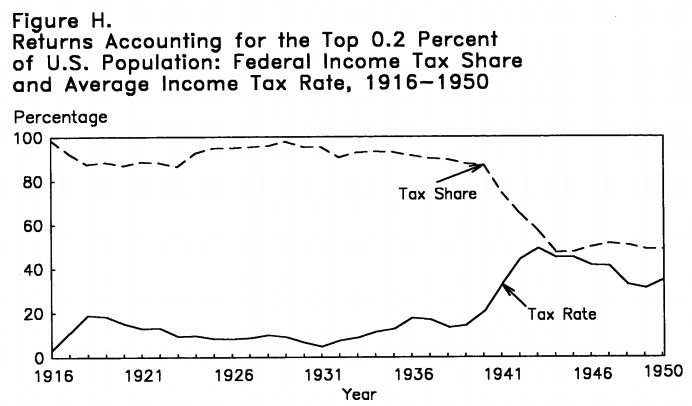
Note: The first chart (figure I, 1951-1986) is the income tax paid as a percentage of AGI [which changed significantly, but not nearly to the same extent that it did between 86 and 87]. The second chart (figure H, 1916-1950) is “net income” — which isn’t perfectly analogous to AGI. Nevertheless, you might observe that between the mid-40s and 1986 the average rate of the 0.2% averaged around 40% of AGI, which roughly corresponds to the more recent AGI chart above [and which, the data shows, AGI way over reported the effective tax rates in economic terms ( at least it did by 1986 )
Piketty and Saez — see table A3 (individual + payroll)
IRS data on effective rates. See figure E…
More IRS: see 1979 income concept, etc
IRS calculations of AETR for top 0.2% 1916-1950 and 1951-1986 @ Figure E, pg 46
Hi,
I really like your material and I’d like to use some of it for my public economics course. It looks like this comment software has my email, so please contact me directly.
Thanks,
JM
You’re welcome to use it.
Thanks