Many people believe that the rich once paid much more in taxes as a percentage of their income since top marginal rates were once much higher. The reality, however, is that a combination of relatively higher brackets, larger deductions, and tax avoidance and the like actually reduced the effective rates to MUCH less than is popularly believed.
The CBO published some data a few years ago to break down effective tax rates amongst higher income groups (they usually aggregate the top 1% as one big group), so here is a chart to actually reveal the truth.
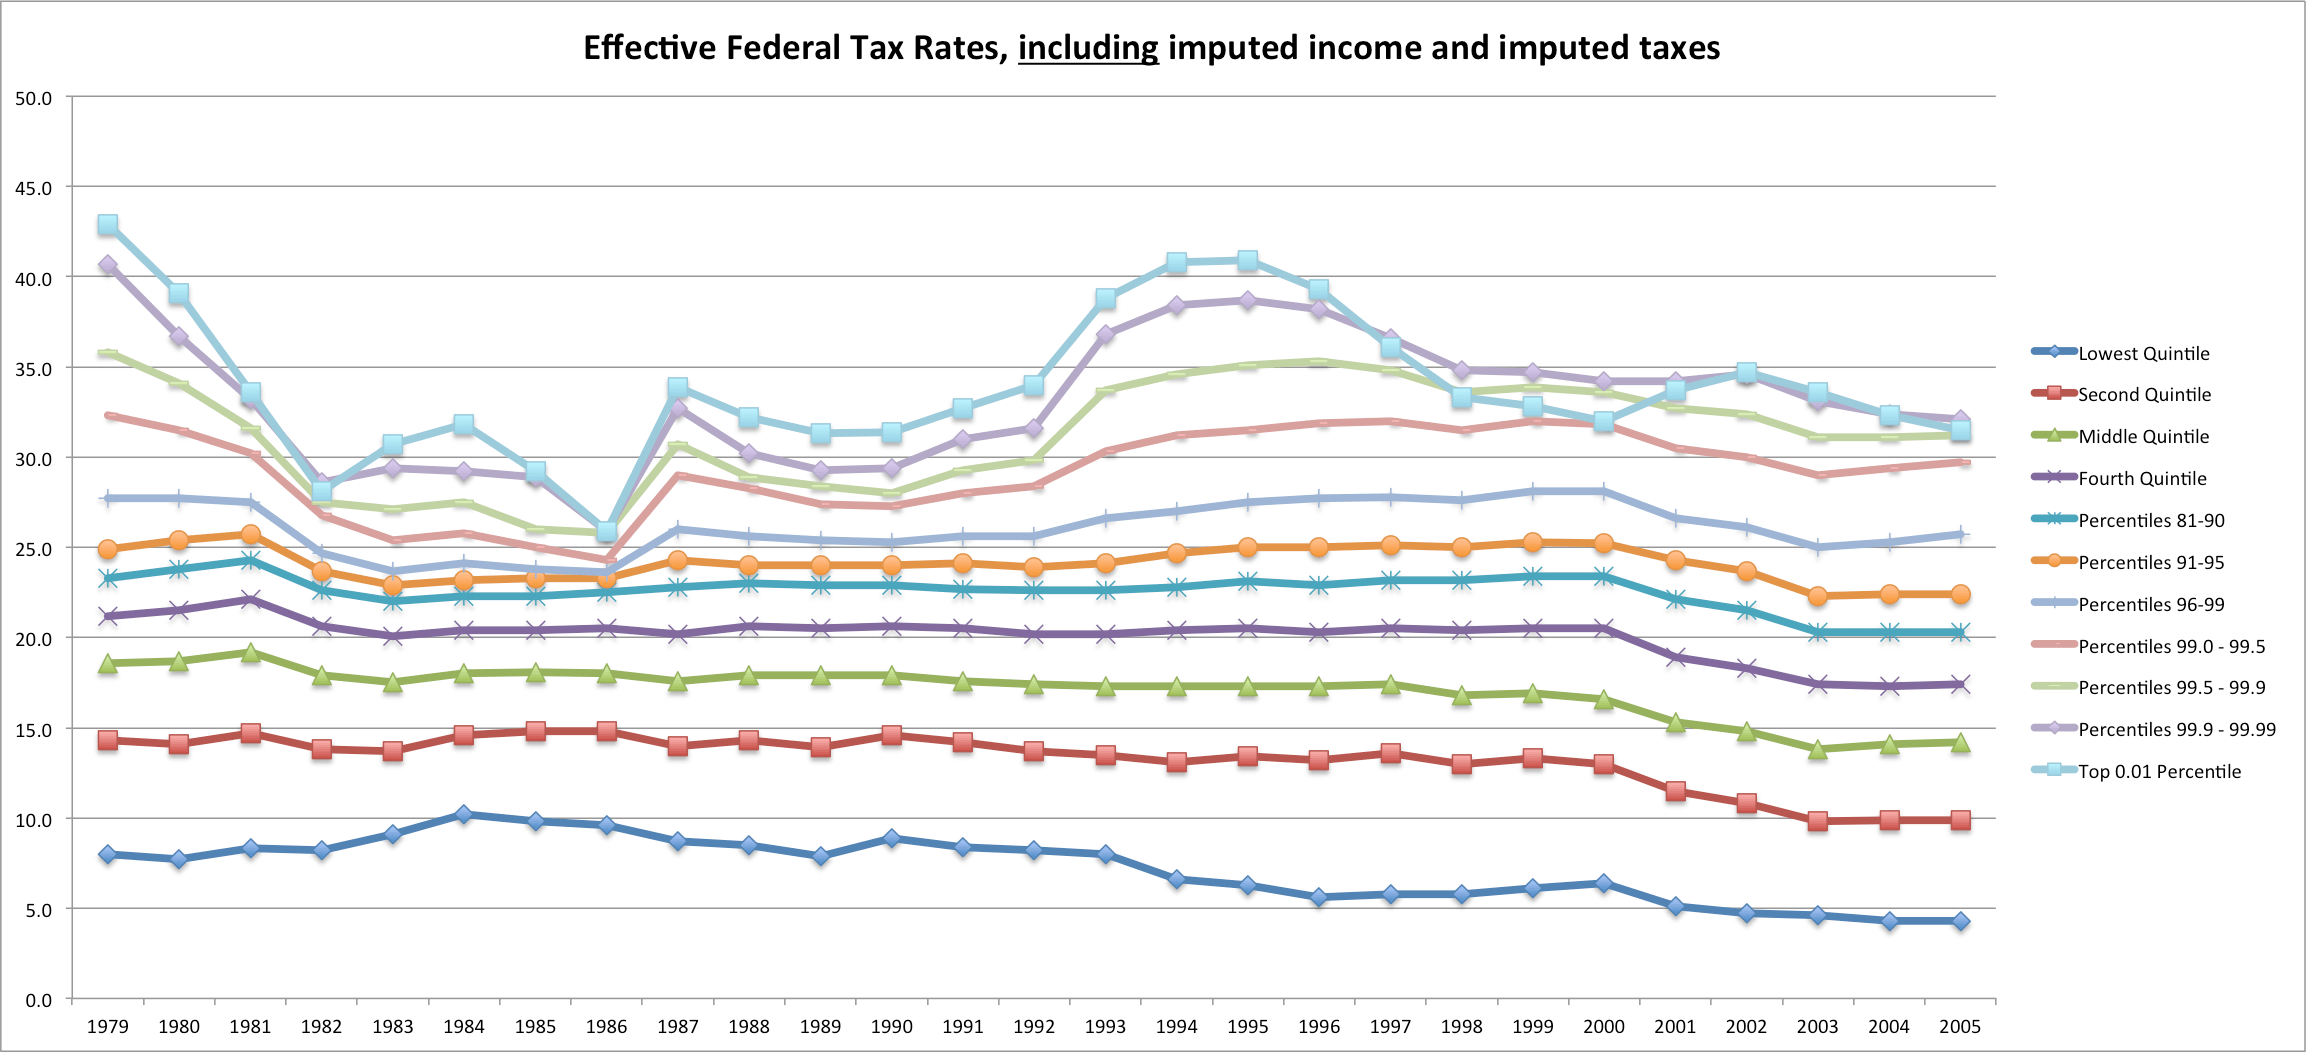
According to their calculations,the rich did pay a bit more in 1979 (the late 70s probably had abnormally high ETRs due to bracket creep and the like). That said, they also imputed 100% corporate income taxes to shareholders (mostly the rich) and the employer-portion of payroll taxes to both the numerator and the denominator [in other words, they assume that the tax payer would have had correspondingly more income and thus add both the the numerator and the denominator of this calculation]
Since many of these same progressives have trouble with this concept (e.g., they wish to assert that Romney only paid a ~15% ETR) I thought it’d be helpful to illustrate what this would look like if we subtracted both of these imputed income sources/tax burdens. This, in other words, would more closely resemble one’s ETR if they divided the total federal taxes paid by their AGI [although this also includes the miniscule burden added by federal excise taxes]
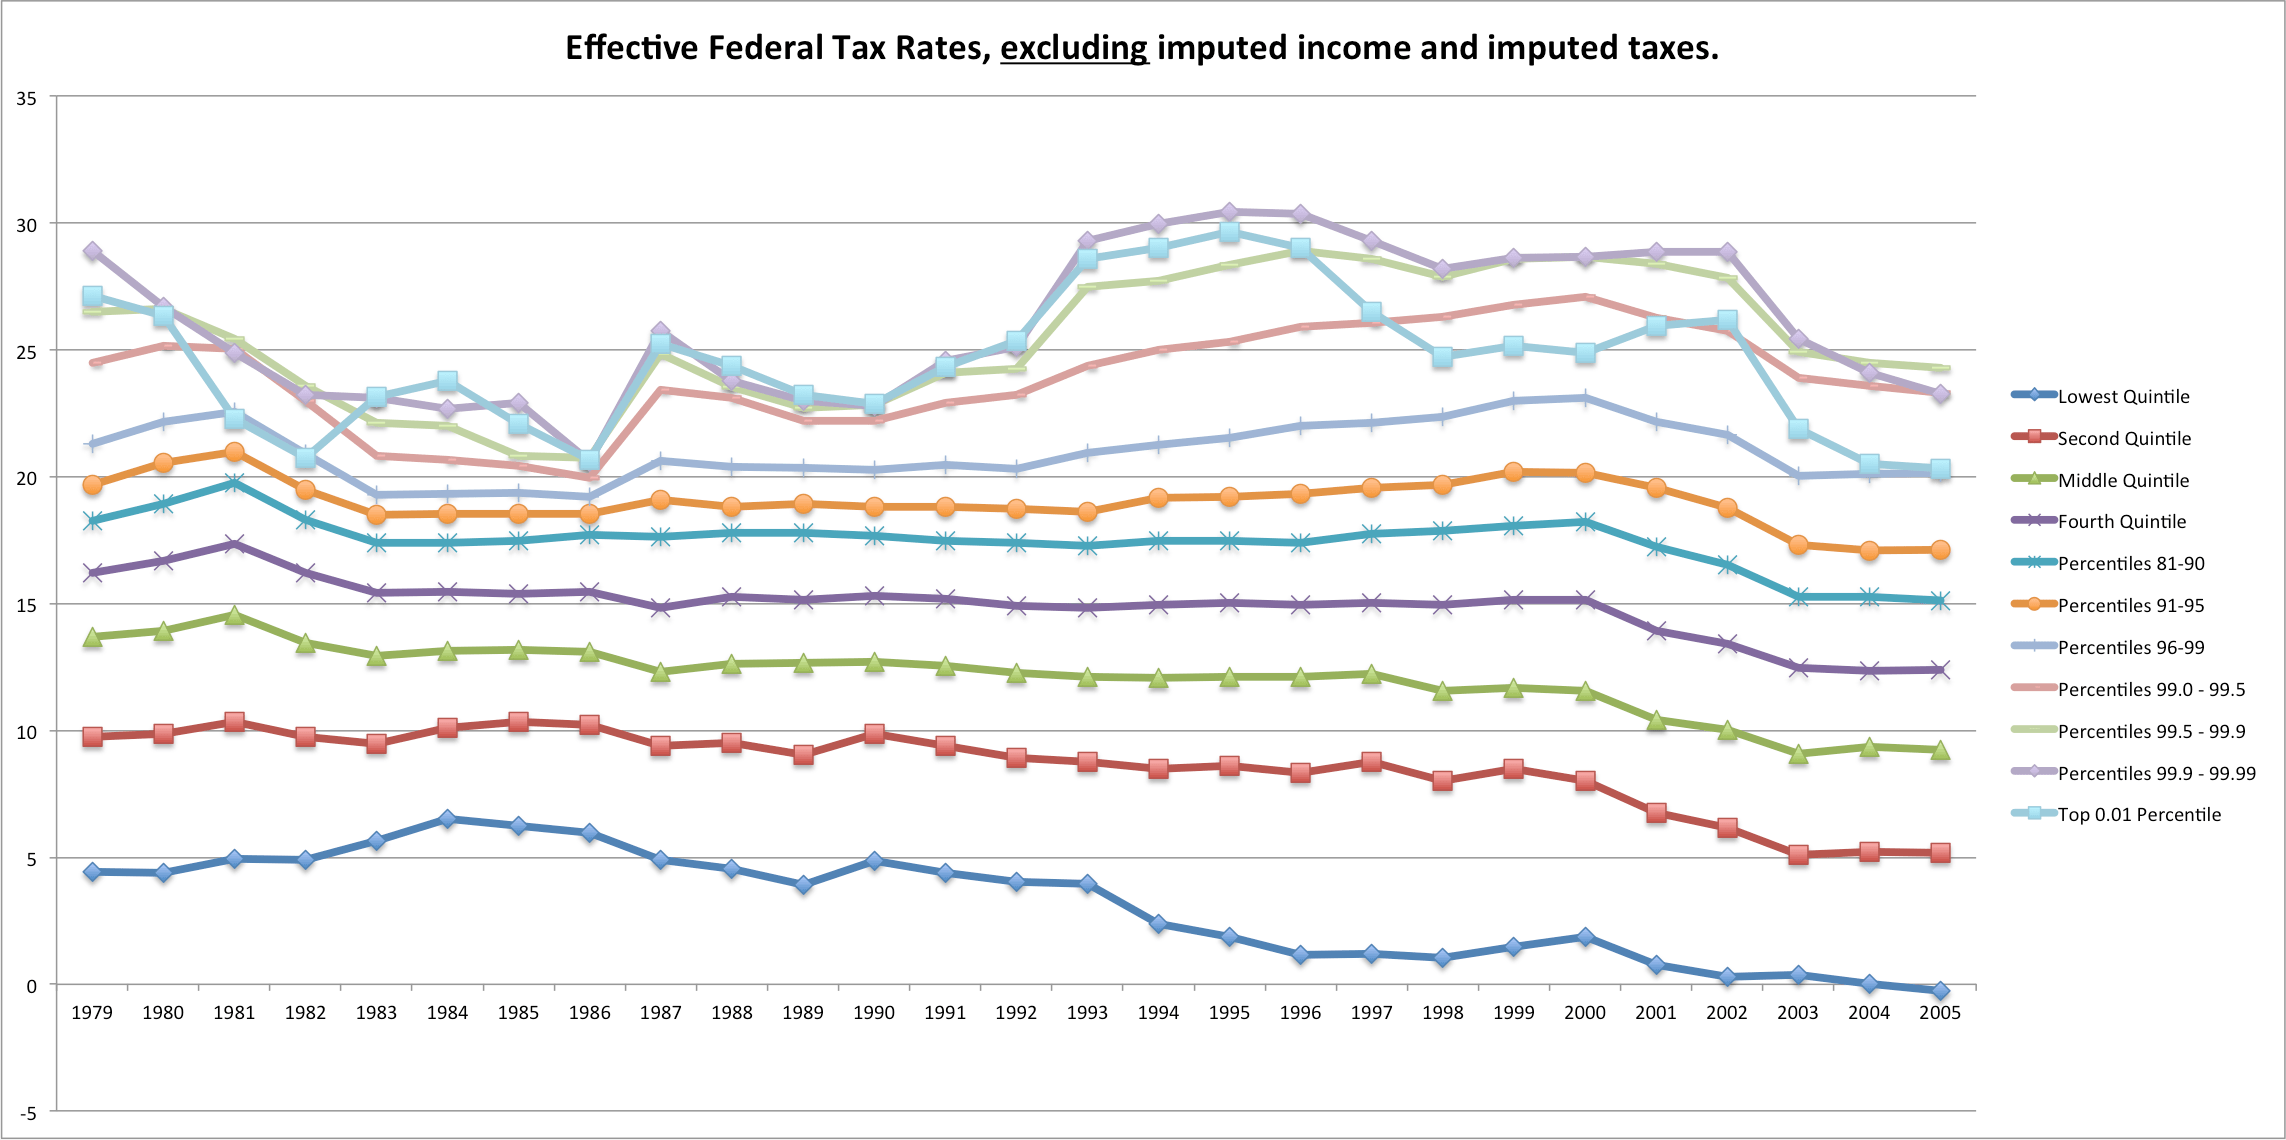
Although I think it’s essentially correct that the shareholders bear most of the economic incidence of this taxation, this chart better reflects the intuitive/liberal understanding of tax burden (which is largely based on who is paying the taxes directly).
In any event, setting aside market volatility and other compositional changes, this pretty clearly demonstrates that the rich are paying about as much (as a fairly broad cohort) as they used to.
Please note
The adjusted ETR of the top 0.01%, who derive substantially larger shares from capital incomes, actually drops below marginally lower income groups [though still much higher than most] in most years. The reason for this is because the combined tax rates on capital incomes have essentially always been higher on average than taxes on ordinary incomes.
Further, the top effective rate flattens out significantly to show no trend. The reason behind this is that the composition of very high income groups has actually shifted AWAY from capital incomes, especially C-corp derived incomes [from an average of mid 70s to mid 50s– derived from the same CBO data and well documented elsewhere].
It is actually possible that the effective rates on both corporately-orginated capital incomes and labor has actually increased somewhat but that the changing composition away from capital incomes has actually held this down to be almost level. In other words, changes outside of the tax code itself may have prevented top ETRs from climbing more than changes to the tax code itself have….