

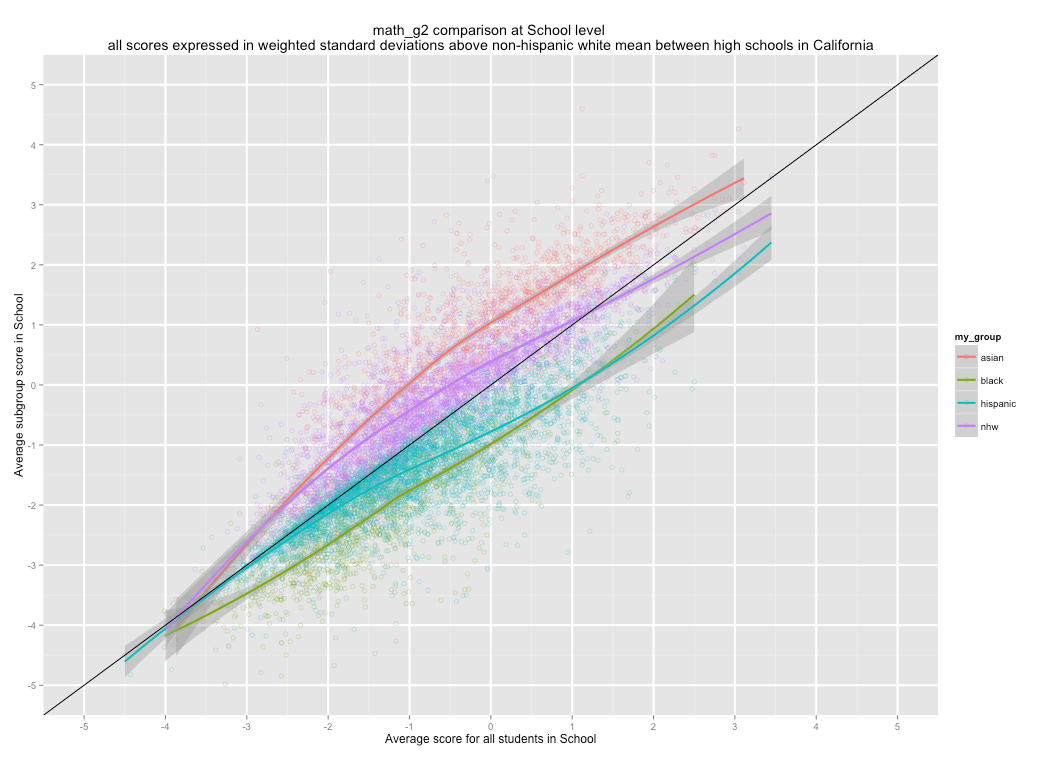
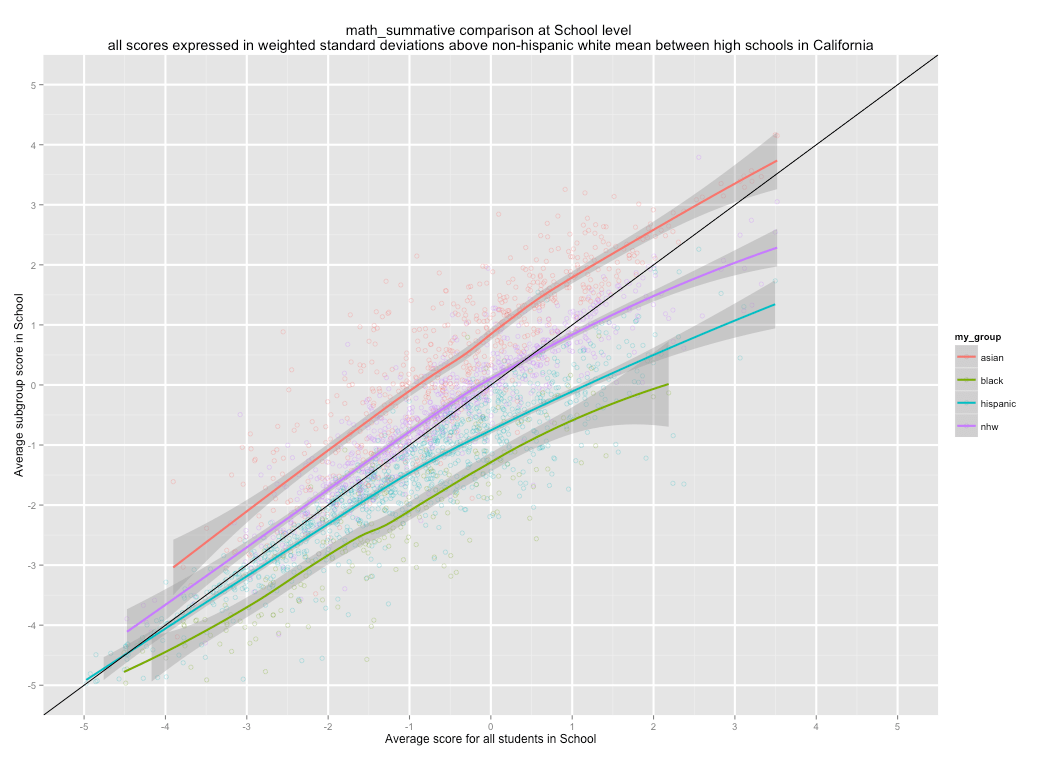
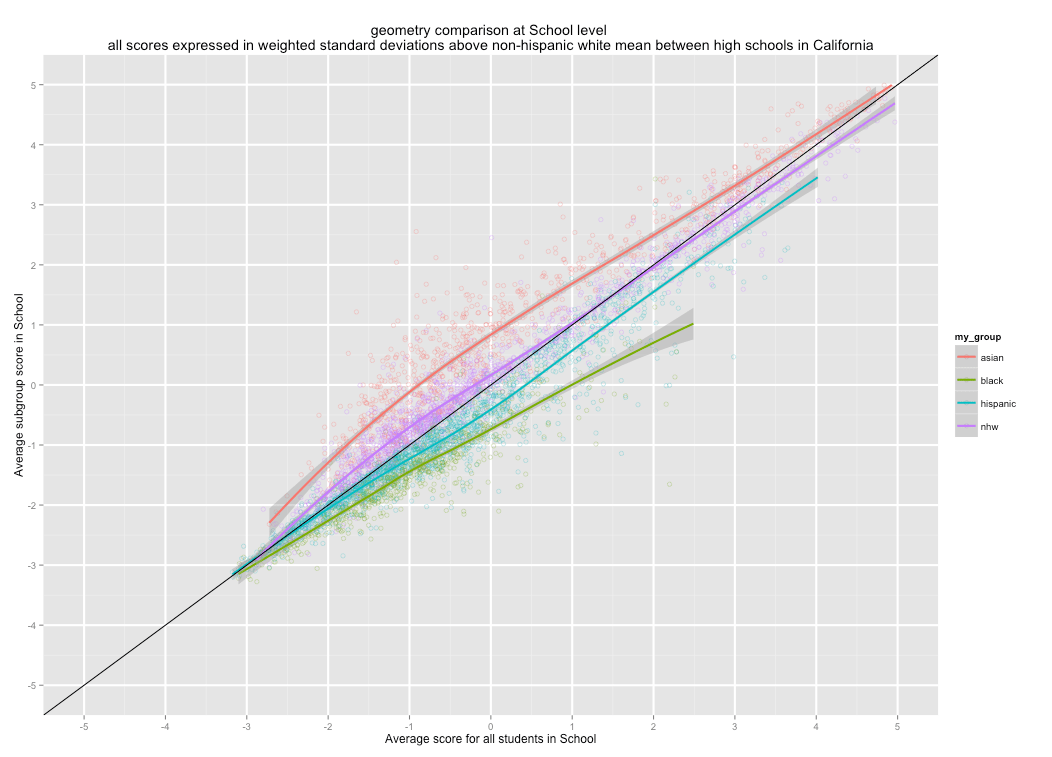
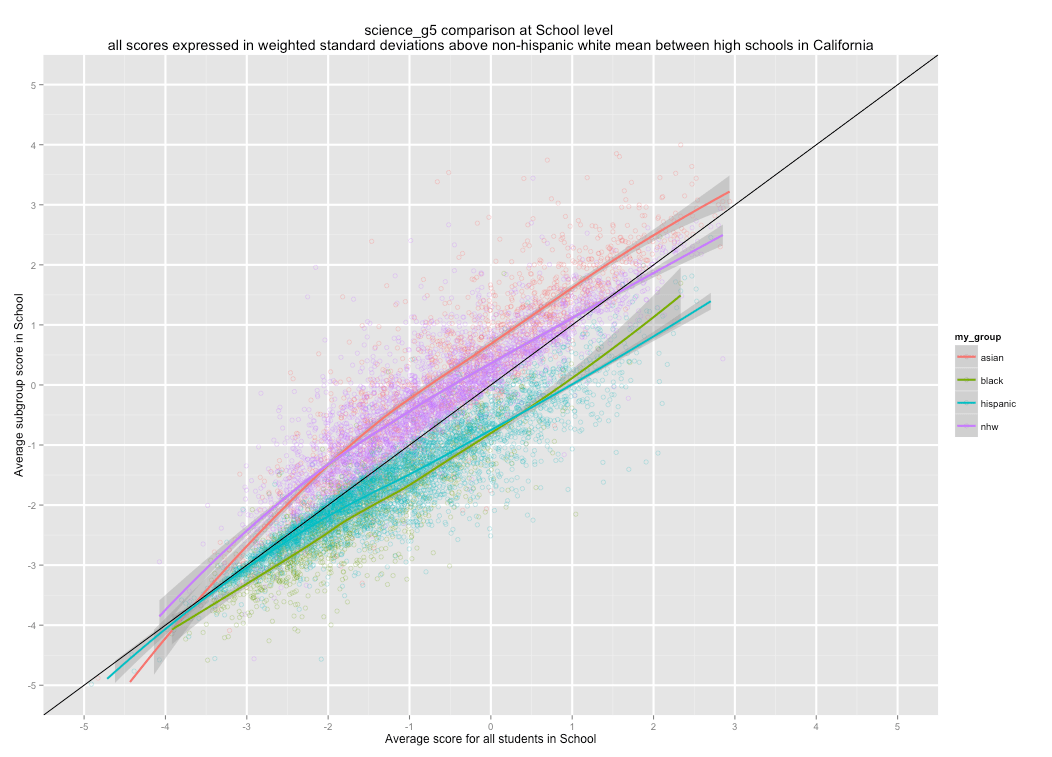
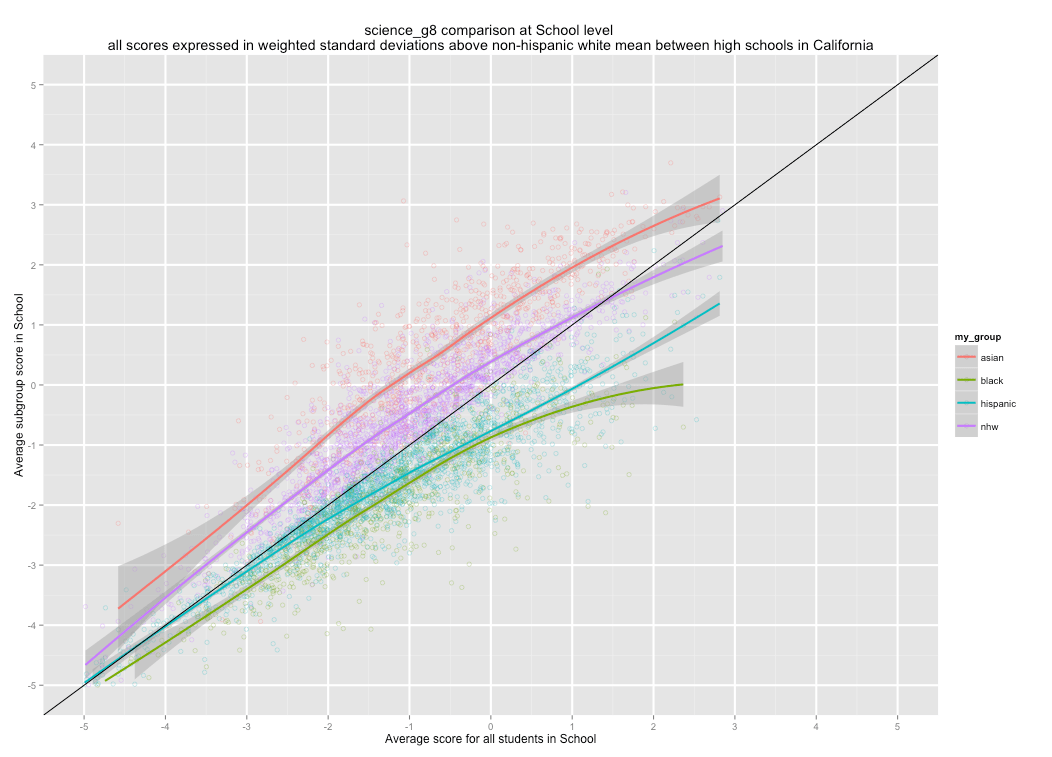
In a prior post I compared the performance of various ethnic groups directly against each other within the same schools. That method has the advantage of reducing the effect of racial/ethnic composition from influencing the apparent relationship between each groups performance within school environments. However, there aren’t always enough of both groups to clear the minimum reporting requirements for student privacy and the school average is a better indicator of “school quality” in some peoples’ minds. Below I simply took the reported average for all students on the x-axis so that I could compare multiple groups at once.
I do not believe that this is a particularly good way to view the data, since it’s confounded by racial/ethnic composition and sorting by education levels (despite the obvious correlation), but if you do happen to think that the average score is a particularly good measure of “school quality” this approach might be eye opening.
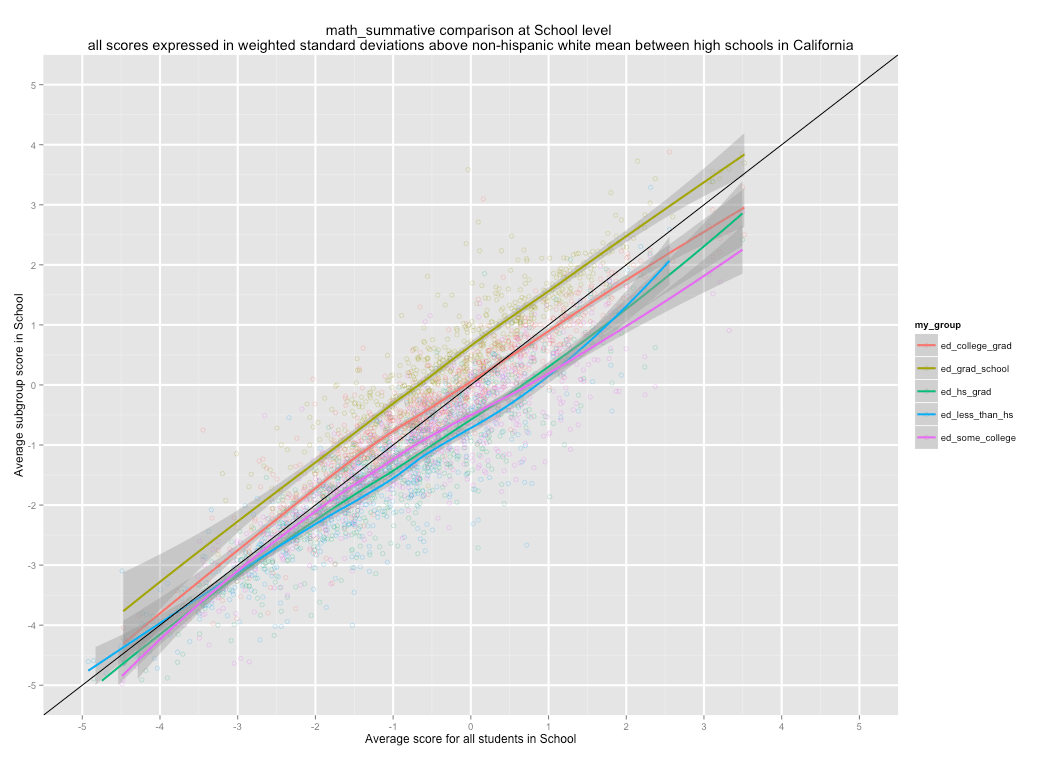
I also plotted this same data for poor and non-poor blacks and whites and (all race/ethnic) scores by parental education level below. You’ll need to scroll down a ways to see it though.
English
English Grade 2

English Grade 4

English Grade 6


English Grade 8

English Grade 10

English Grade 11

Maths
Math Grade 2

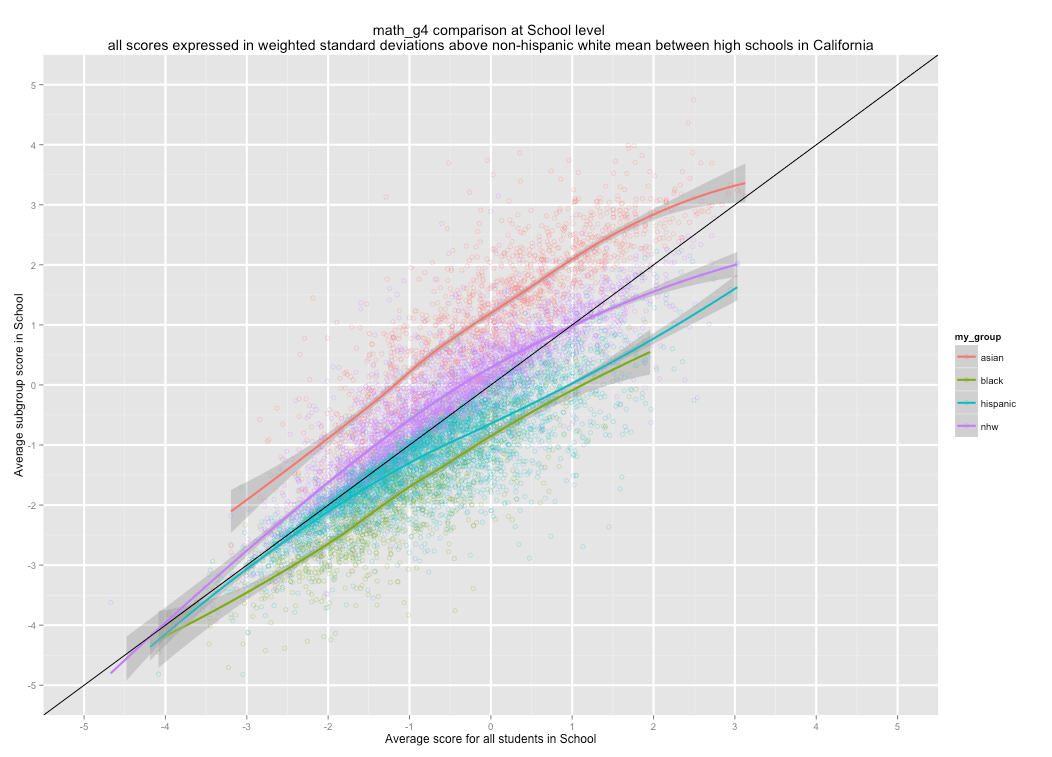
Math Grade 4
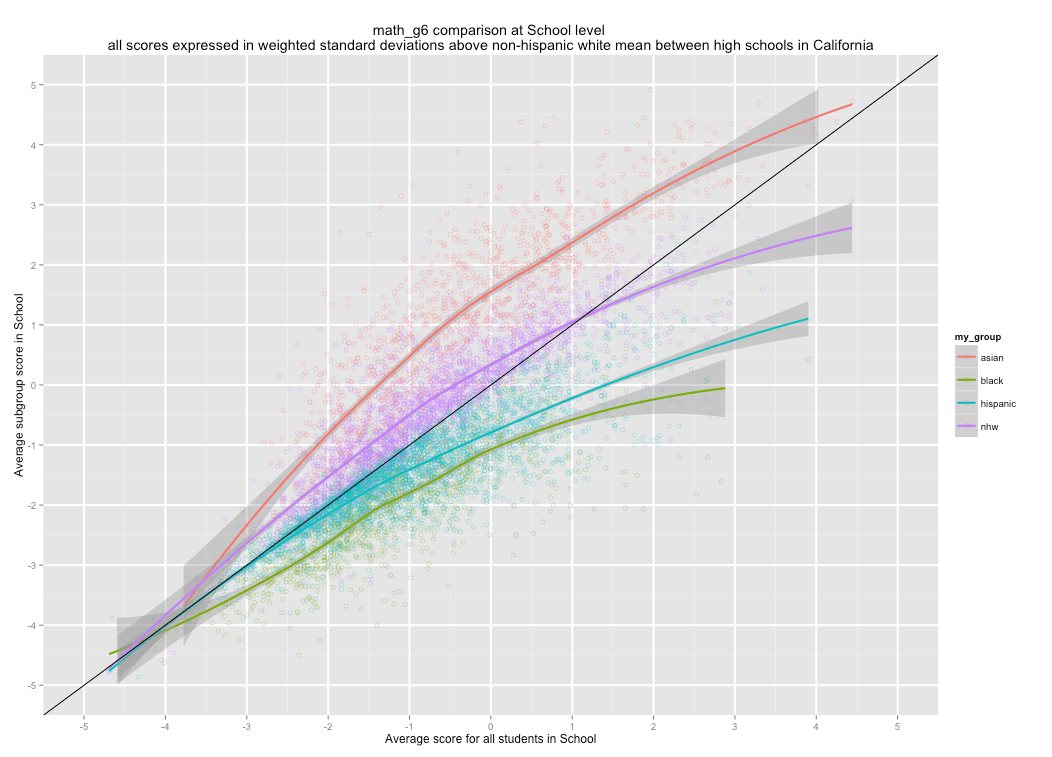
Math Grade 6
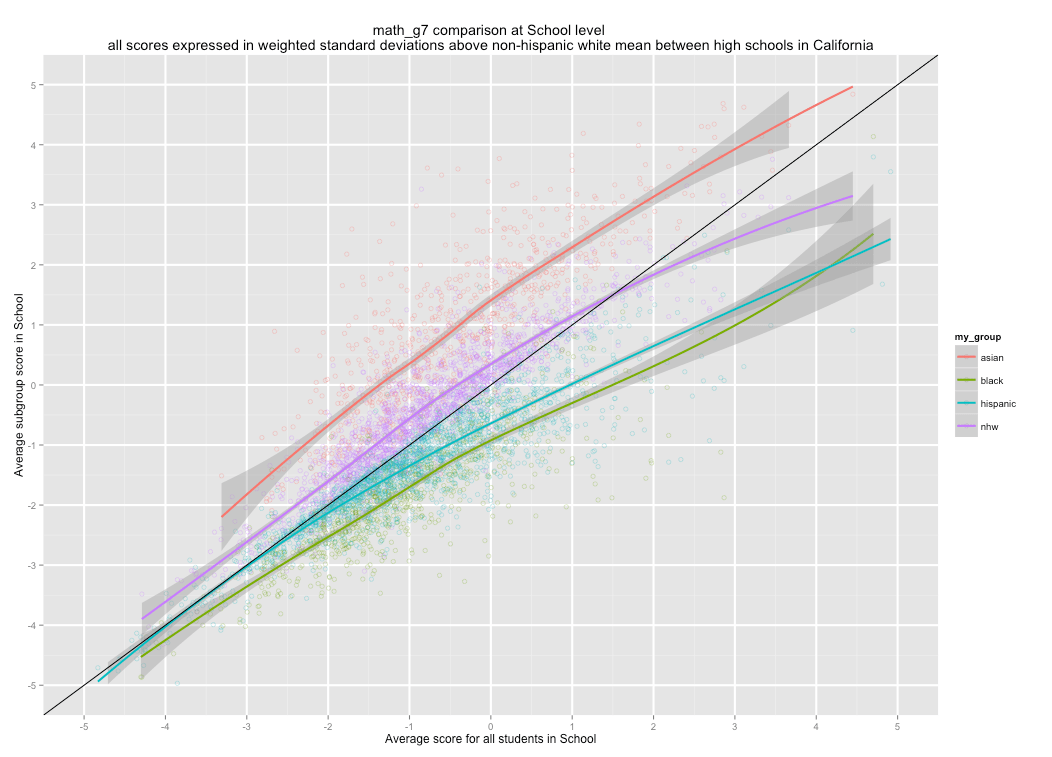
Math Grade 7
Math summative (grade 9-11)
Algebra I

Algebra II

Geometry
Sciences
Science Grade 5
Science Grade 8
Science Grade 10

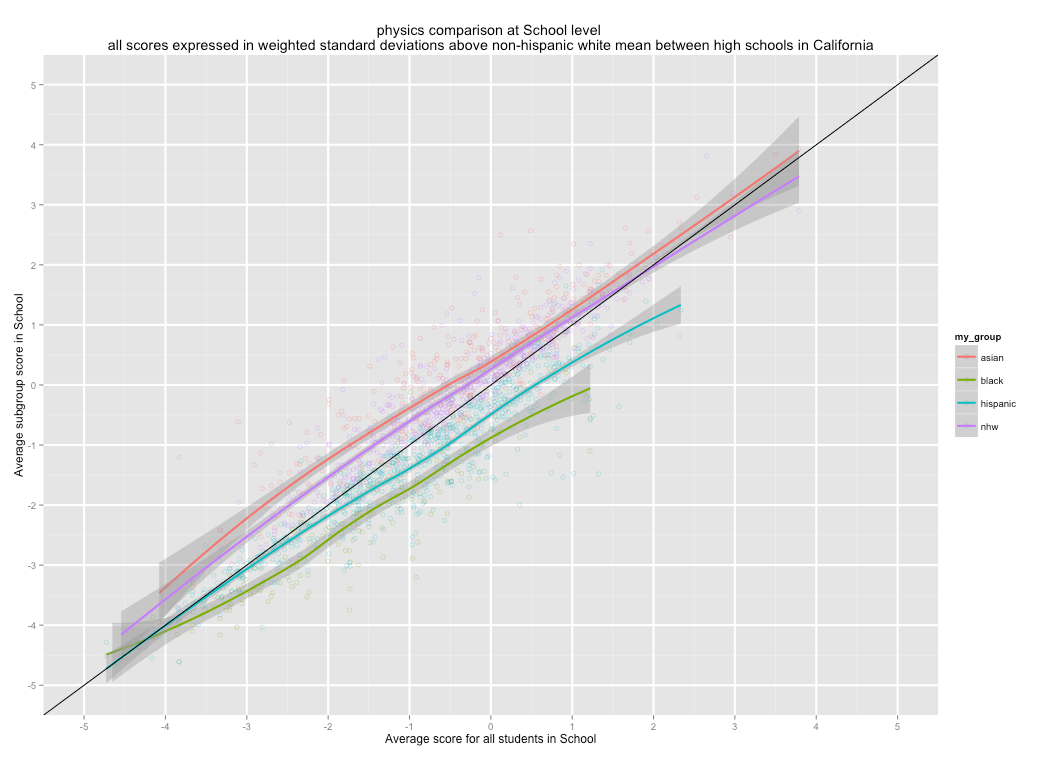
Physics
Earth Science

Biology

Chemistry

History
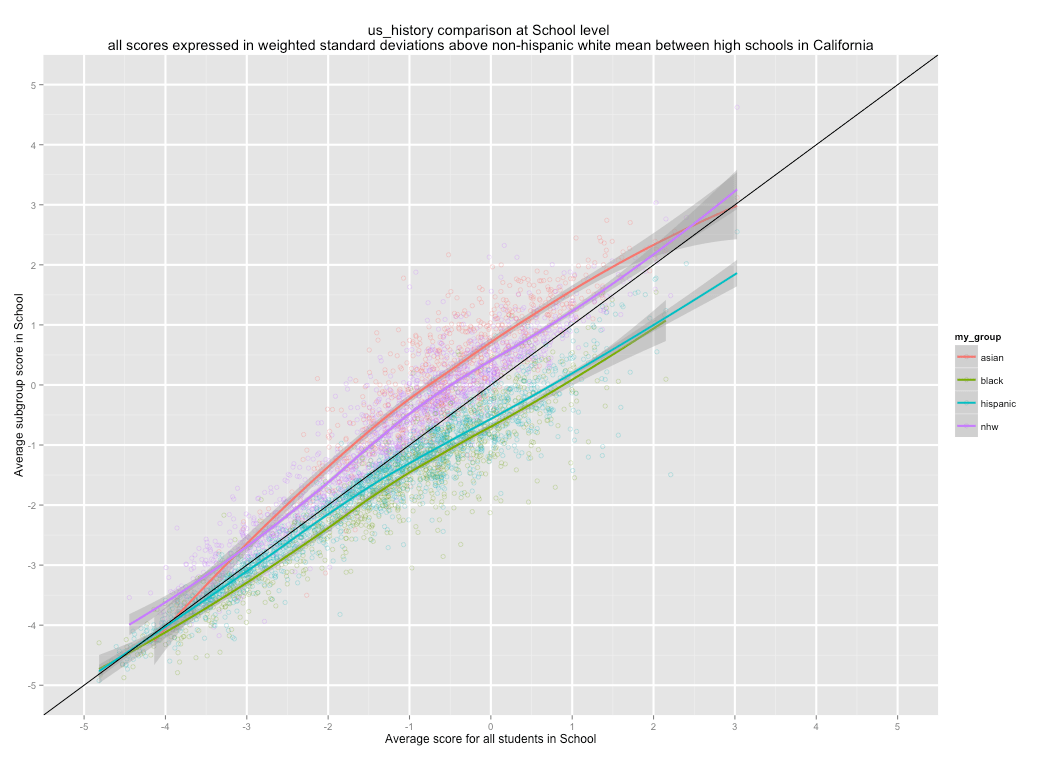
U.S. History
Some black & white comparisons with SES measures
Math Grade 2
Math Grade 6
Math Grade 7
Math Summative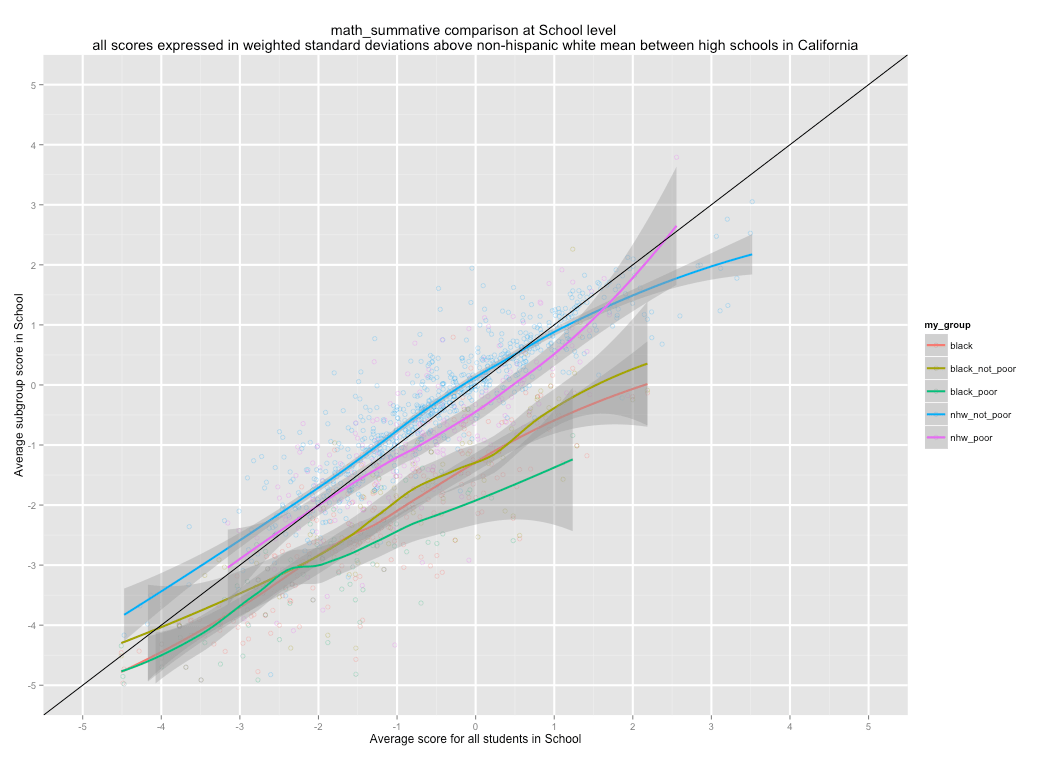
Algebra II

English Grade 2
English Grade 6
English Grade 9

U.S. History

Physics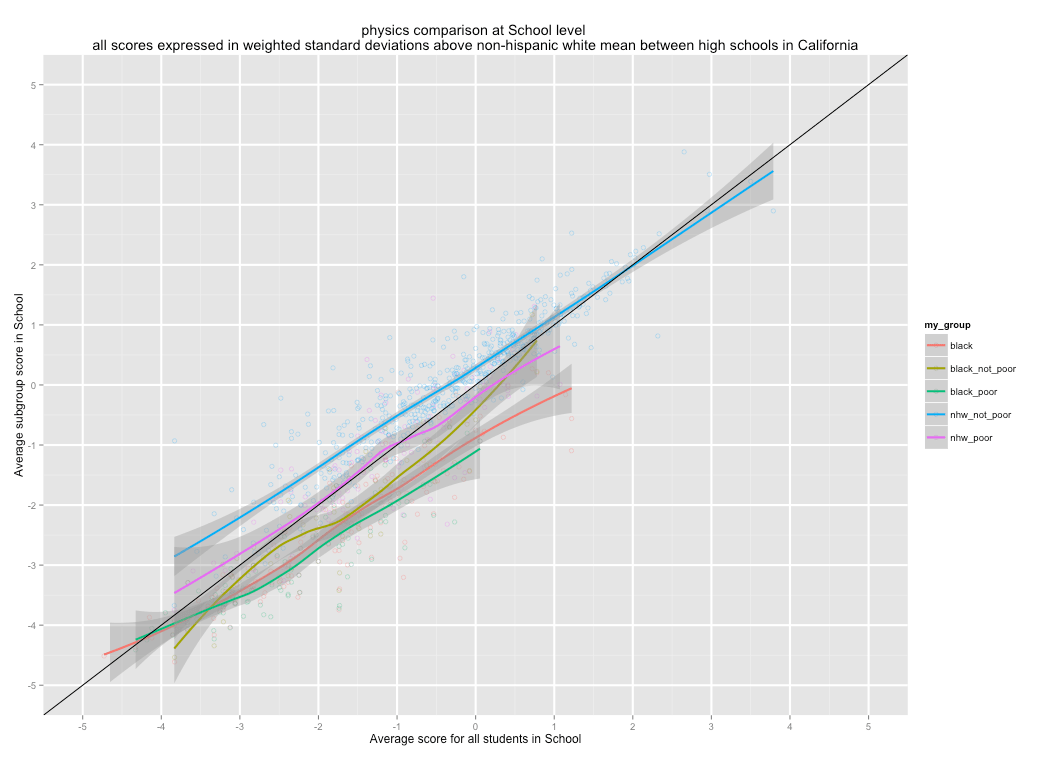
Some comparisons by parental education levels (all races/ethnicities included)
English Grade 2

English Grade 4

English Grade 6


English Grade 10

U.S. History
Math Grade 2


Algebra I

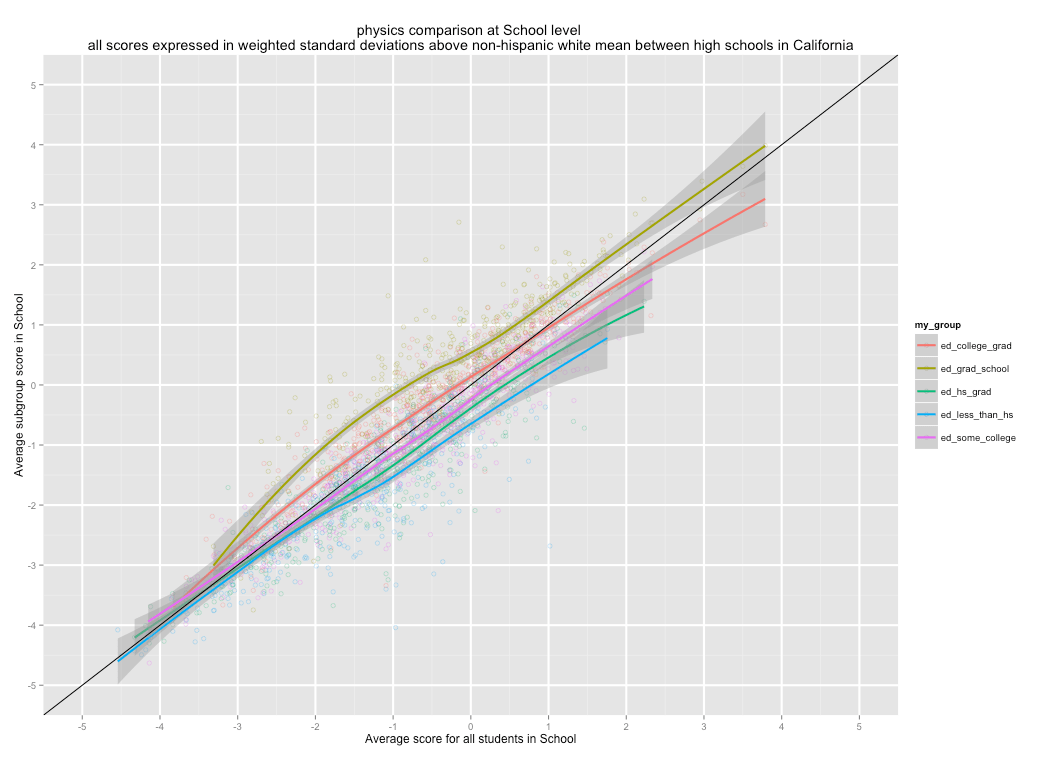


You might note that the better the average score the larger the apparent difference between education levels. This “effect” is probably somewhat real, but it is likely confounded by race/ethnicity too, as in, the “educated” on the left side of the distribution are apt to be proportionately more black and latino than on the right side. There are also meaningful differences in the academic rigor behind different levels of credentials (e.g., CalTech physics PhD != 3rd tier U. education PhD) and people sort along these lines within and between school districts.