

To exploit some of my prior work with California’s test score data, I decided to extend this analysis to SAT, ACT, and AP scores in the state of California, i.e., to compare the relationships of these different tests within and between schools.
Notes/Caveats:
- To achieve more stable results with schools with small numbers of test takers I averaged 2-4 years worth of test score data together.
- Unfortunately, AP results are not broken out by subject (some are much harder than others and there are apt to be different test taking patterns at different sorts of schools)
- SAT/AP/ACT data is not available by race/ethnicity
ACT vs SAT (r=0.97)
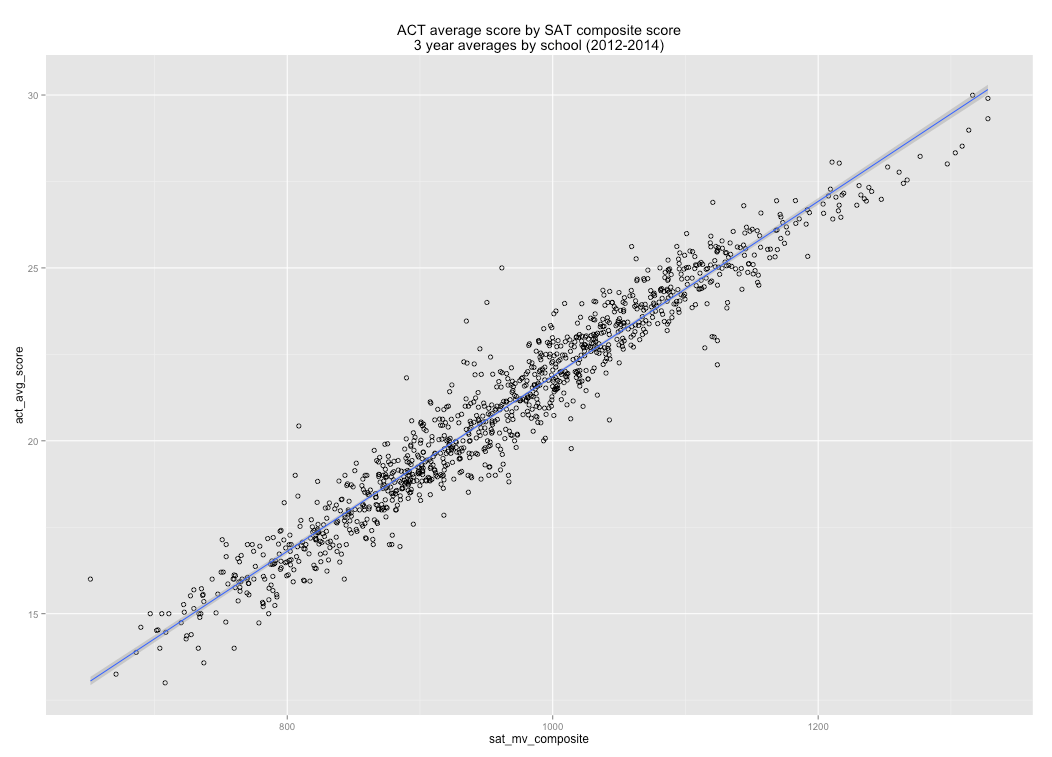
[It’s almost like they’re testing the same construct…. :-)]
SAT by English grade 11 (r=0.84)

SAT by Science Grade 10 (r=0.81)

SAT by World History (r=0.79)

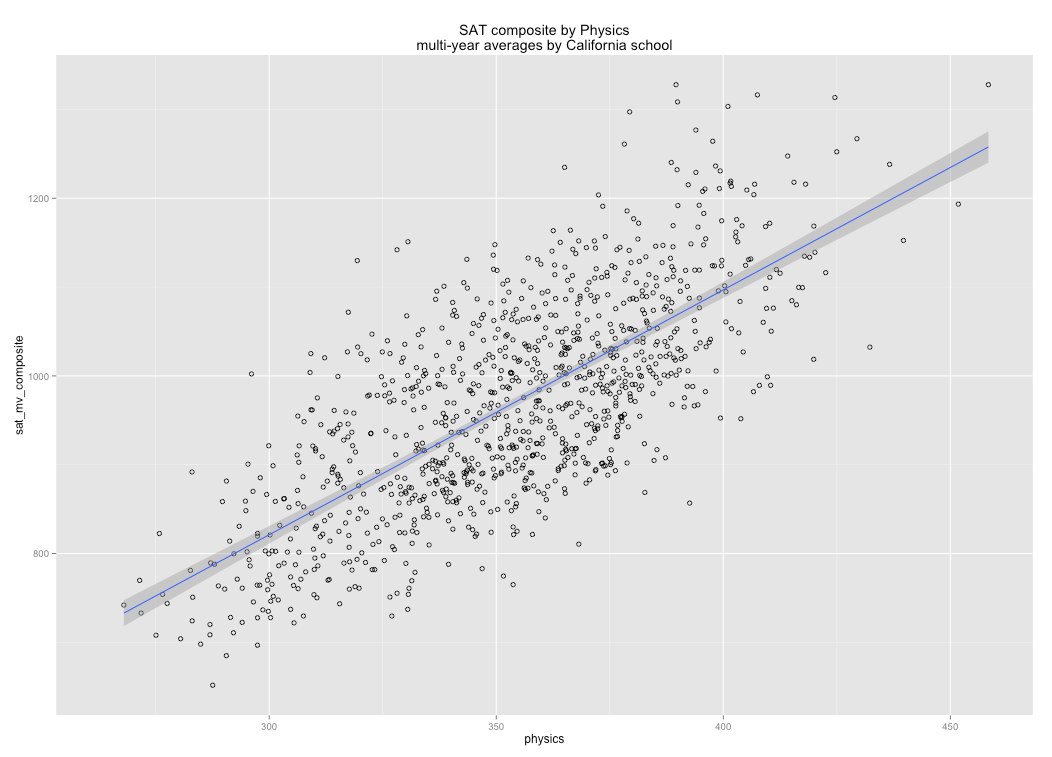
SAT by Physics (r=0.73)
SAT by Algebra I (r=0.56)

SAT math by Algebra I (r=0.57)

SAT by Algebra II (r=0.75)

SAT math by Algebra II (r=0.79)

AP Average score by Algebra II (r=0.70)

AP average score by English Grade 11 (r=0.72)

AP average score by Science Grade 10 (r=0.70)

AP by SAT composite (r=0.82)

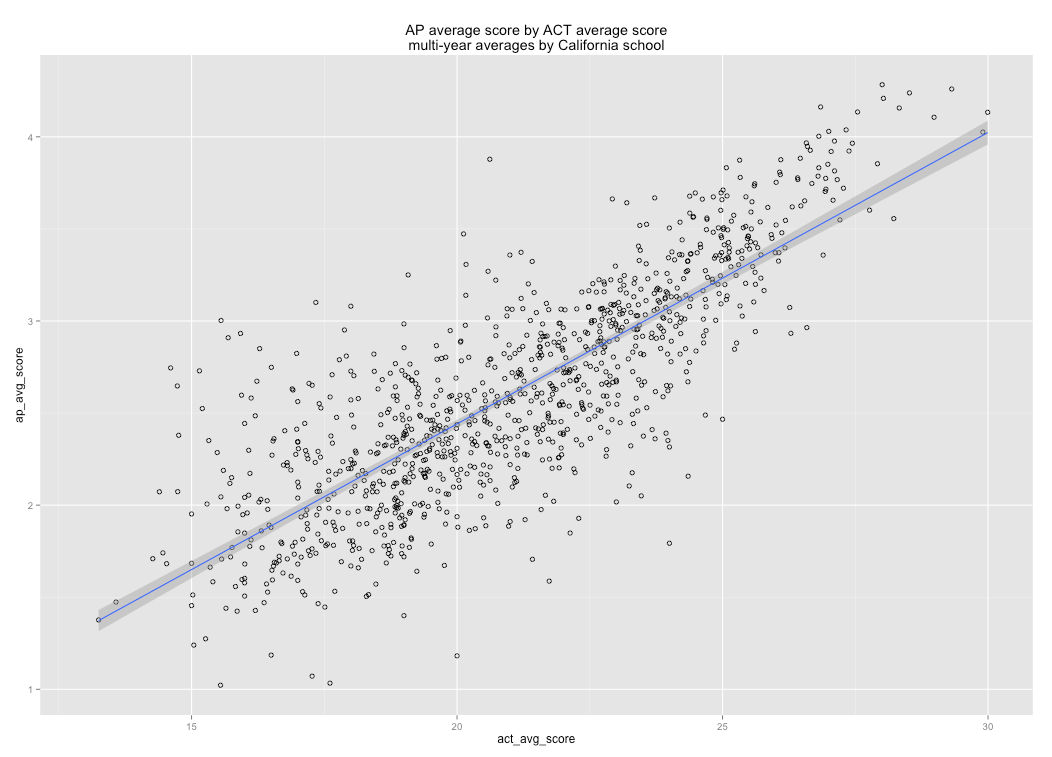
AP by ACT average score (r=0.81)
AP percent scoring 5 by ACT

AP percent scoring 4 or higher by ACT

AP percent scoring 3 or higher by ACT

AP percent scoring 1 by ACT

AP Percent scoring 2 or lower

Other correlates
Average number of AP tests per test taker by (school) ACT score

Average number of tests per senior by ACT score

Average percent of senior tests by ACT score

Note: I am simply dividing by the number of students enrolled in grade 12. Since juniors can and do take these tests the totals can exceed 100%.
Percent of seniors taking SAT (test takers / # seniors) by English Grade 11 scores

Percent of seniors taking ACT tests (test takers / # seniors) by English Grade 11 scores

Percent of seniors taking SAT by ACT

AP percent tested by SAT percent tested (test takers / reported senior enrollment)

SAT composite by percent of “seniors” taking SAT

Some quick and dirty modeling exercises
Model 1 (ELA grade 12 + percent seniors tested): r=0.88


Model 2 (Grade 10 Science + Algebra II + percent SAT test takers), r=0.85

I’m sure I could do better than this (especially if I deal with some of those outliers). My point here is simply this: these tests are highly correlated and that accounting for differences in test taking rates or aggregating a few of them together improves the relationships further.
Scatterplot matrices

