

Back in my earlier post on the effects of concentrated poverty, I mentioned that California provides test score data for various specific “Asian” ethnic groups (e.g., Chinese, Japanese, Korean, Hmong, Indians, etc) and that I might update my analysis with that information later.
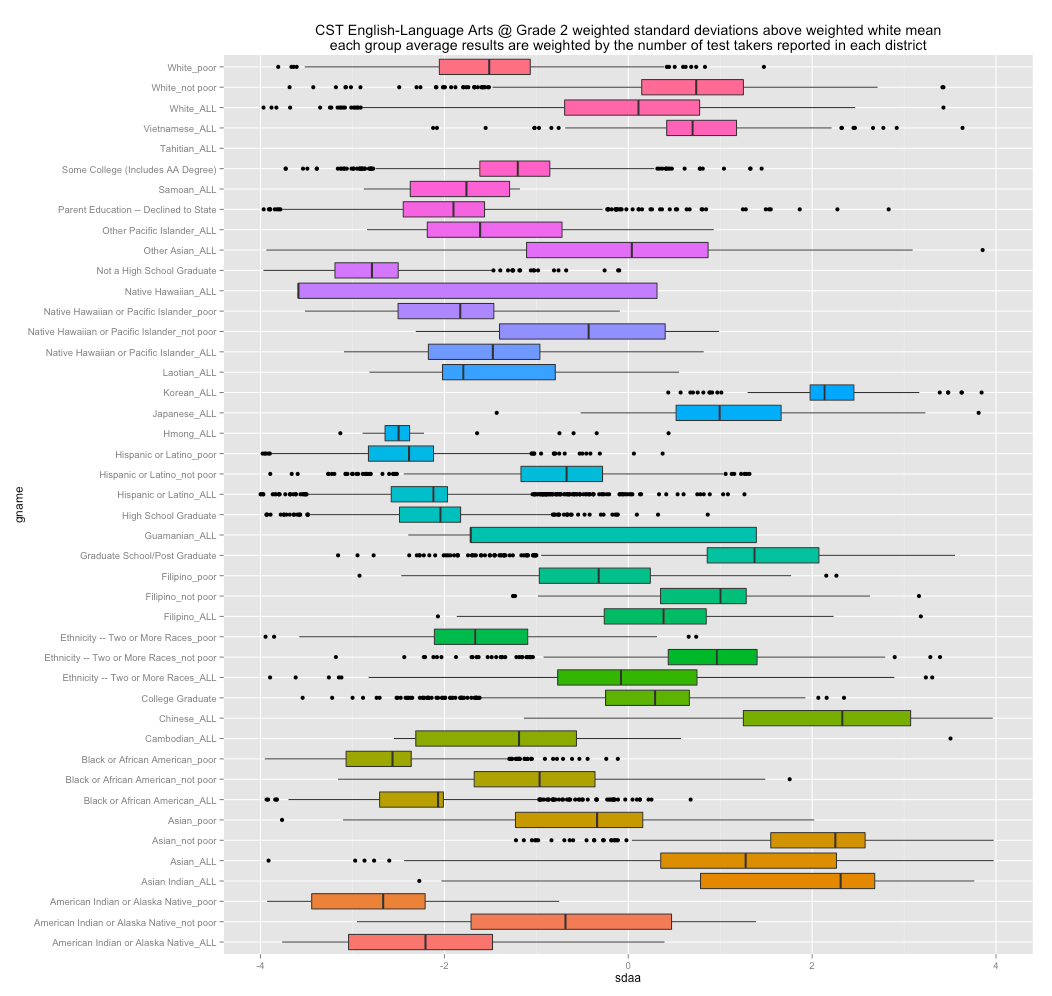
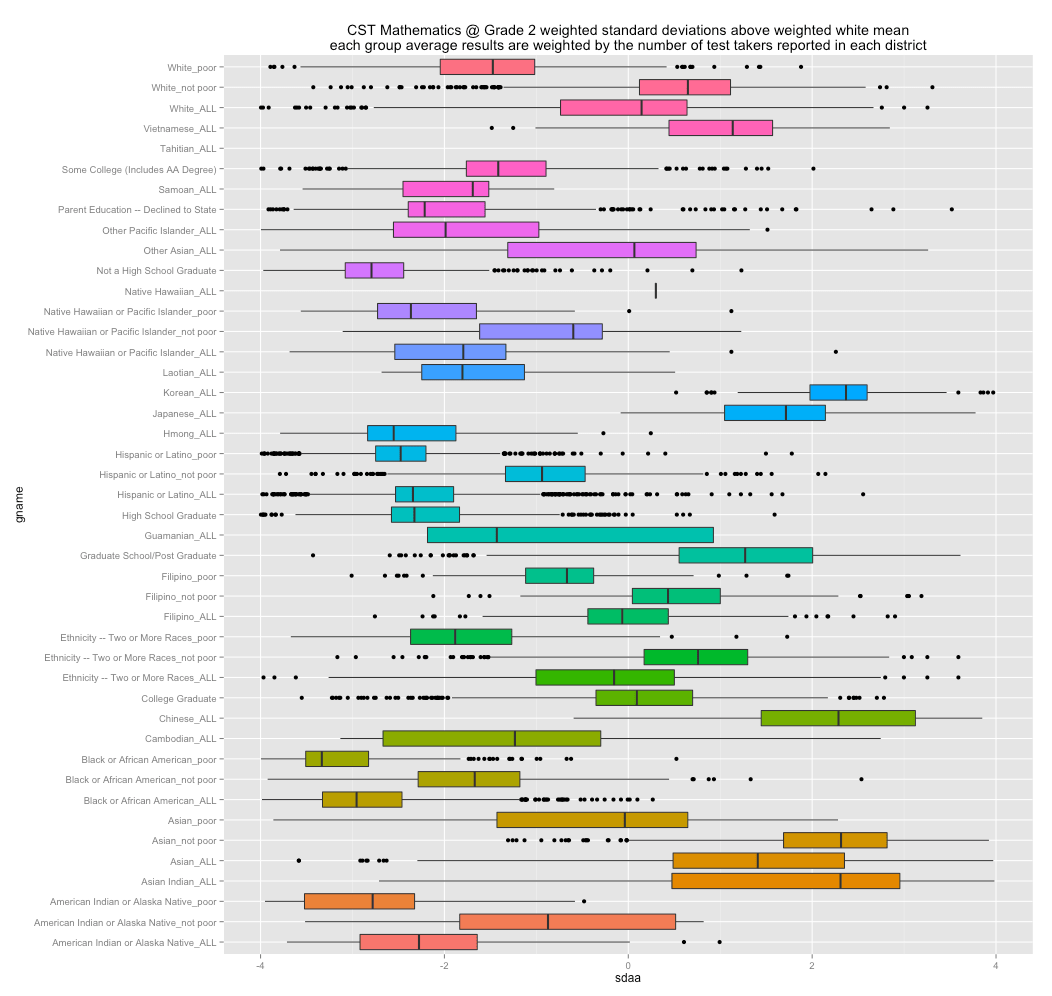
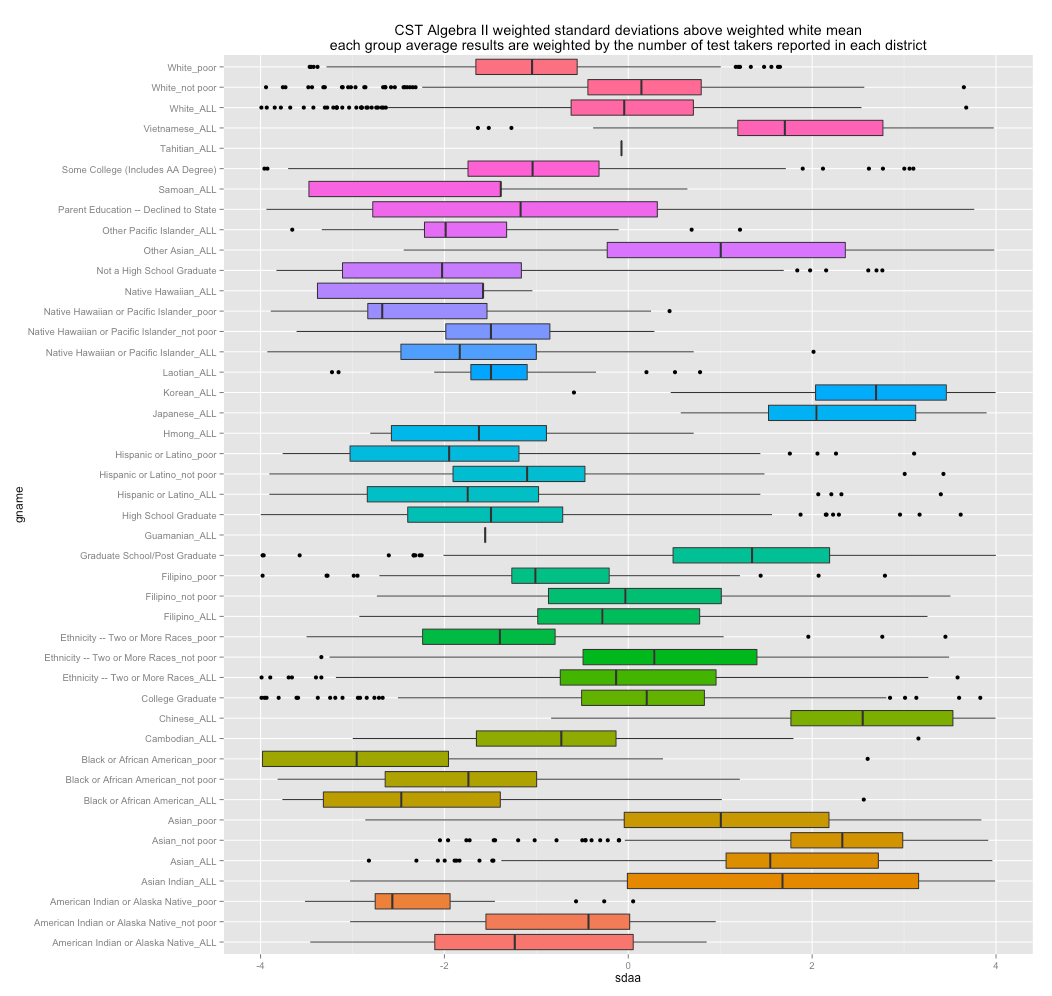
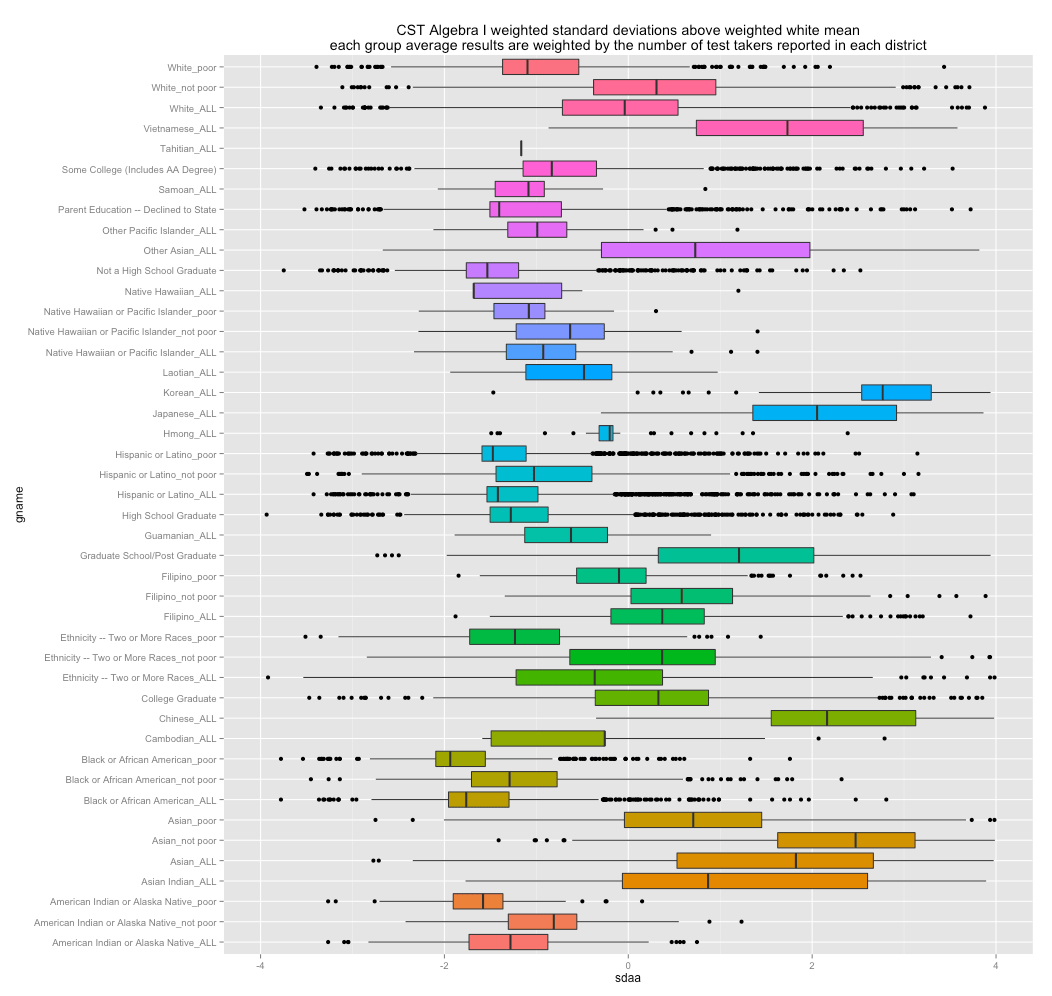
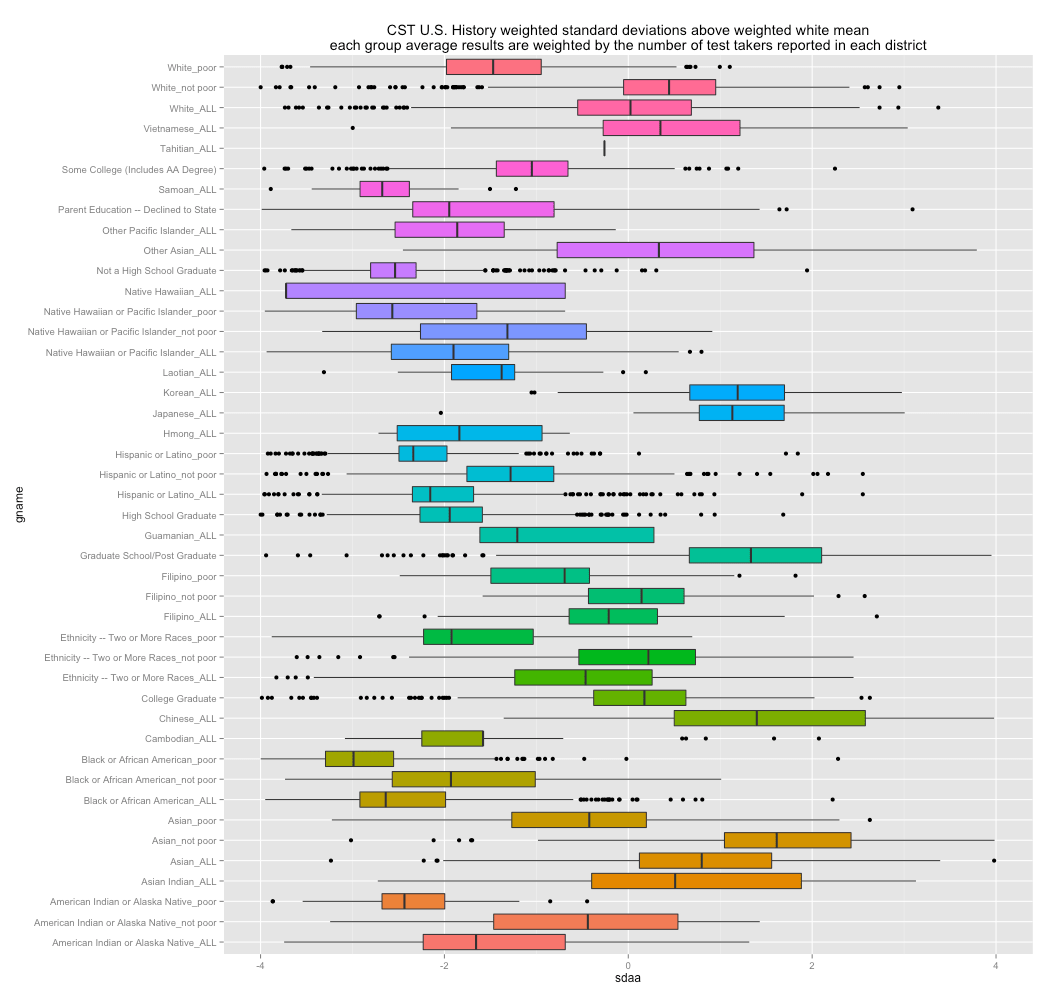
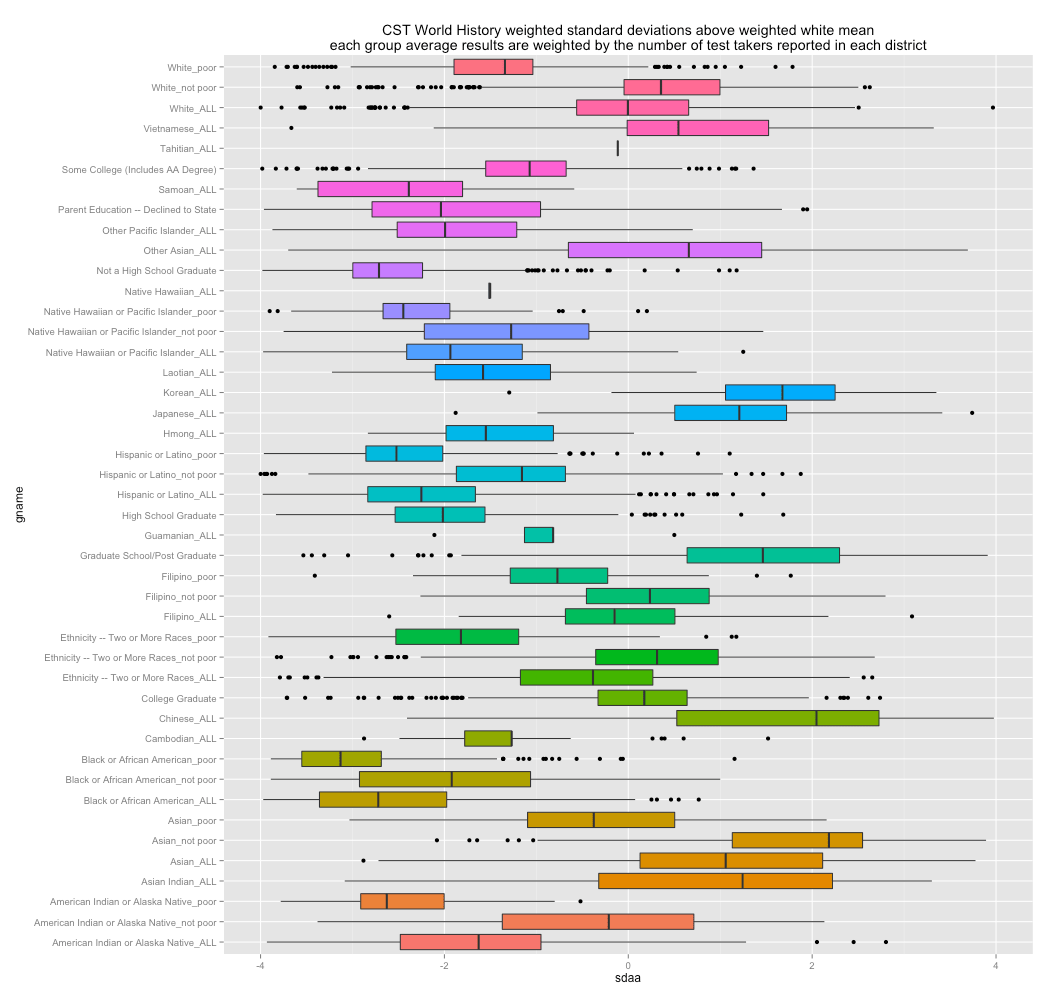
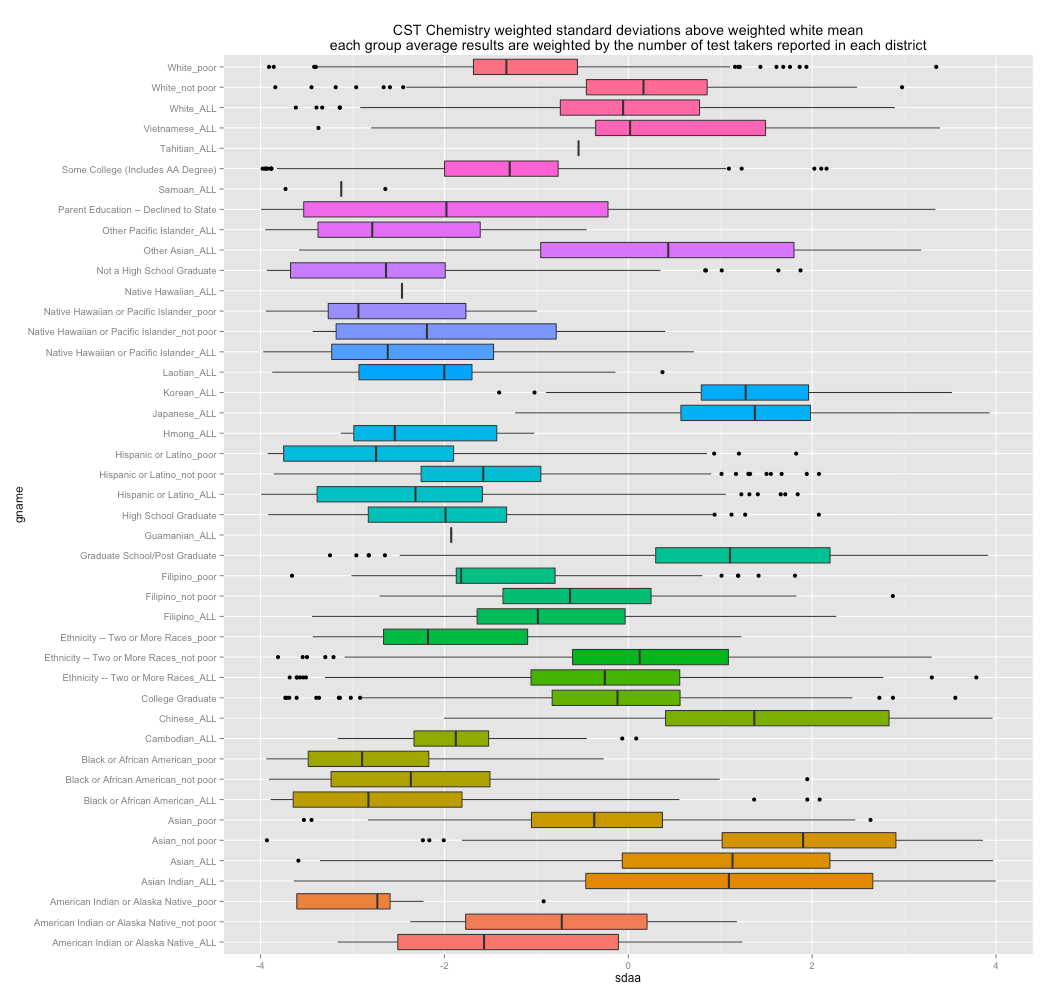
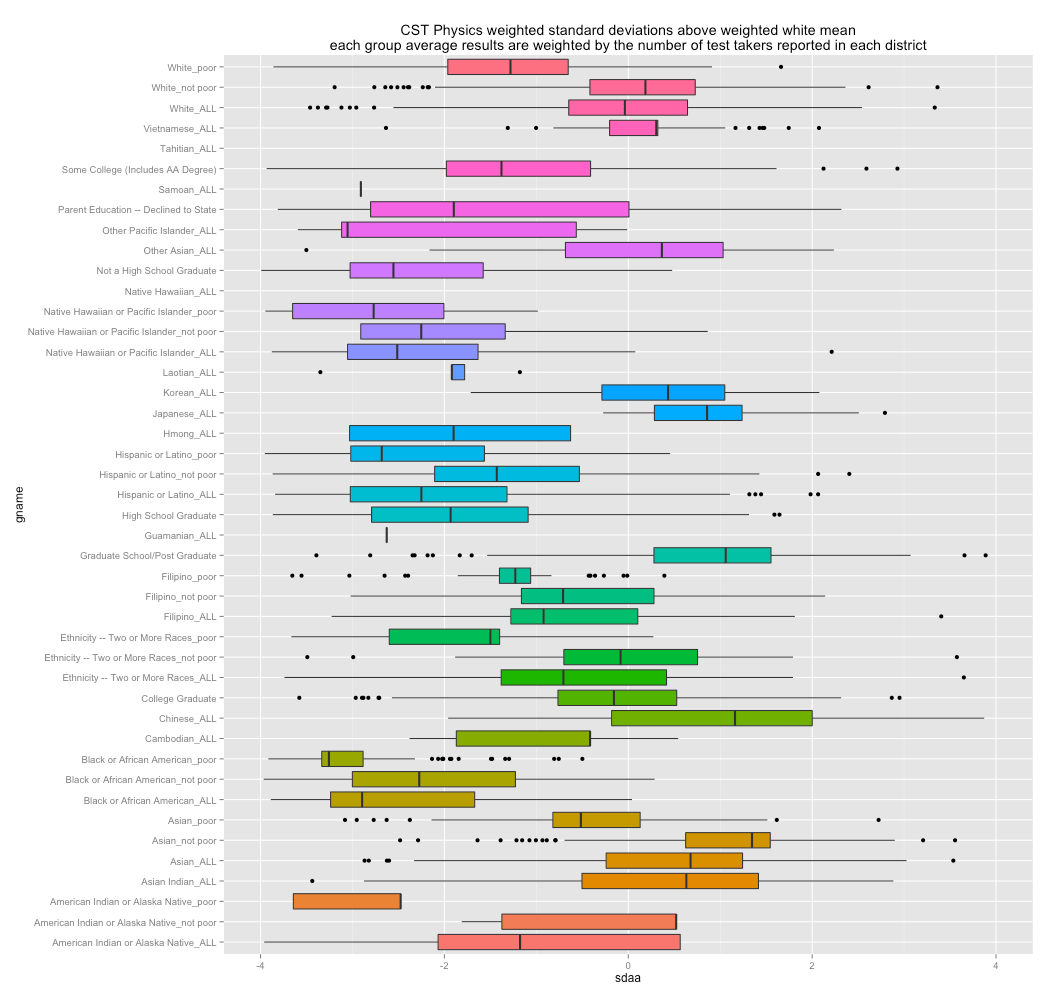
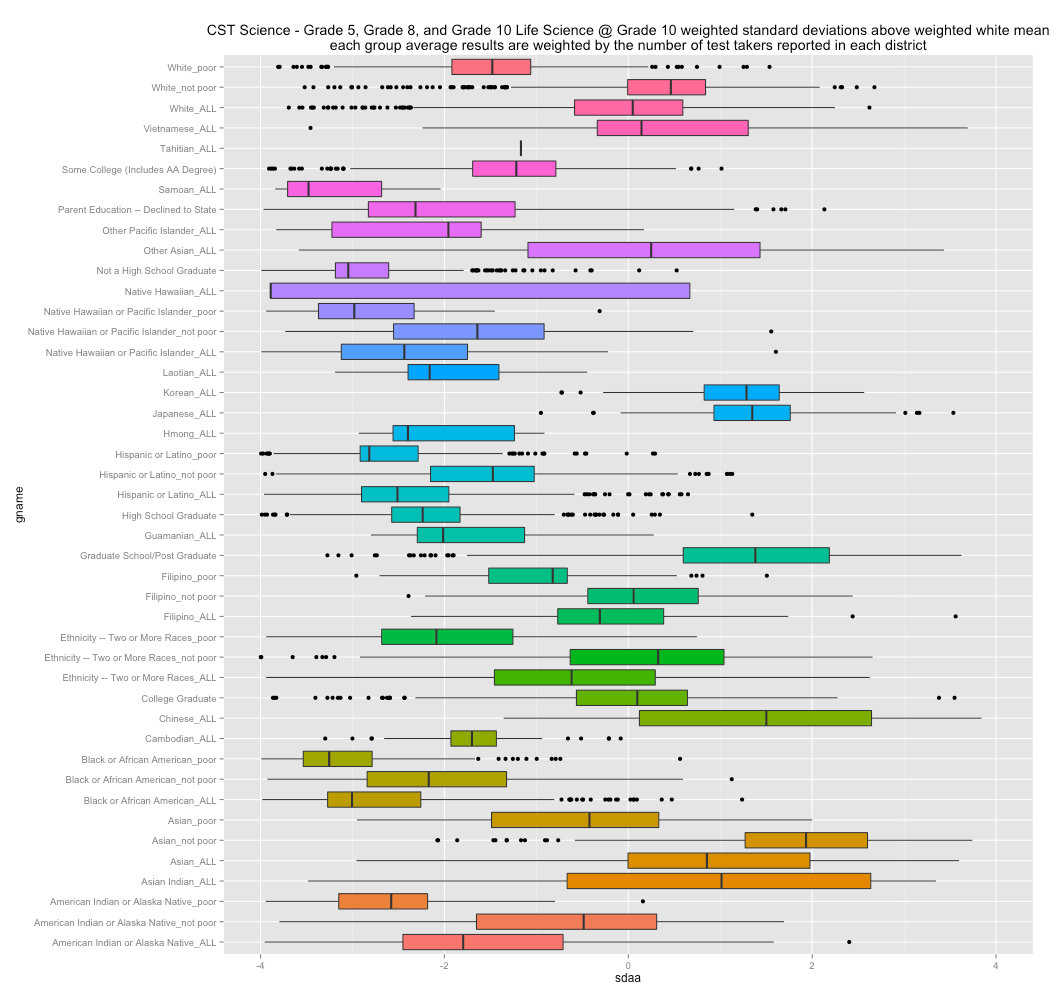
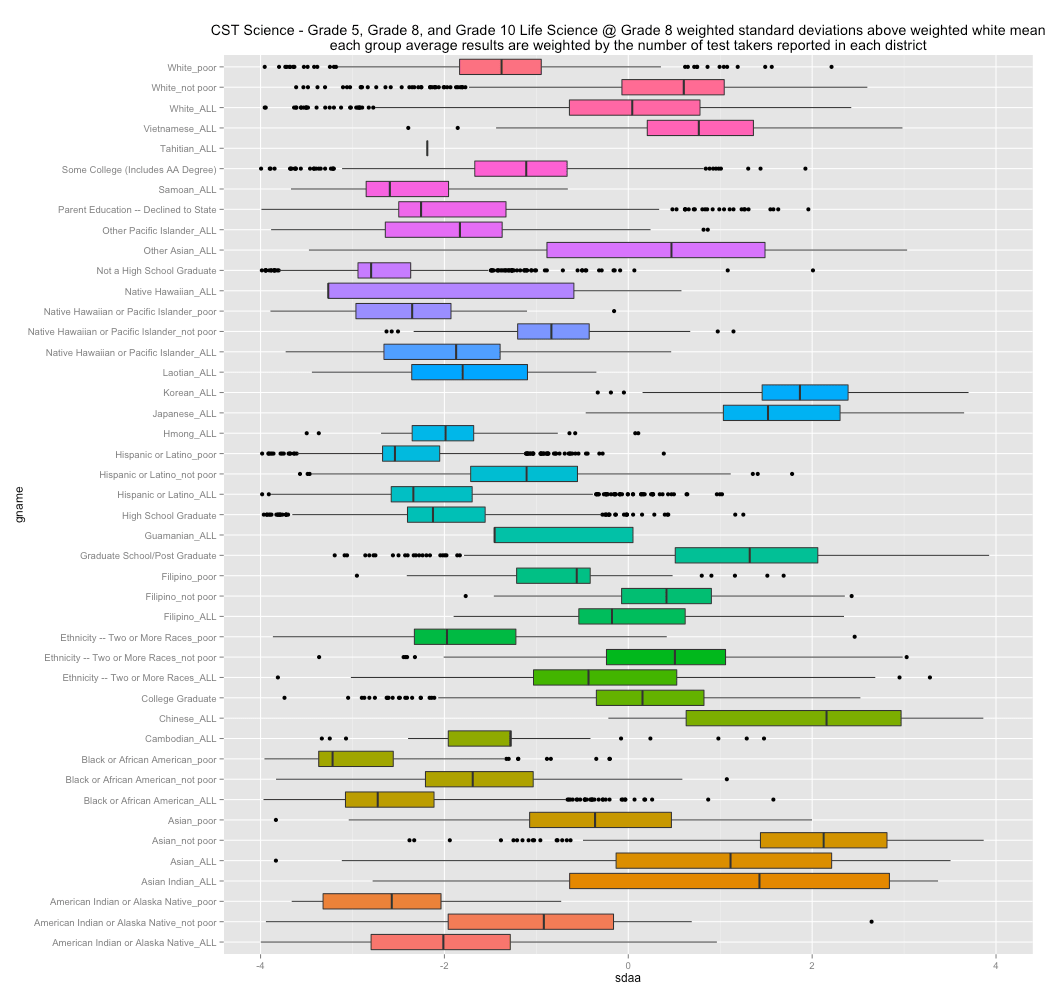
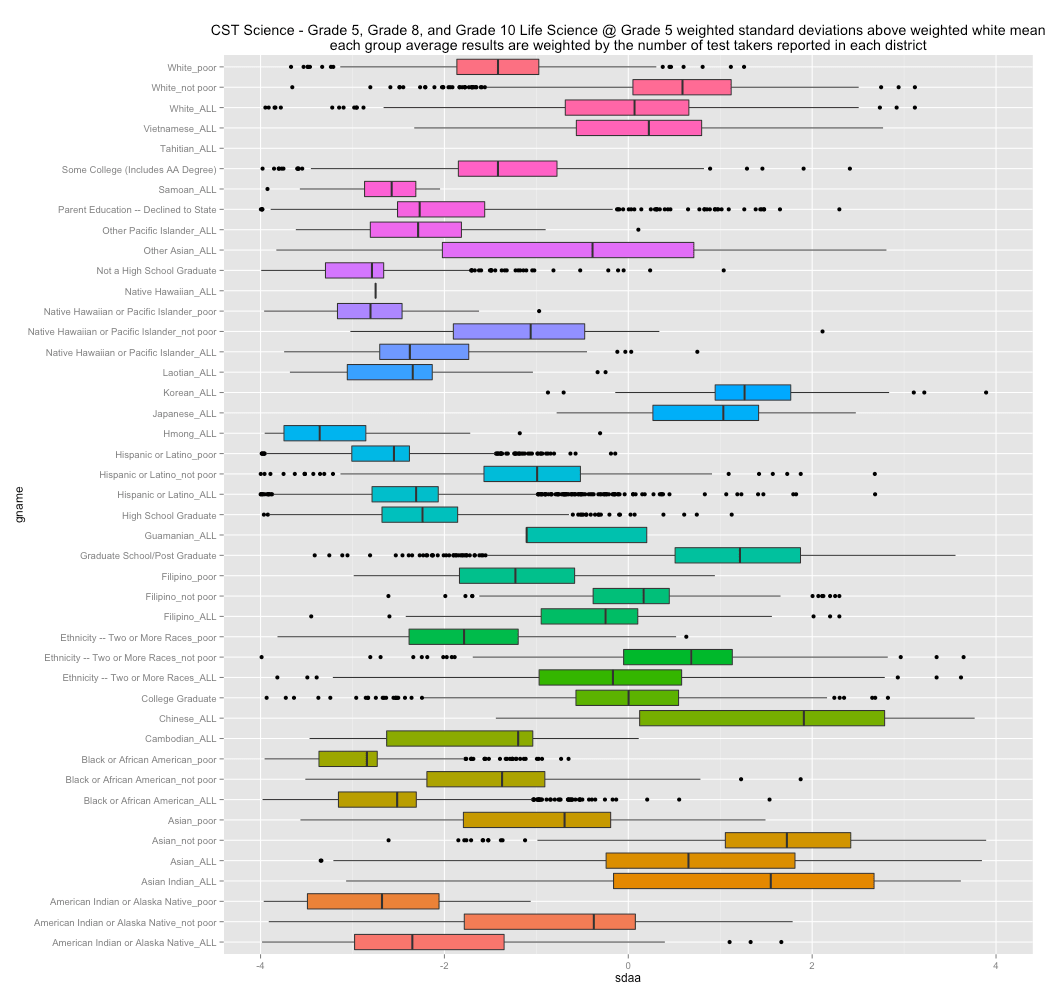
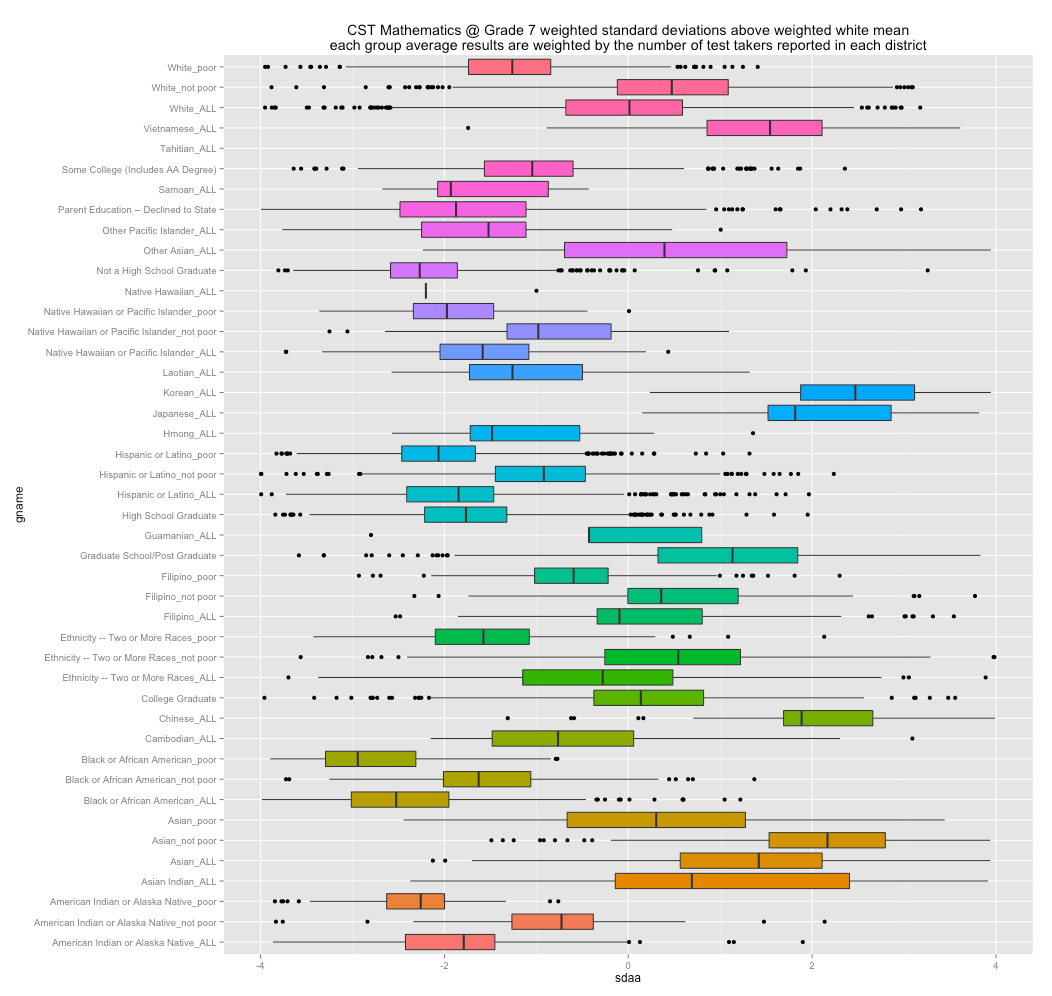
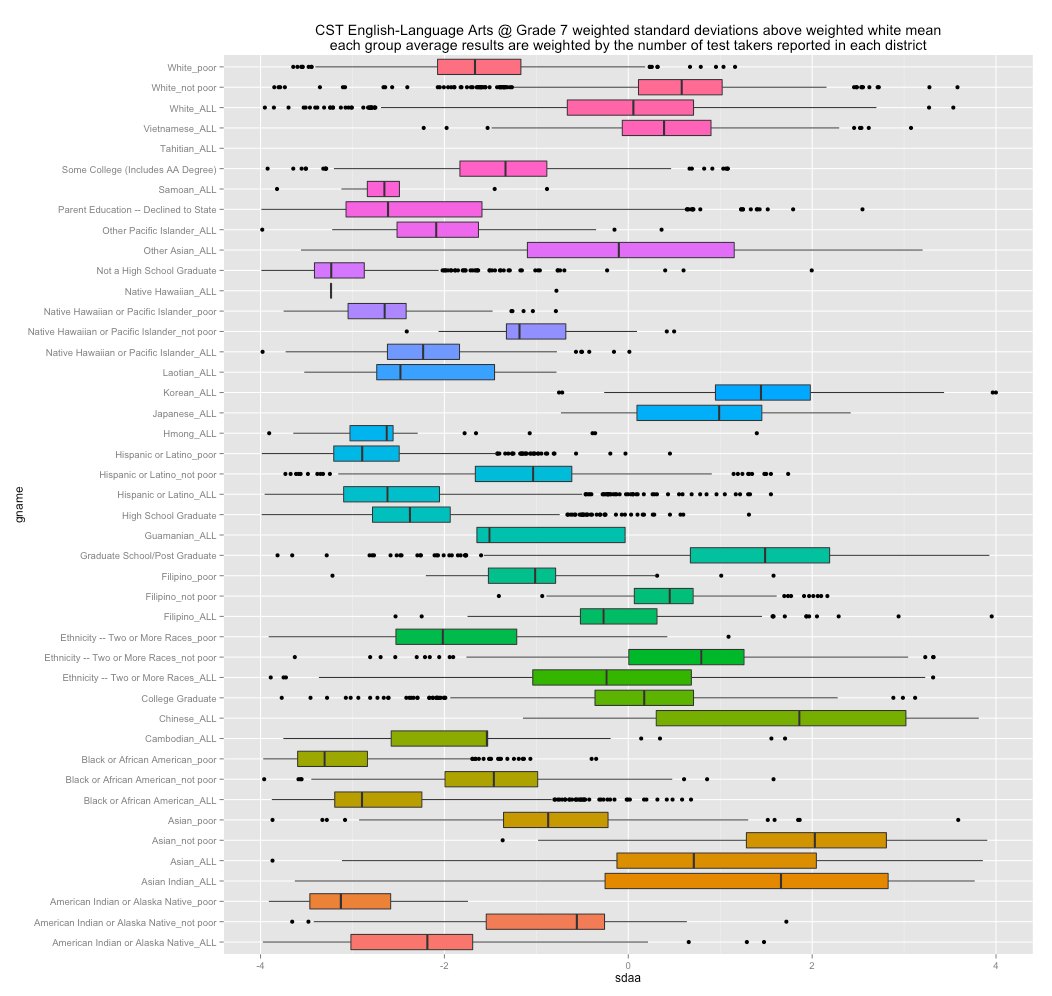
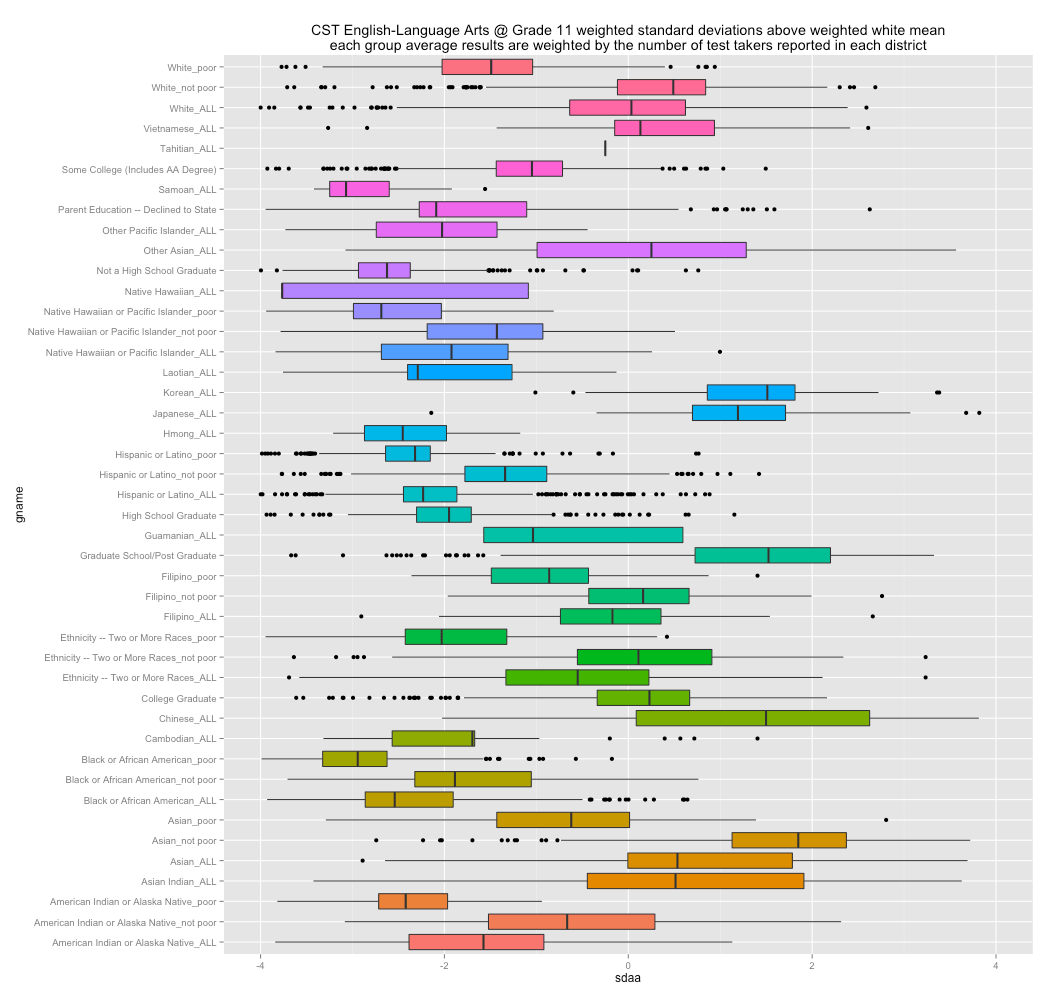
To aid interpretability across multiple tests, I first converted all average scores into standard deviations above the non-hispanic white mean (both are weighted for the number of test takers in each school district to better approximate the actual individual distributions) and then plotted these as box plots for detailed ethnic groups, poverty status by race/ethnicity, and education levels. All of these box plots are also weighted by the number of test takers in each group.
X = 0 should correspond to the weighted white mean across school districts in California (which ought to be very close to the individual white average state wide), ergo groups or parts of groups (e.g., IQR) that are on the right hand side are generally outperforming the white mean and vice versa for groups on the left hand side.
English Grade 2
Math Grade 2
Algebra II
Algebra I
U.S. History
World History
Chemistry
Physics
Science Grade 10
Science Grade 8
Science Grade 5
Math Grade 7