As a quick follow up to my earlier post using ancestry.com’s “Genetic Census of America”, I thought I’d post some more heat maps using the data I aggregated by major continental group (“race”) and by the more granular “adjusted” European ethnicities (i.e., whereby I simply divide the ethnicity by the total european “ethnicities” in the state).
Note: You can click these images for an interactive view to see the actual numbers for each state if you care.
Adjusted European Ethnicities


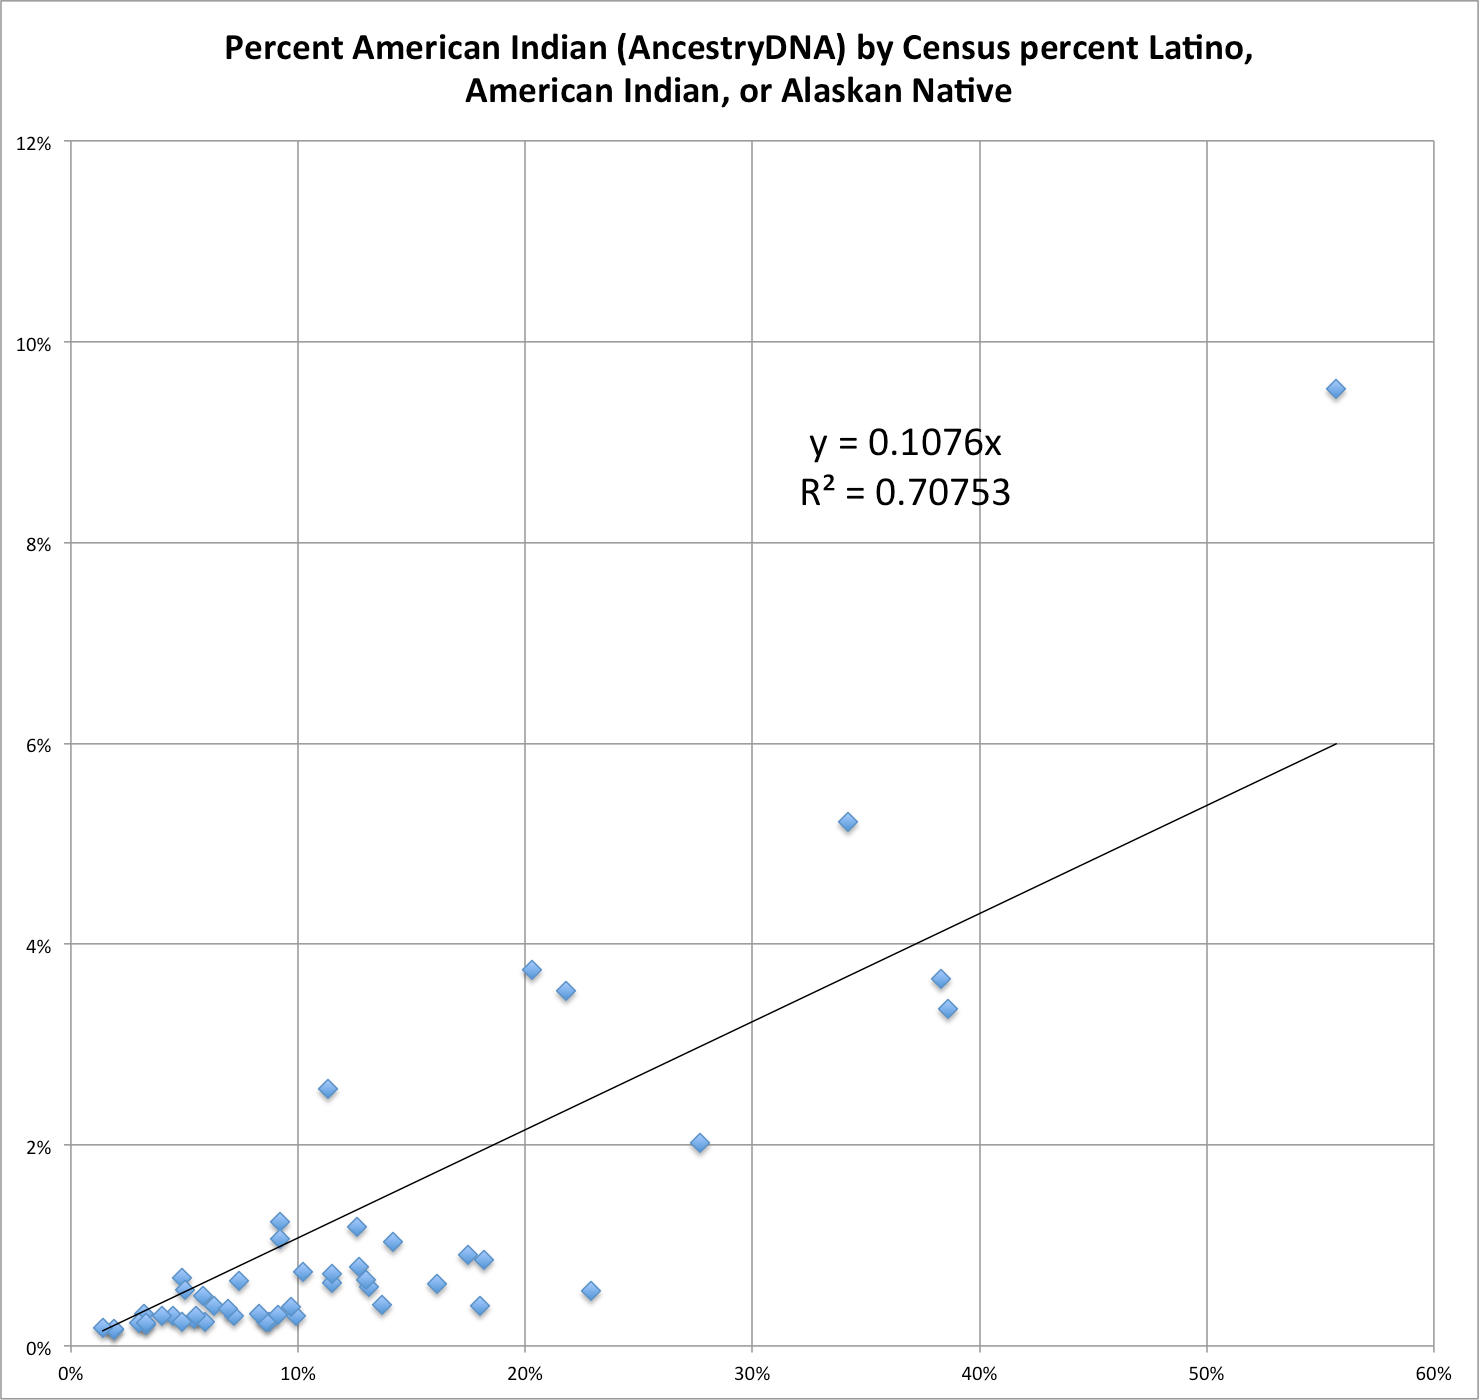
Please note that the low levels of subsaharan African ethnicities and american indian ethnicity in ancestry.com’s data implies that blacks and latinos, in particular, are very much under-represented based of their share of the population. I would presume that this is because blacks and latinos are much less likely to use AncestryDNA (and probably genealogy services in general).
Below I very crudely estimated their share of the population based on the proportions of American Indian (~40% average for Latinos) and subsaharan african (~80% average for blacks) genetic material, assuming no admixture with other groups (which obviously is not quite right either).


I am not claiming that these figures are exactly right or uniform in all states (I know there is real variance, especially with hispanics/latinos), but it ought to be pretty clear that they are using the service at something like 20-50% the rate of non-hispanic whites, or at least were at the time ancestry.com compiled this “census” (which is why I felt more comfortable using my crude adjustment method to calculate the European percentages!).