

The changing distribution of household income inequality is real, but it’s often overstated since it does not account for household size or the number of earners per household.
Put bluntly, actual work is far from evenly distributed and far moreso than most people realize or admit.
Below are some statistics from the most recent US census [very similar numbers are found pre-recession too]
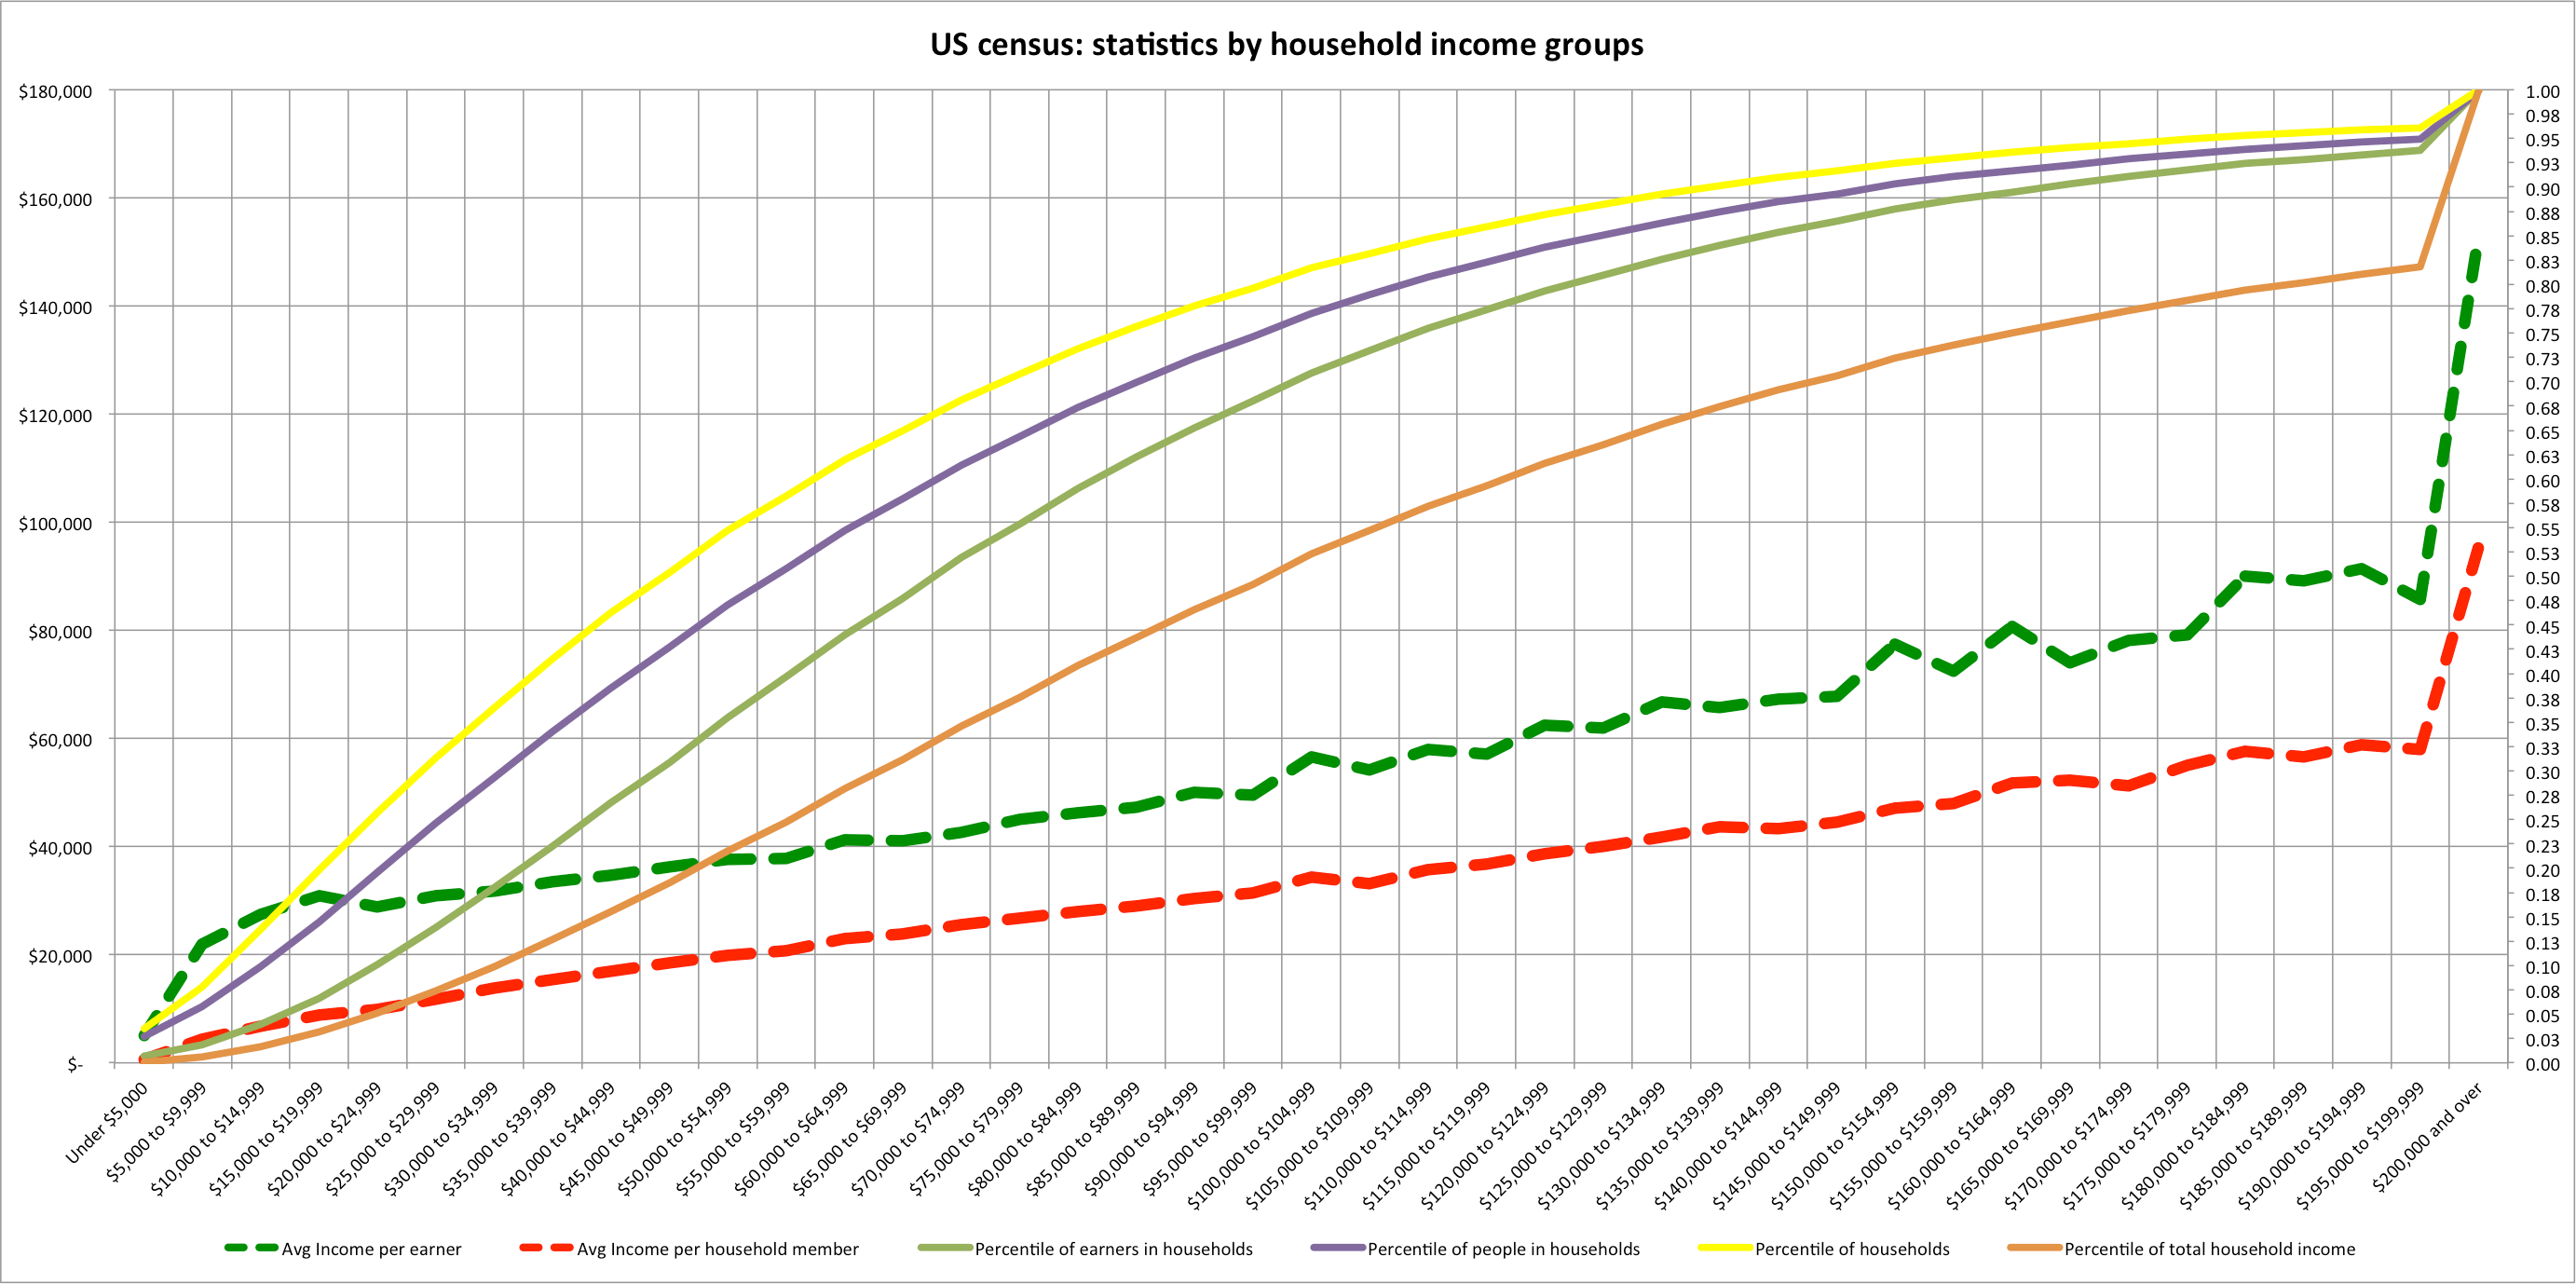
Some observations:
The top ~10% of households have about 14% of the people and 17% of the “earners”.
The bottom ~31% of households have about 25% of the people but only about 14% of the earners.
In other words, the bottom 30% has less than 1 person worker per household, ~57%, whereas the top 10% has more than two people working on average (more than 3 times the number of earners per household).
Types of work by householder
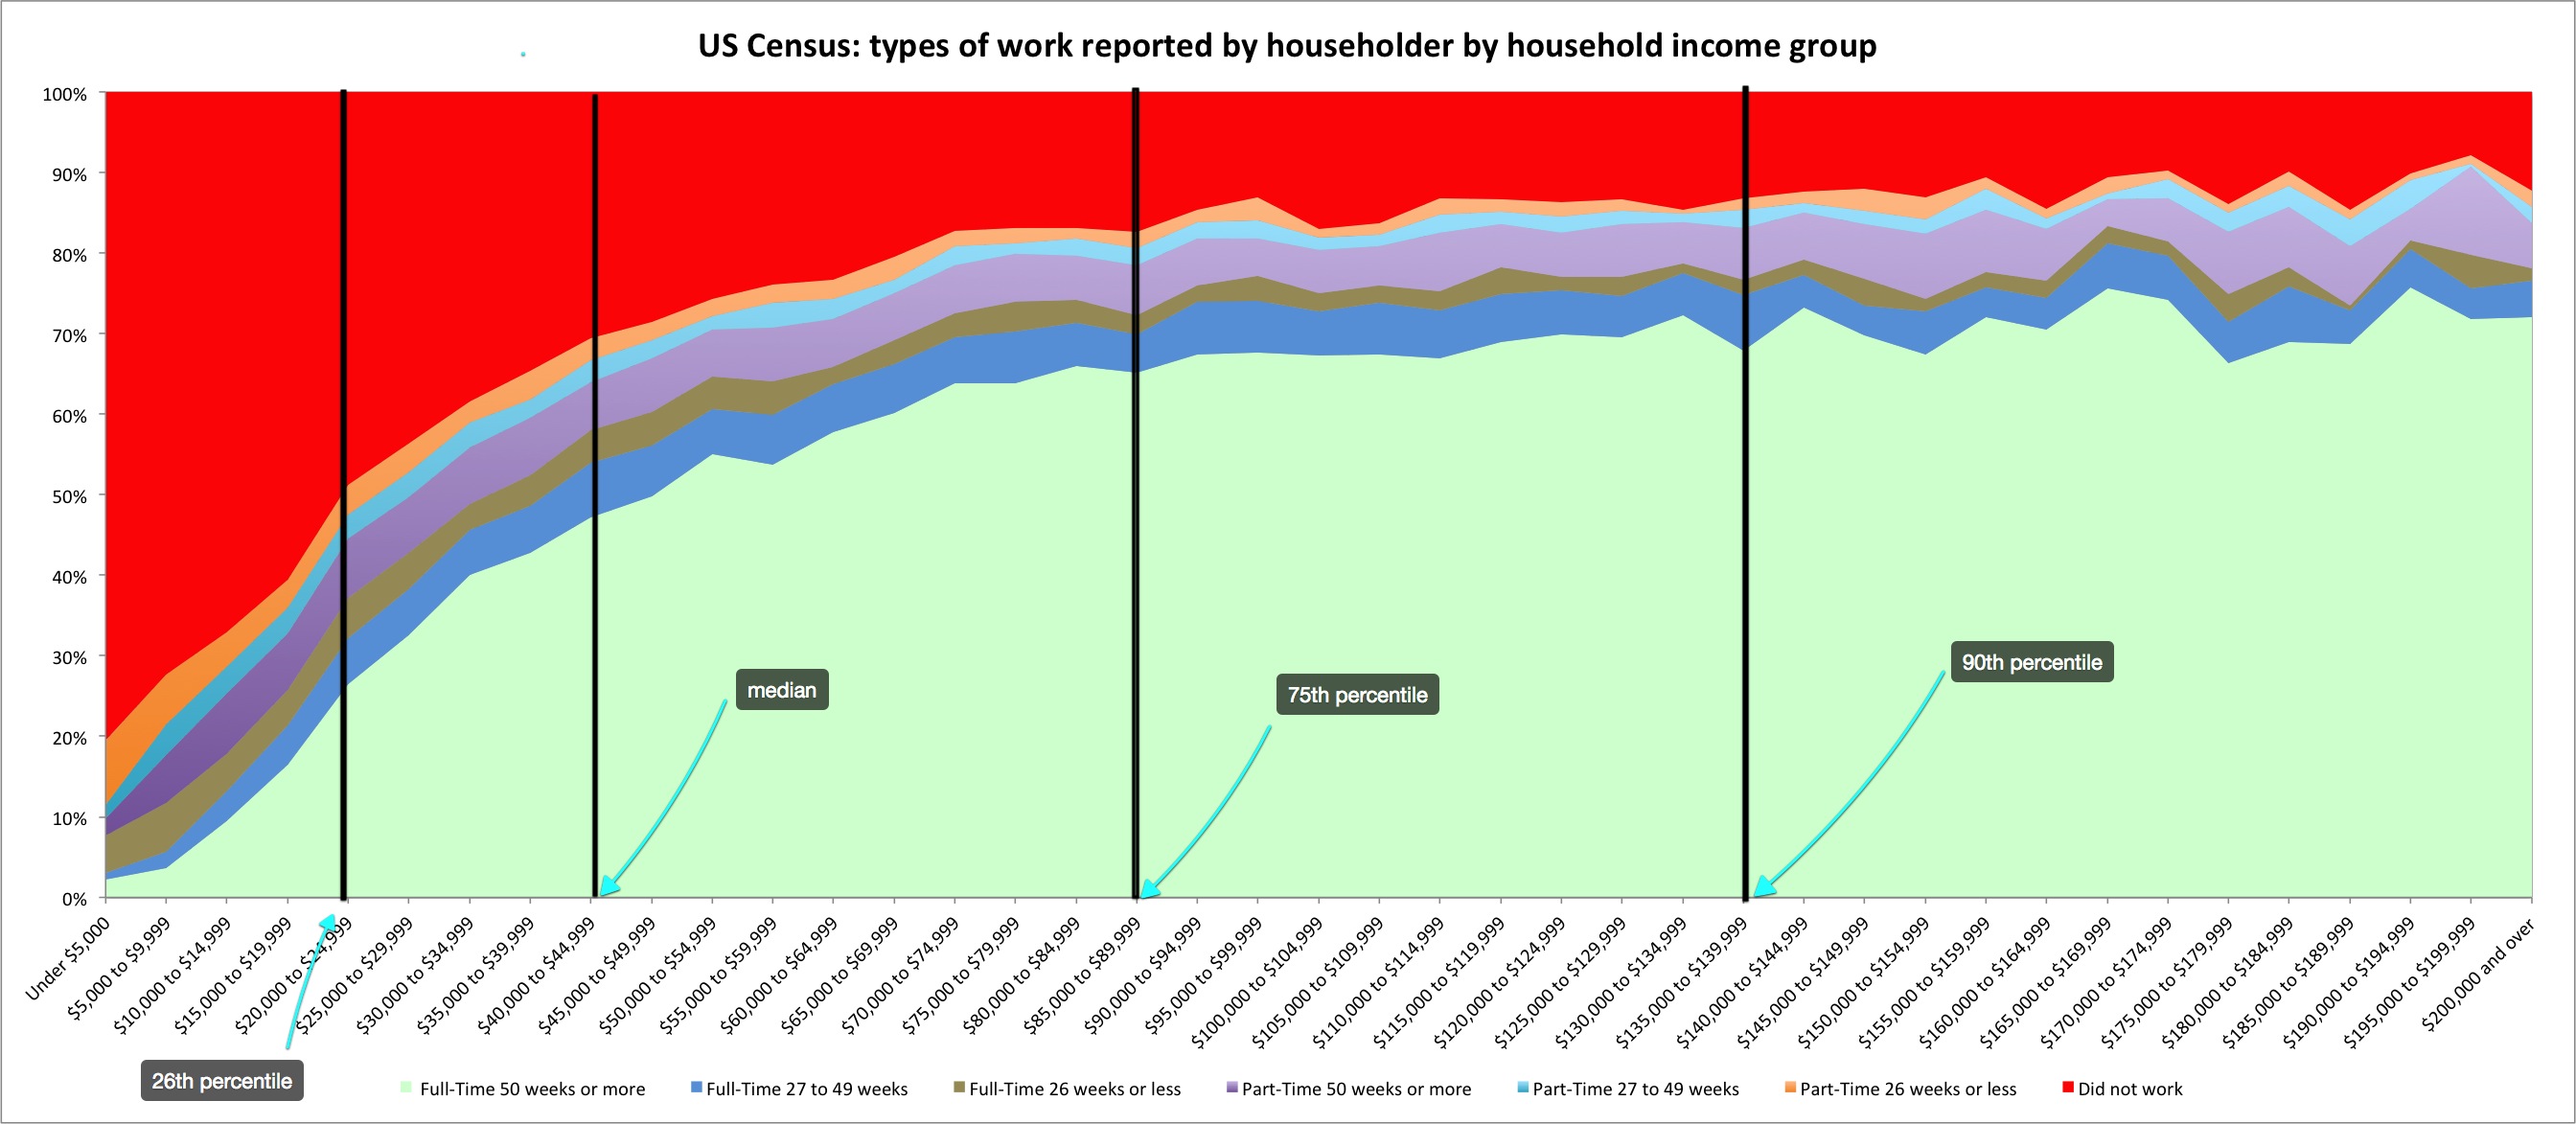
Observation: At least the householder of upper-middle income groups are much more likely to not just be employed, but to have a regular full-time job.
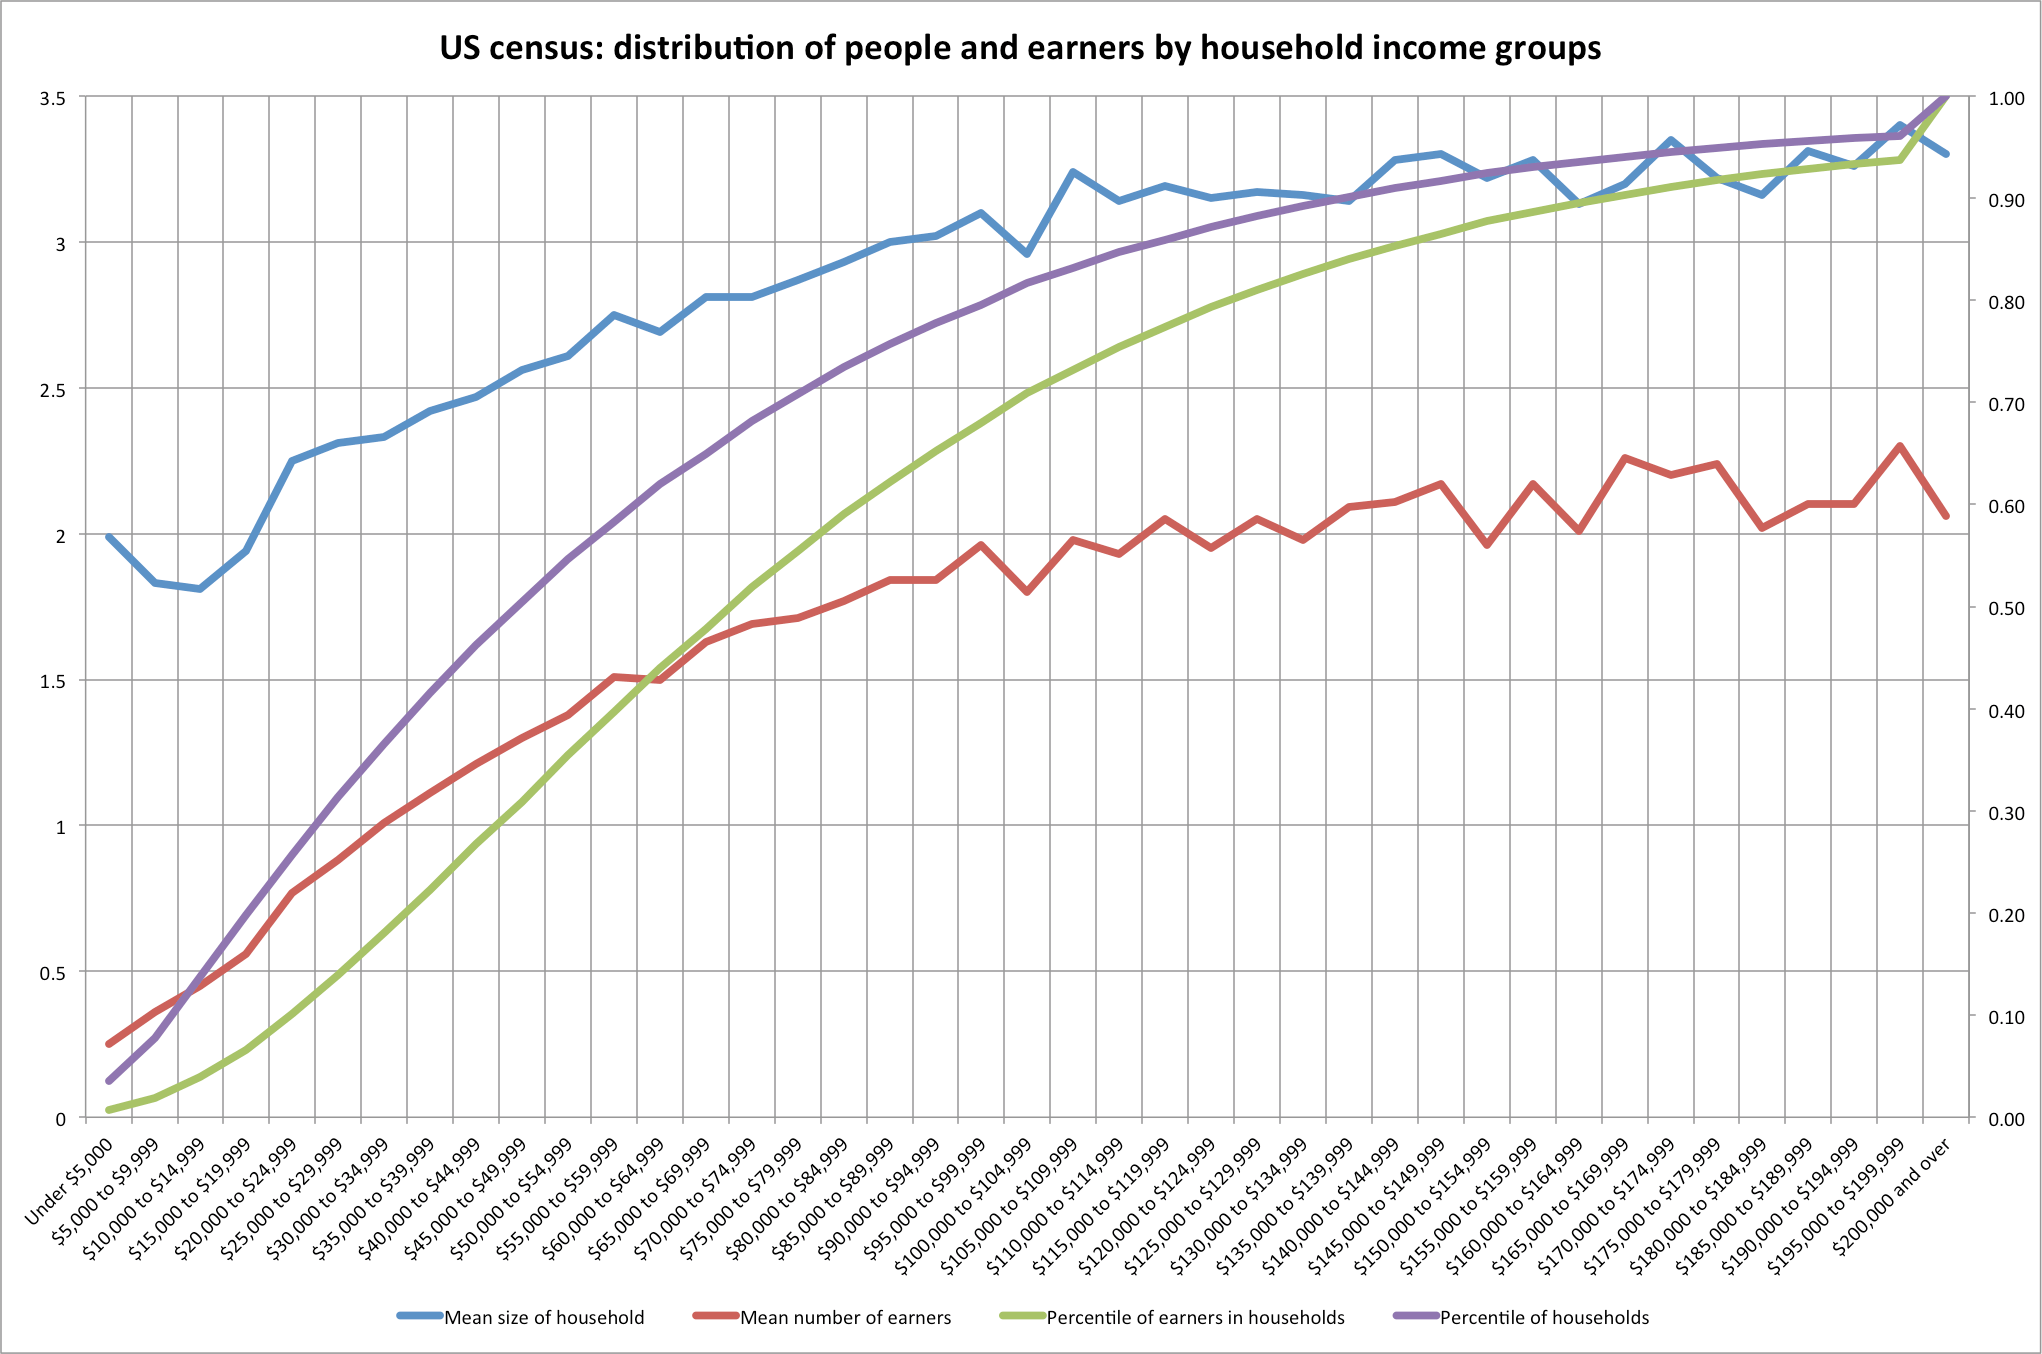
Break out of number of earners per household
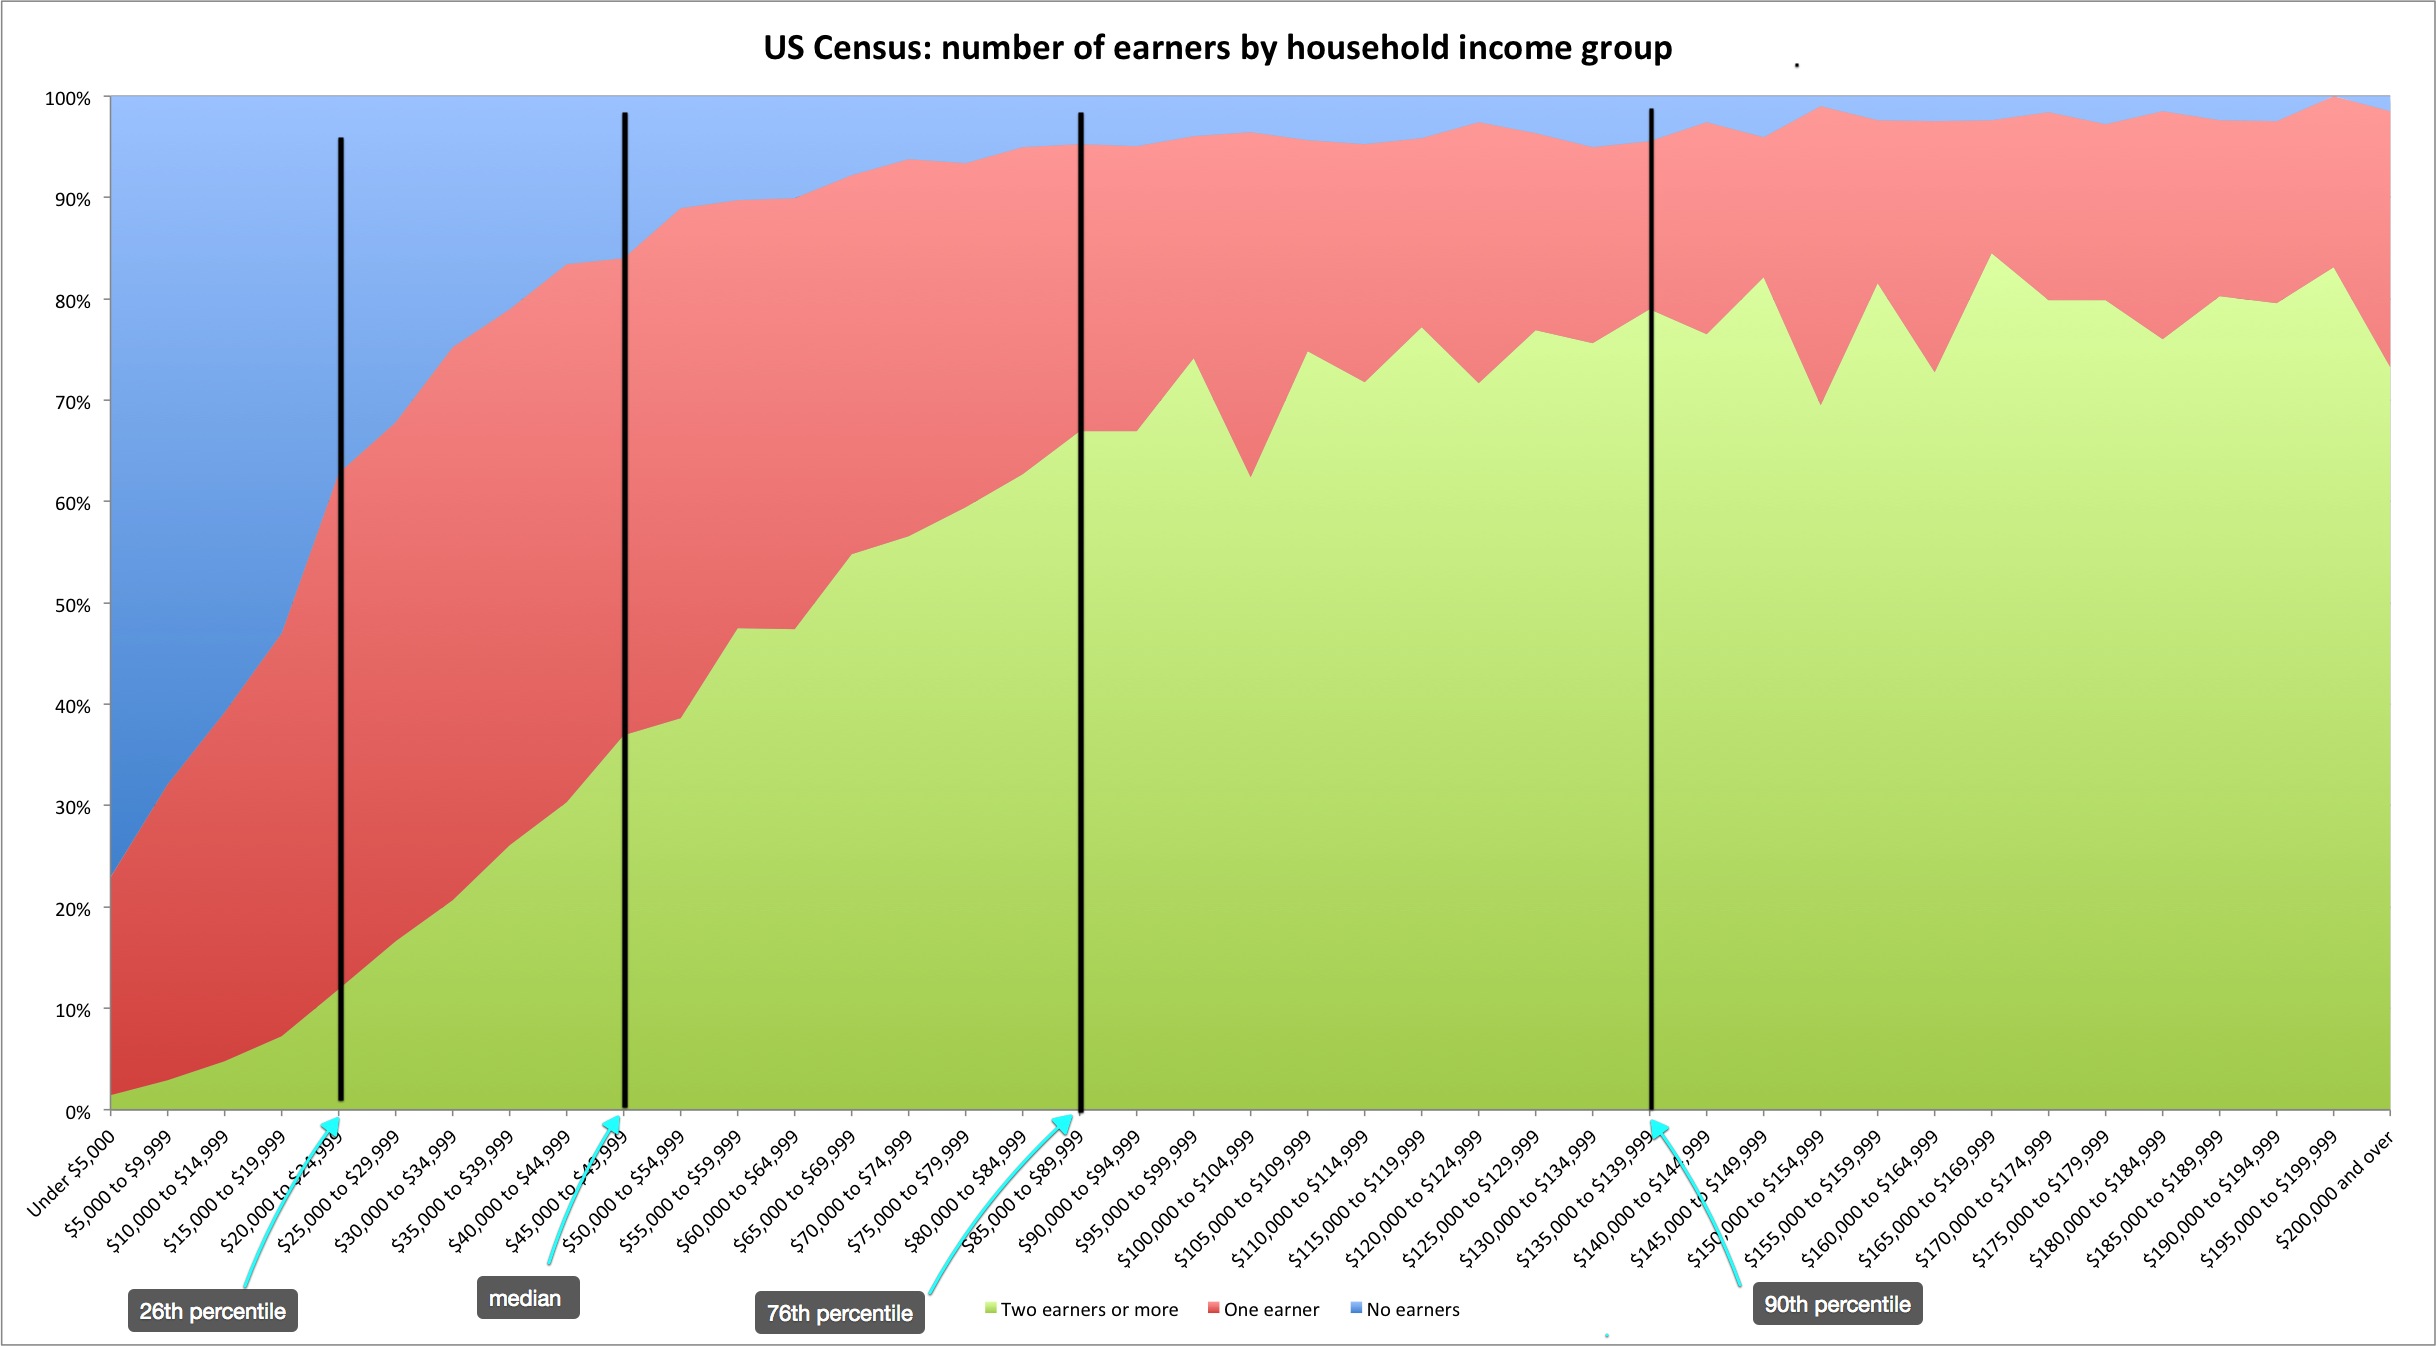
Observation: There are significantly more 2 or more earner households amongst high income groups than low income groups.
It would seem to me that the primary driver of household income inequality is an uneven distribution of earners — fewer full-time job holders, dual+ income households, etc, at least for the vast majority of the distribution.
By Age
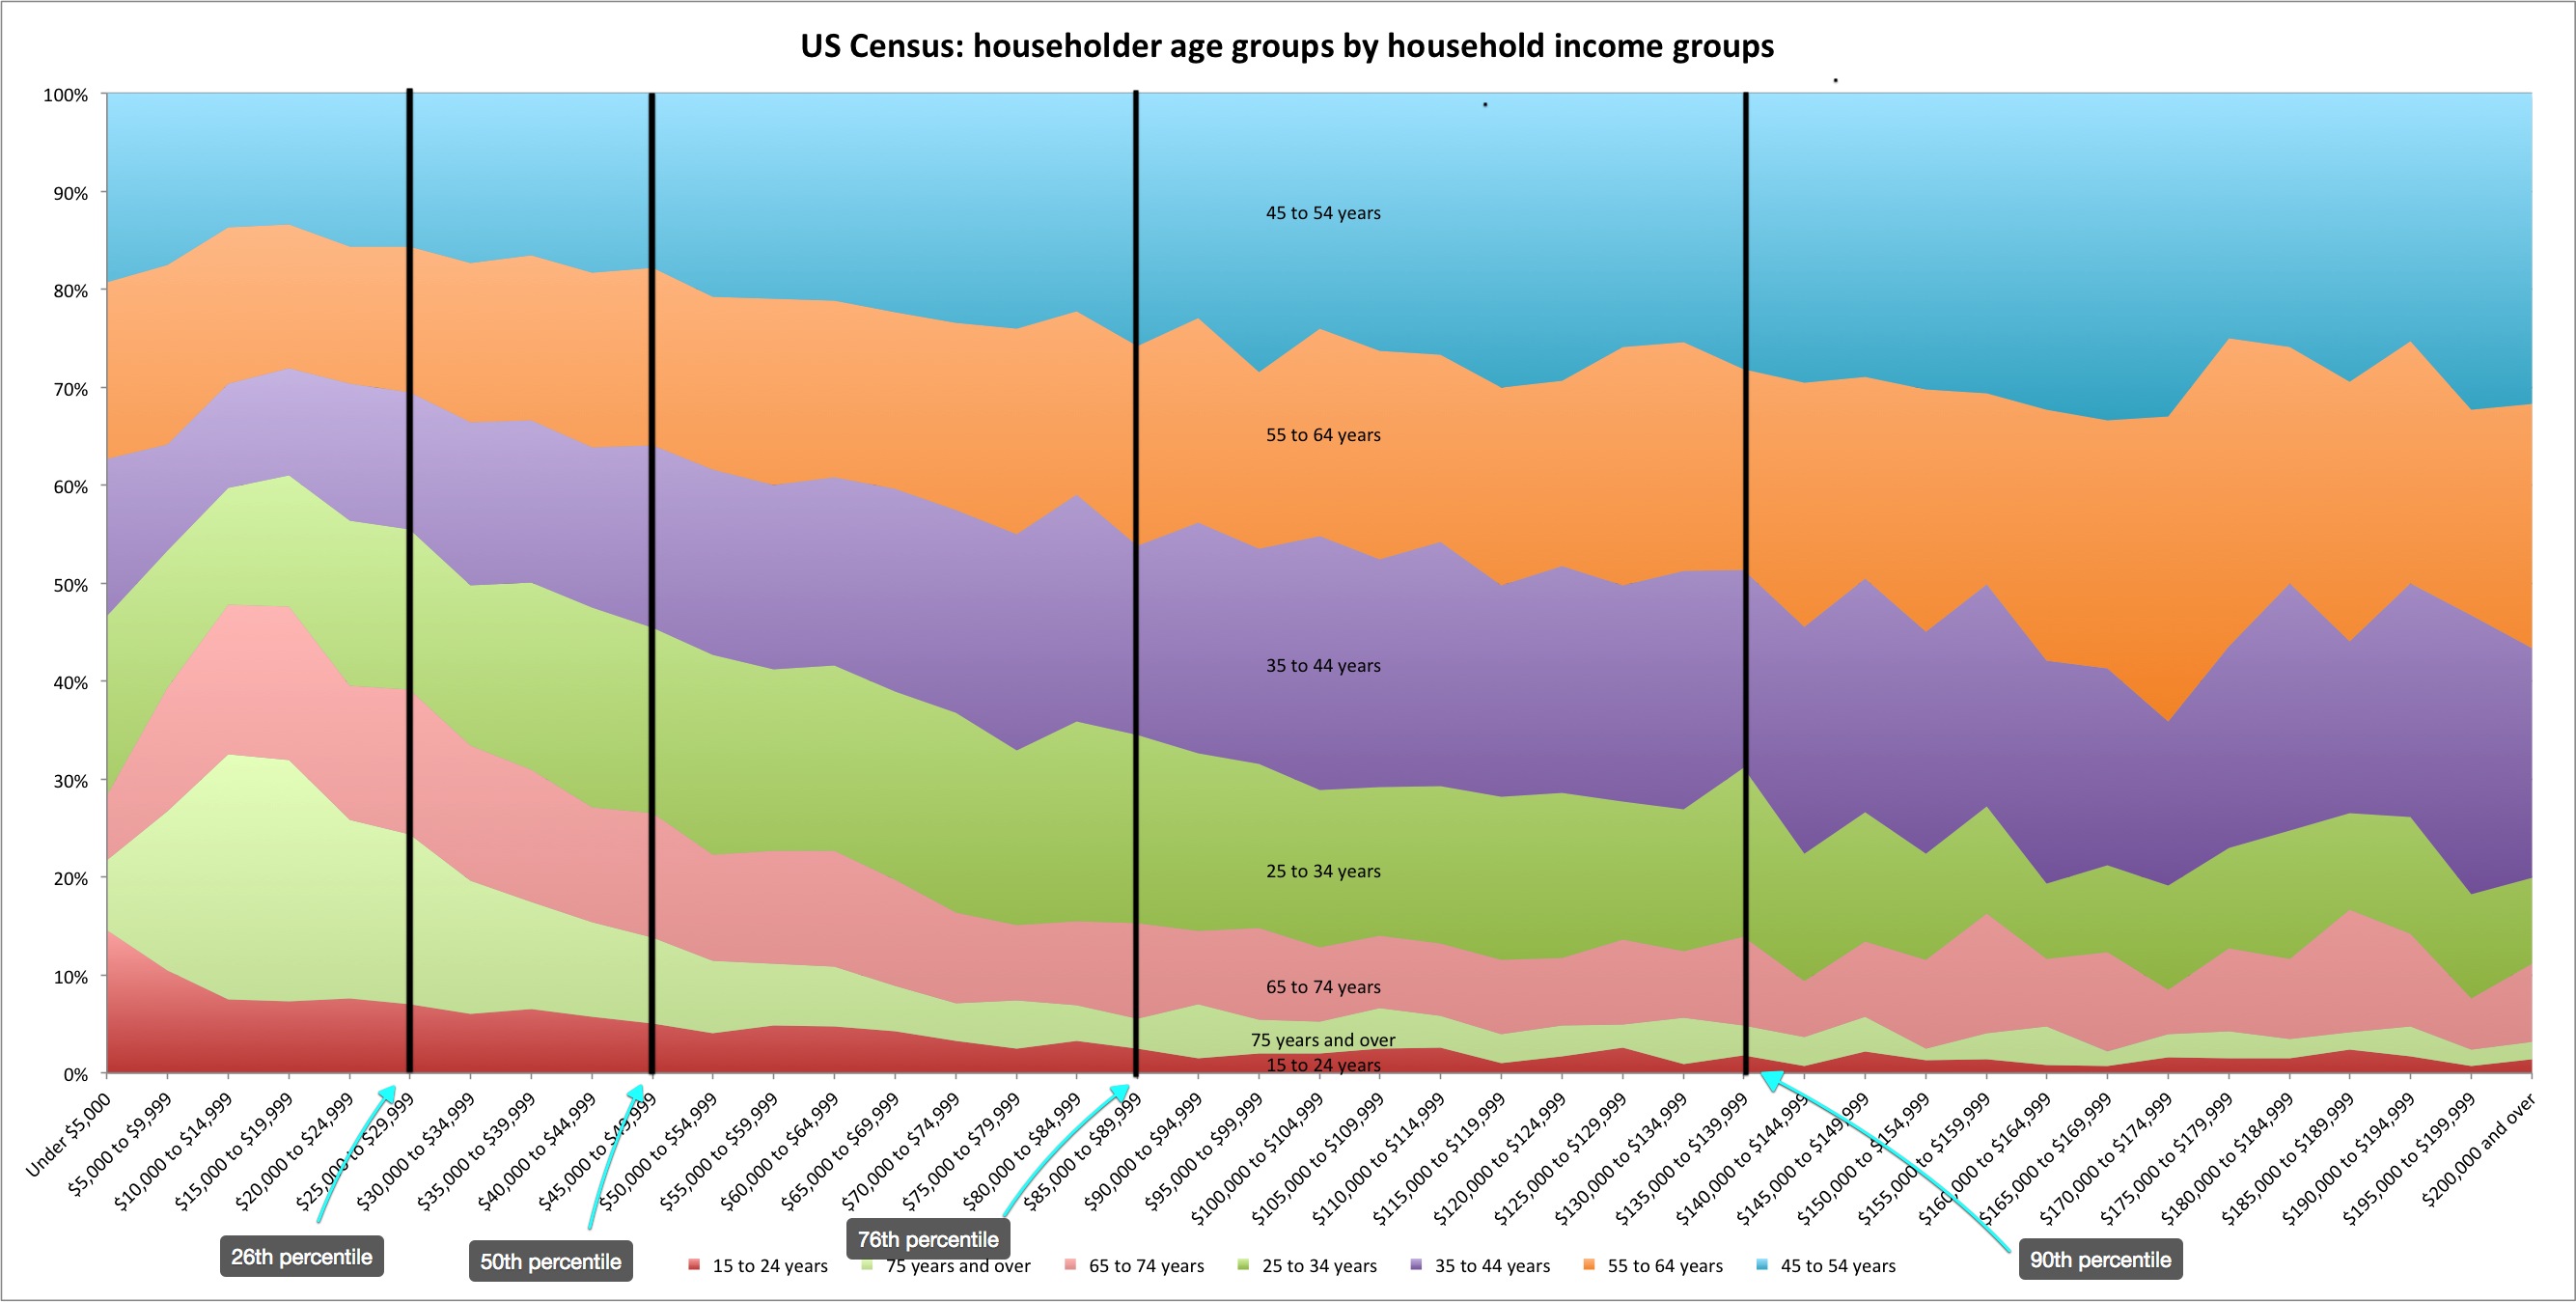
Observation: The elderly (and presumably retired) are disproprtionately represented amongst low income groups. The very young households (25 y/o or less) are also better represented, albeit to a much lesser extent.
By household size
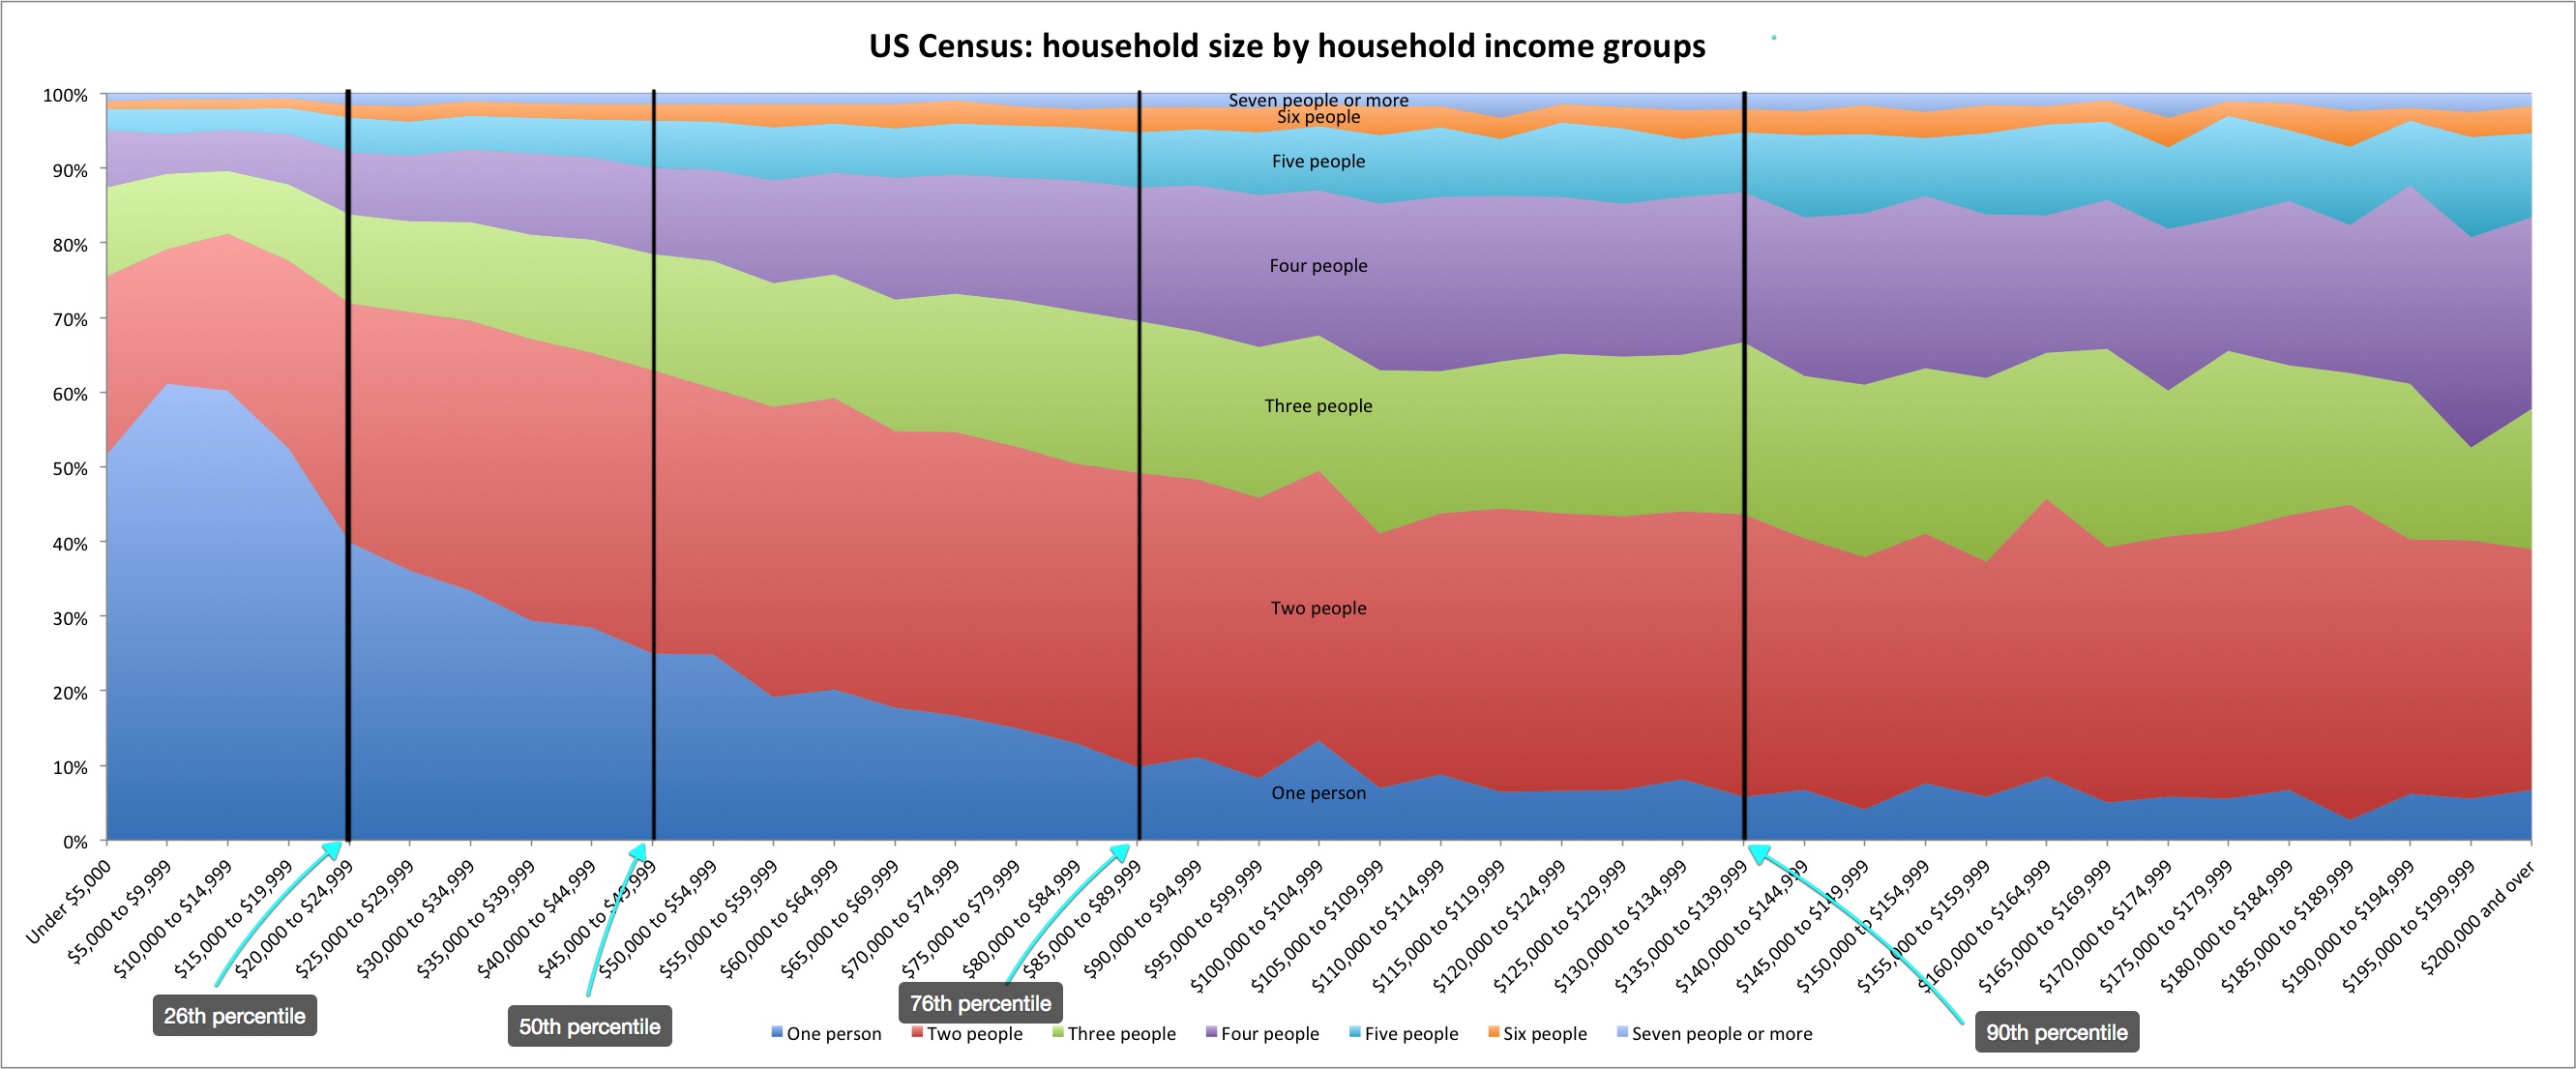
Observation: Lower income groups are MUCH smaller on average relative to high income groups– almost 50% of the bottom 25% of households are ONE person households and the vast majority of them are two or less.
By educational status
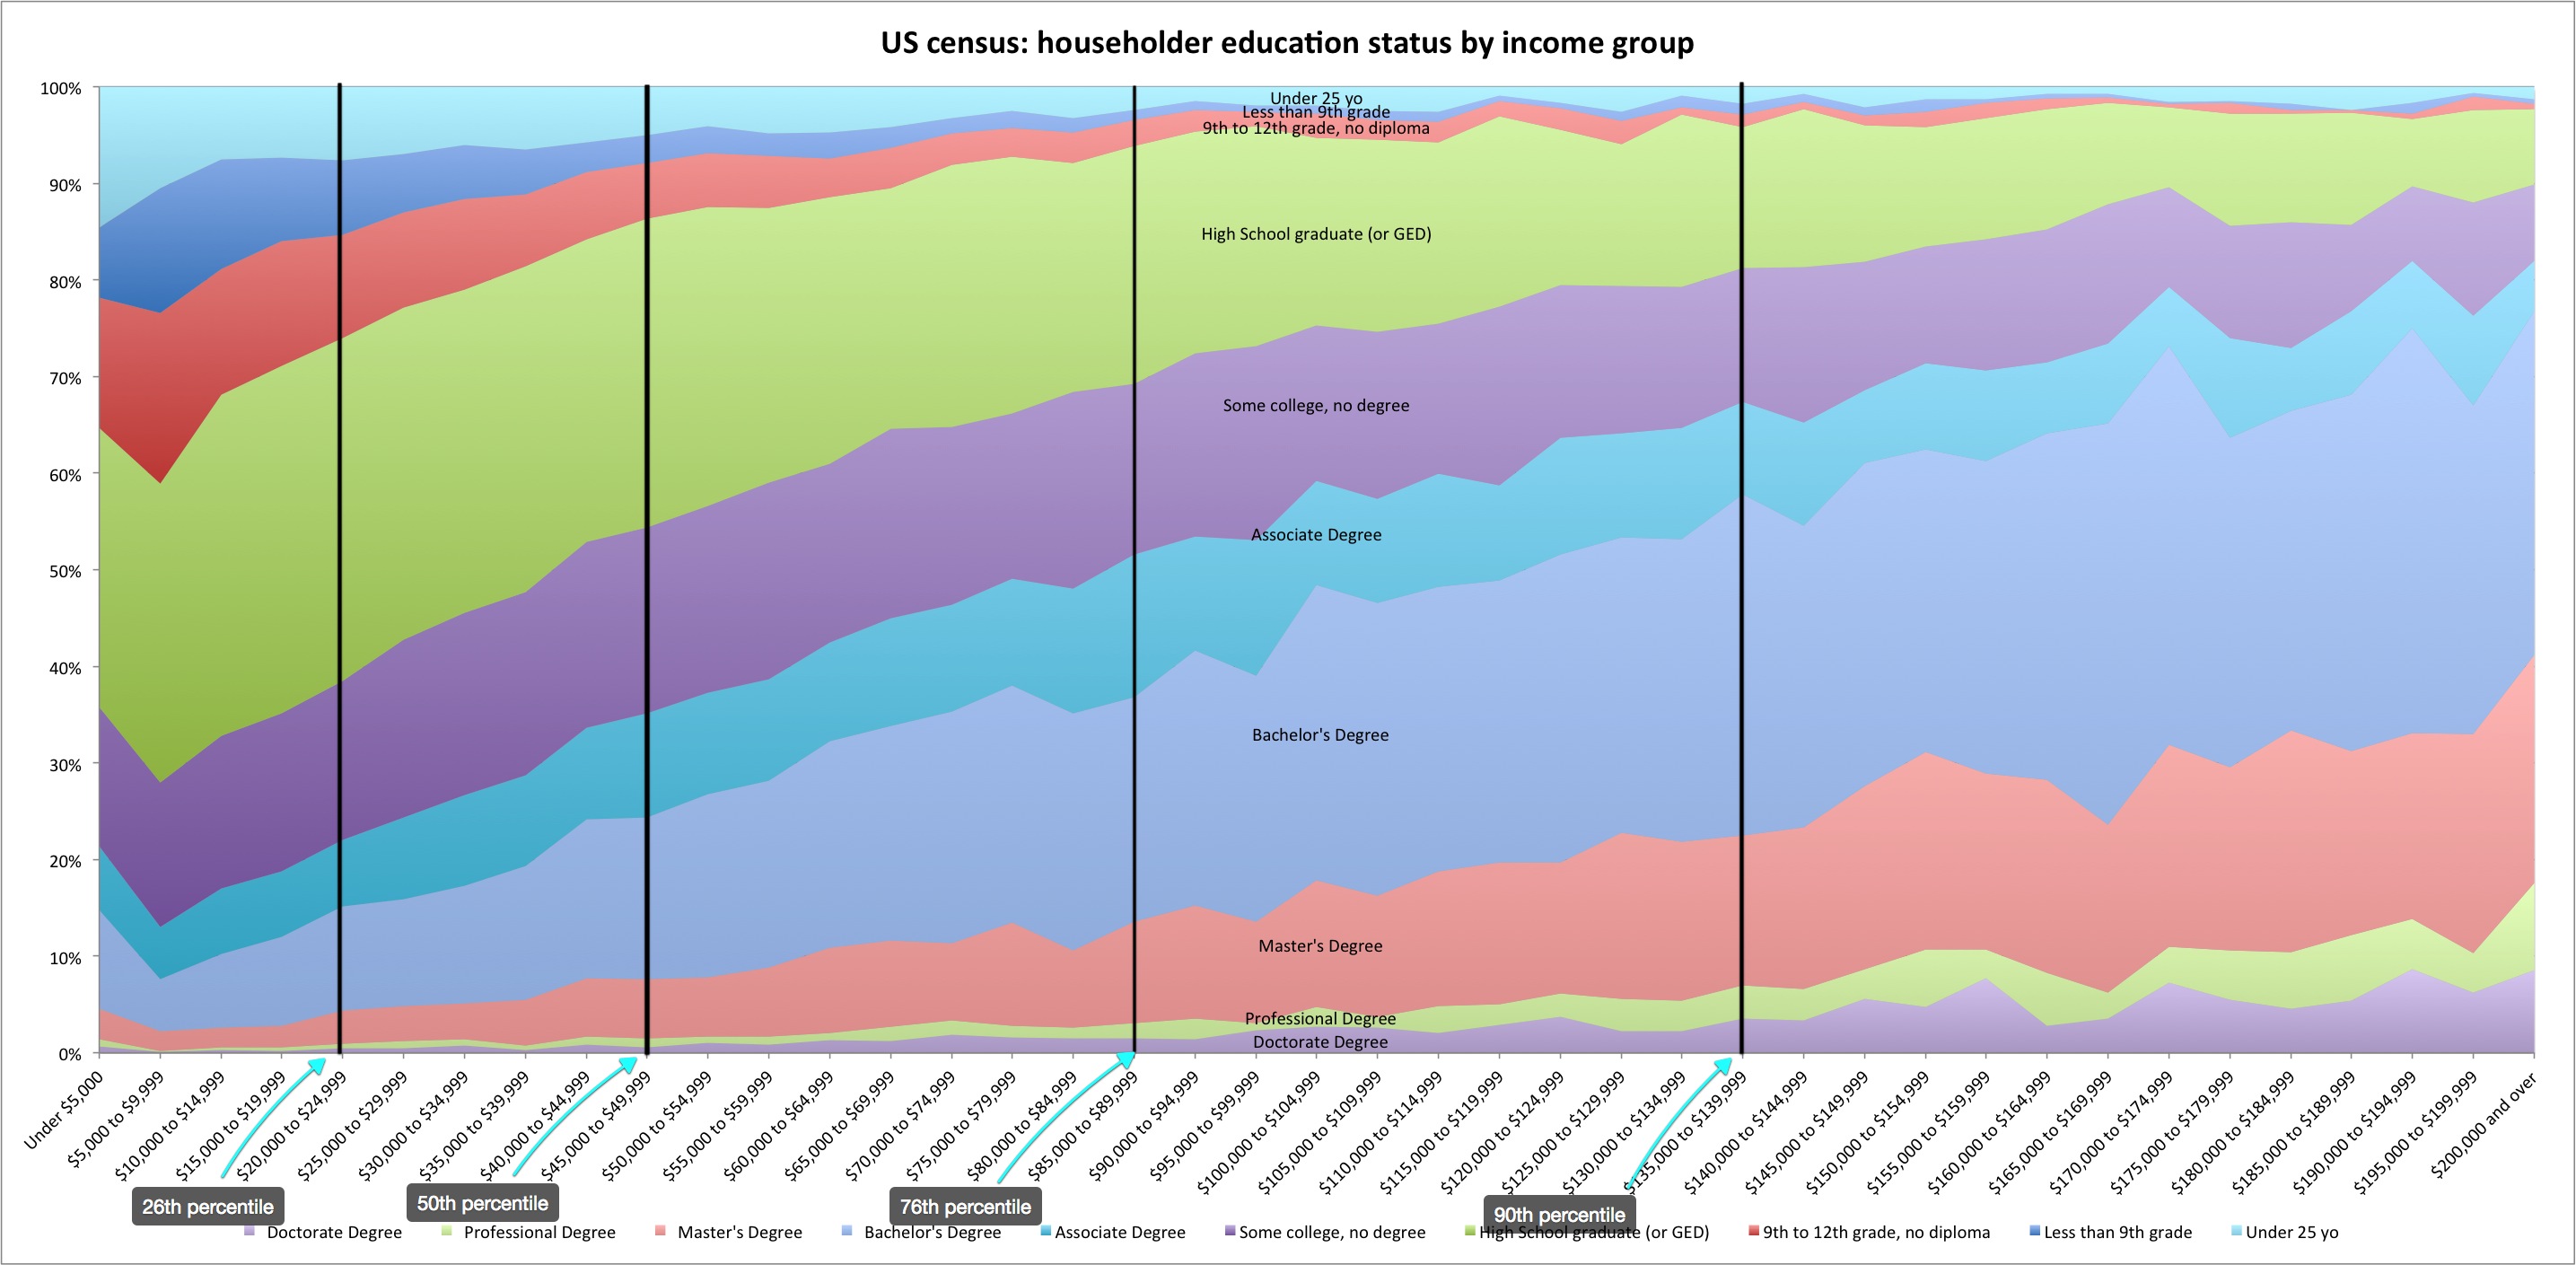
Observation: Probably somewhat obvious to most people, but the more affluent are substantially better educated on average — even relative to the “median” household — and not just in terms of advanced degrees, but even with respect to high school completion, associates degree or better, etc. [Clearly this is not determinitive, but it stll clearly matters]
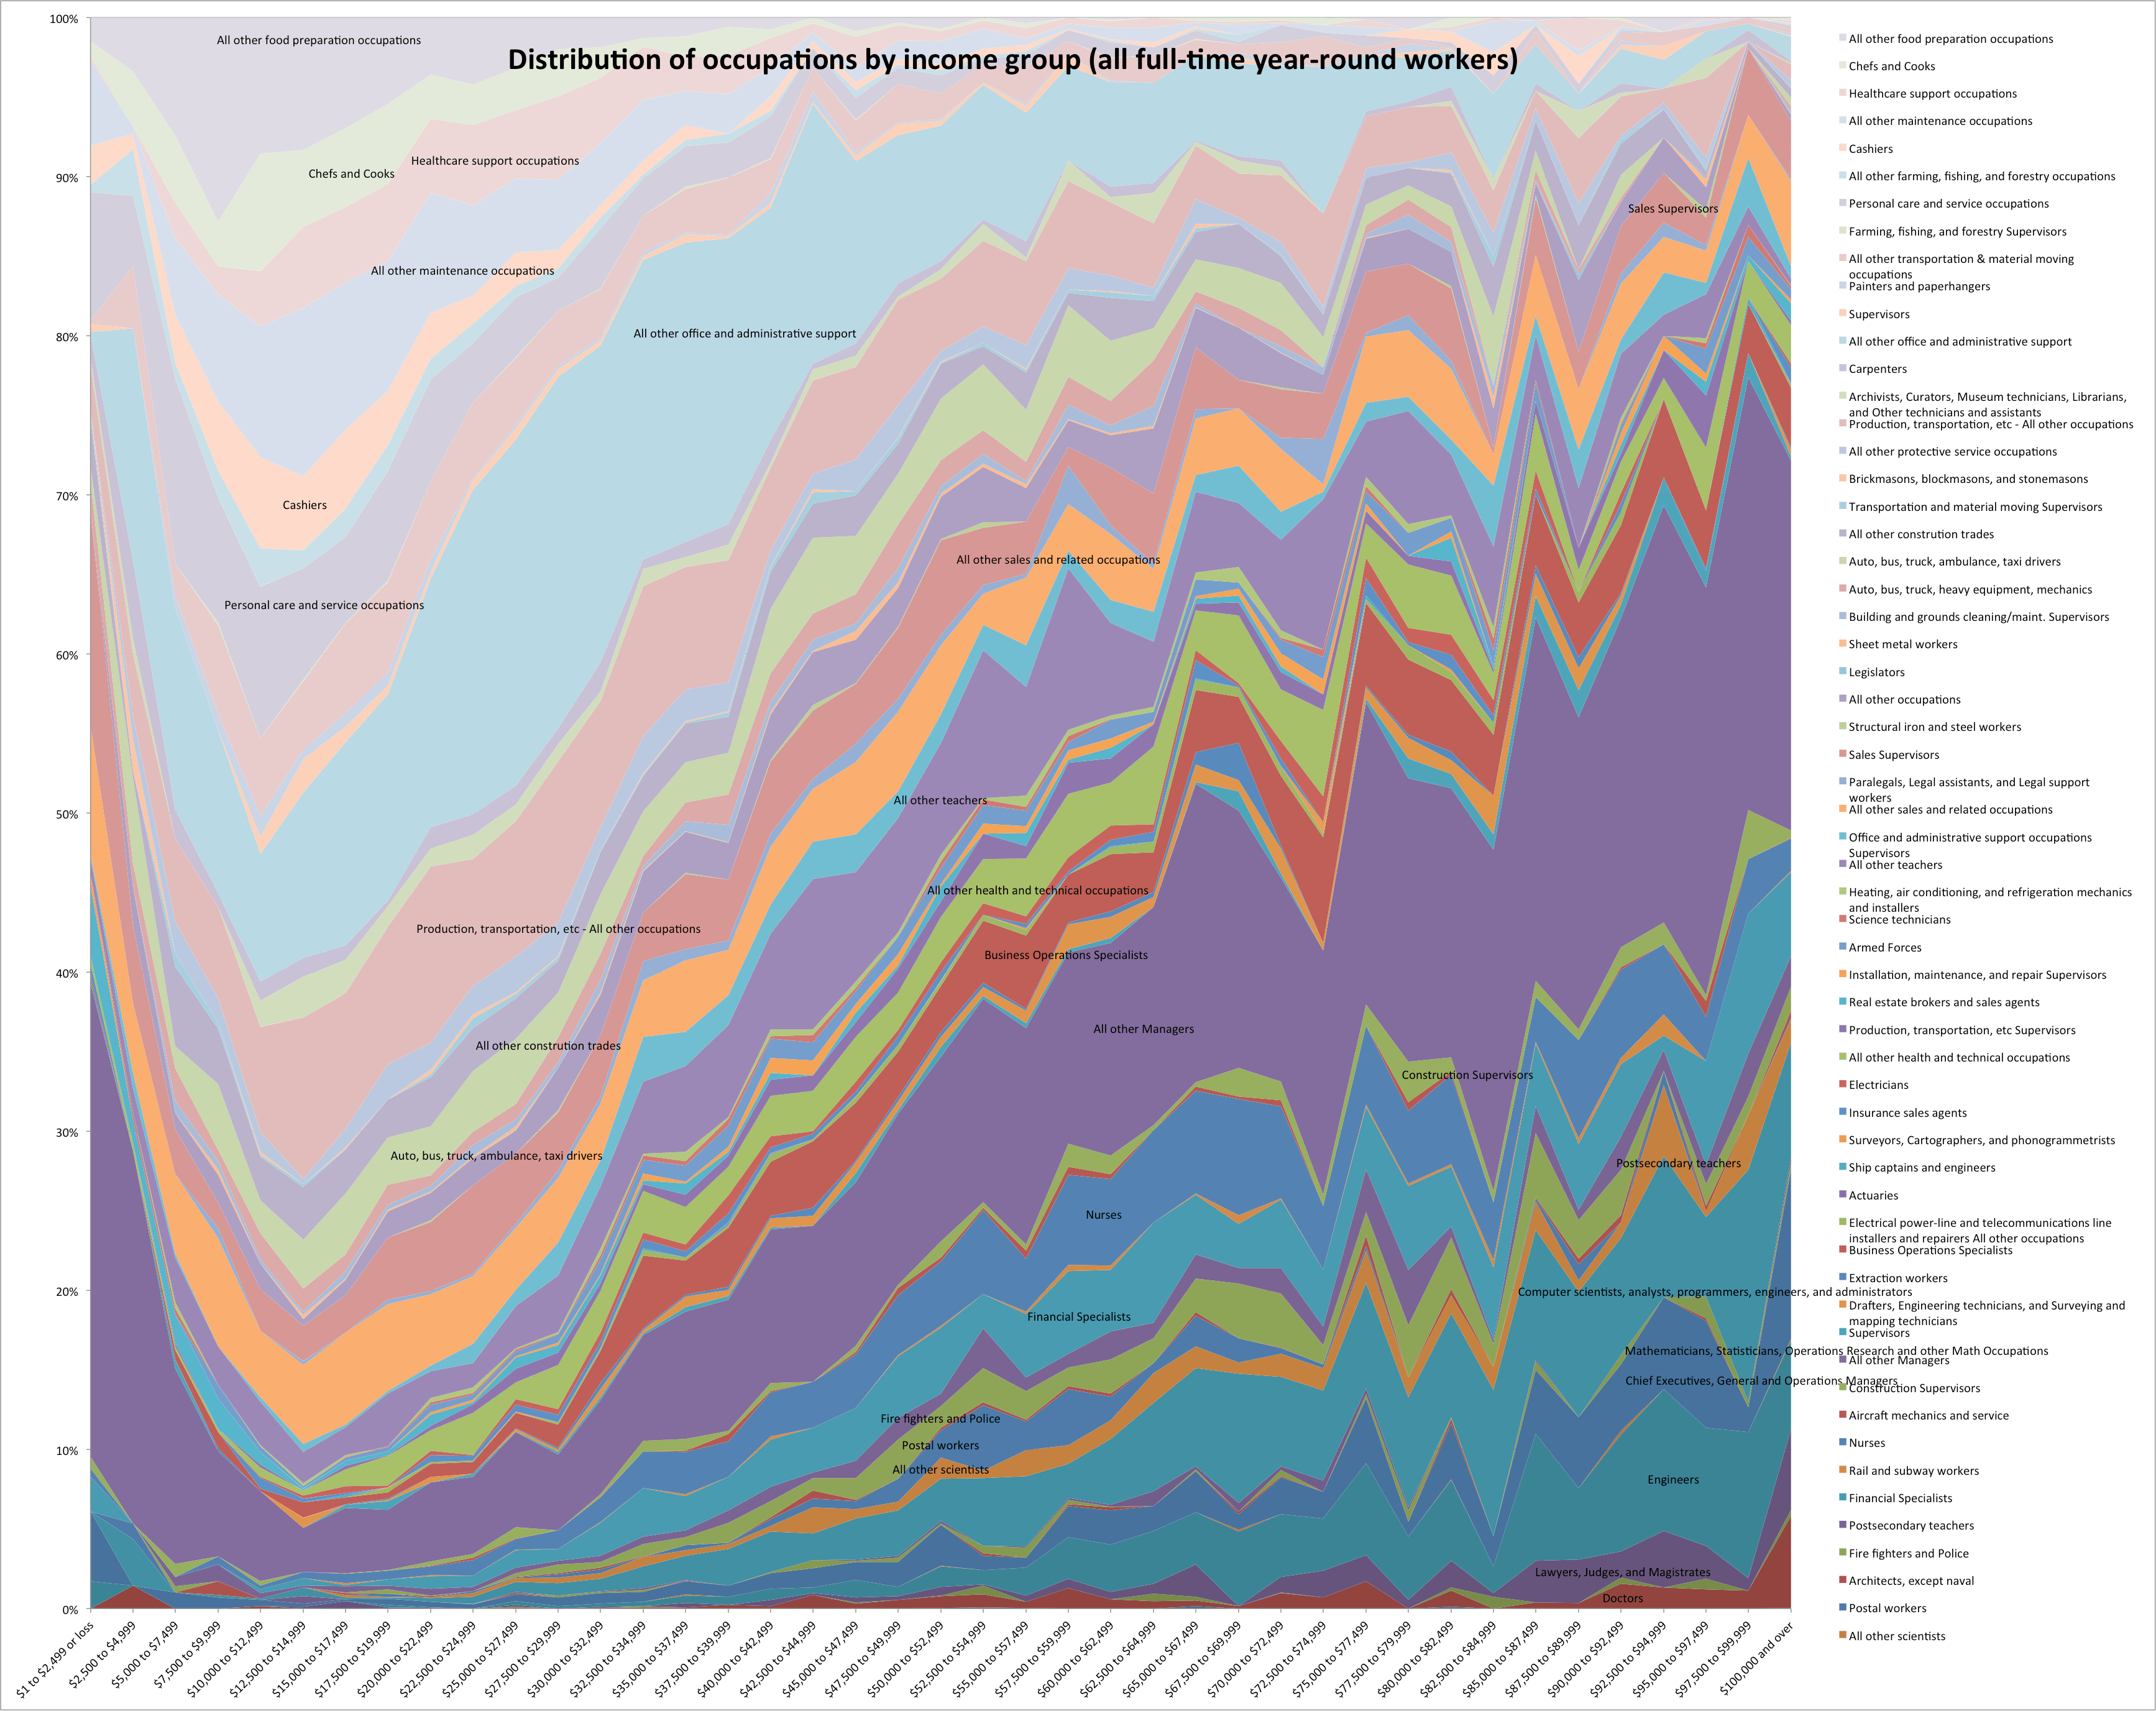
Distribution of occupations by income groups, amongst the full-time year round employed (all sexes, races, etc)
To wrap it up..
Though the household income distribution tells us something, in my opinion it is a lousy way to track the strength of the economy and, in particular, the strength of economic opportunity over time since the household composition has changed and continues to change over time. Much of the shift in distribution is the result of greater sorting of households along the lines of work, social capital, and so on than once existed.
Some misc issues
- Higher income households are now very likely to be dual income households and to a much greater extent than low income households whereas a few generations ago the opposite was certainly the case. Better educated professionals are far more likely to marry one another now — which will mechanically increase “household inequality” and, I’d argue, that the greater real returns for professionals (in particular women) has made the returns on working longer/harder more attractive.
- The increased real market incomes of low income earners combined with greater transfer payments, lower effective tax rates, and so on has likely facilated this shift. In other words, they may have greater real incomes per person or per earner, but they’re now divided amongst many more households, which will tend to hold down their $/HH.
- The retired elderly occupy a very large share of the bottom 25% of the household income distribution. Their “incomes” may be small (in particular if you limit this to AGI and exclude non-free investments, social security benefits, and so on), but many of them also have substantial savings and thus can spend substantially more than their incomes would suggest.
- The fact that many upwardly mobile young people are spending significantly more time in school (even taking longer to graduate to obtain a “4 year” degree) and waiting longer to get married and have kids, means that they will expand the number of low income earners for a period of time — even though many of these people have relatively modest income requirements (no kids and few spouses to support) and will go on to earn much more over the course of their lives — which will then bloat the upper end of the income distribution as they get established in their respective careers. [Their lifetime earnings will probably be higher, but not as much as these snapshots of “inequality” might suggest].
- Low income households are clearly much less likely to at all work and, in particular, work anything close to year-round. No doubt part of this is due to the presence of the young (students) and retired, but I simply don’t think it makes a lot of sense to speak of “inequality” without being upfront about overriding this issue. This issue, in other words, is not so much inequality of pay, but arguably inequality of actual job openings (or, perhaps, the motivation and ability to work)…
In my opinion, therefore, it makes far more sense to look at the distribution of income amongst people that are actually productive, according to the number of hours worked and their qualifications (e.g., H.S., graduate: Y/N?), and so on…. and then investigate the root causes of these disparities.
Source: US census data