As I mentioned in two (long) posts on how comprehensive measures of household consumption or disposable income explain high US national health expenditures (NHE) rather well, I believe US health expenditures are overwhelming accounted for by higher volume of health consumption (the quantities of goods and services consumed in the health care sector). I reject the popular notion that idiosyncratically high prices are what causes the US to spend so much more than other OECD countries and I reject the notion that rising health prices explain why US health expenditures have grown so much faster than income over the past few decades (at least).
This does not mean that prices play no role whatsoever in international comparisons of NHE. It does not mean, for instance, that if we could somehow force U.S. physicians, nurses, and various other workers in the health care sector to work for the real remuneration paid to their counterparts in, say, Brazil with equal productivity that the price of medical care, especially more labor intensive categories, would not plummet (presumably real NHE could decrease if volume were hold constant…. not a very safe assumption imo). It means that the reason health expenditures have accounted for an increasing share of our consumption (or income) over time has little to do with prices increasing relative to income and a great deal to do with the volume of health goods & services consumed rising at a faster rate than overall consumption (or income) per capita.

Much the same goes for international price comparisons in cross-sectional analysis. The cost of an internationally equivalent basket of health care (both goods and services) rises a little faster than the cost of a broader, economy-wide/GDP, basket of goods and services with rising income levels, but it does not rise all that much faster with respect to income (actually somewhat less overall in the long run).
In order to significantly explain the presumably large US residual in NHE per capita (obviously I don’t quite agree with this perspective) there must be a large residual in the actual relative price levels; we simply do not find any evidence of this with the best available evidence. With better data US residual is either slightly above trend (by no means an “outlier”) or below trend, depending on the precise predictor (e.g., GDP, AIC, average wages, etc) and the basket of goods and services employed. In no case do I find evidence of a large departure from trend in any broad, highly impactful, index of health price levels that would suggest that high US NHE isn’t overwhelmingly explained by high volumes of (real) health care consumption. More generally, the cross-sectional and time series data are actually quite consistent with each other, i.e., the issues that drive (US) expenditures up in time series are quite consistent with and related to the what we observe in cross sectional analysis between countries.
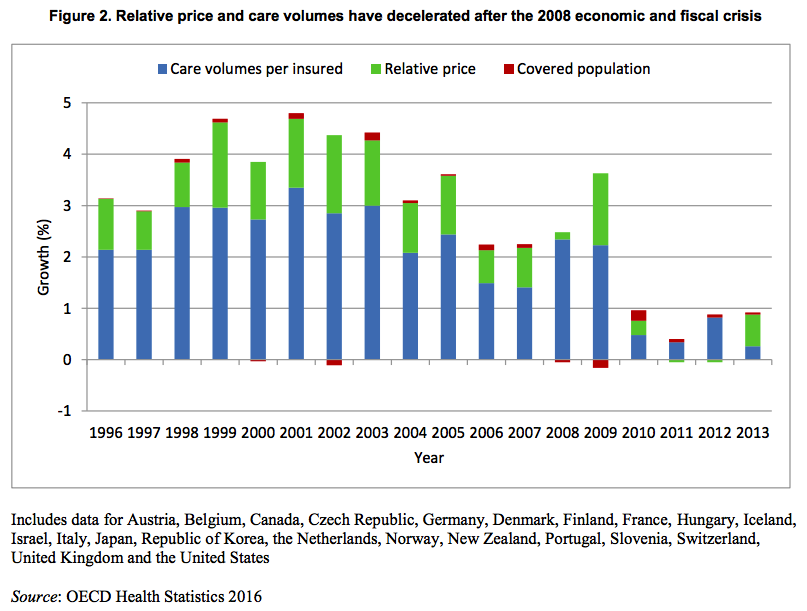
First, a quick and dirty cross-sectional comparison published by the OECD using their latest data (not yet available online, sadly).


source
According to this data US health expenditures are ~2.4 times (~240) greater than the OECD average using economy-wide PPPs whereas they are “only” ~2.1 times (~210) greater if we use the more appropriate, carefully constructed, health PPPs to convert US domestic expenditures into internationally comparable units (roughly the volume of health we actually consume per capita).
The relative differences between the two US PPPs are quite modest. A given amount of US dollars within the US only goes a little further if spent throughout the entire economy (GDP) than if spent on health if we compare the differences in how far these expenditures go throughout the OECD. My eyeball estimate of these figures suggests health is only about 14% more expensive according to the differences in the volumes they derived there. By way of reference the real volumes of GDP per capita was about 37% higher and AIC about 47% higher in the US in 2014 (note: if you look carefully at the plot, figure 4, you might also notice there is a pretty strong correlation between relative price levels and how wealthy these countries are).
Note: Sector specific PPPs for 2014, 2011, 2008, and 2005 from OECD if you’re interested in checking this out for yourself. In no case will you find US is 100% more expensive overall as implied by a handful of shoddy, but widely cited, statistics.
I can estimate this more precisely and do further analysis using the 2014 PPPs.

There is at least modest correlation between overall health prices and AIC. Though I am not the only one that finds AIC a more useful way to understand price levels and volume of health expenditures than GDP (see this plot, for example), we still obtain fairly similar results with GDP.

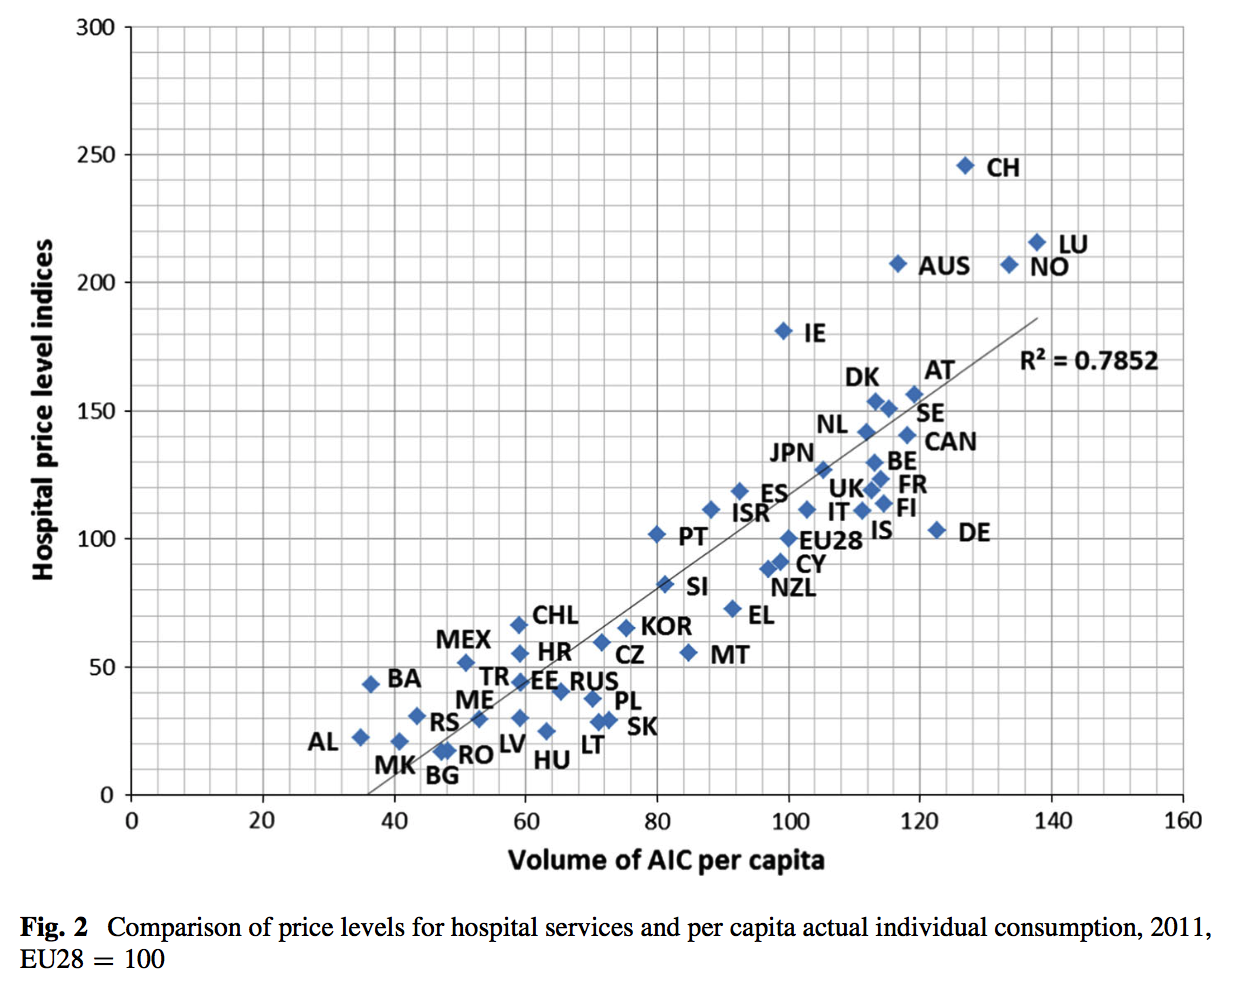
These relationships tighten up considerably if we restrict the PPP to hospital services (which lean more on domestic labor than the broader health PPP)

Here, as with the overall health PPP, US is actually below trend. The price differences appear somewhat more consistent with the handful of sloppily produced, yet oft cited, prices produced for surgical procedures by IFHP insofar as you might be able to see how the OECD estimates could be fairly accurate and the IFHP may not be exactly fabricated (insofar as there are several very real methodological issues with their methods, their comps are almost always poorer countries, potential for biased selection, etc etc).
By comparing these to the GDP (economy-wide) PPP, rather than to, say, individual consumption or AIC, I am likely inflating the GDP correlation some relative to AIC, but for completeness:

US is modestly above trend for GDP, though hardly what I would call an outlier. You might also note that Canada is similarly above trend despite the fact that they are one of the few countries with single payer. Given potential issues with measurement error, unmeasured differences in quality, likely a not insubstantial amount of volatility year-to-year, and so on I would not get terribly excited about any modest residual here, let alone be willing to confidently ascribe it to differences between health systems.
It is abundantly clear that hospital services are quite a bit more dear in rich countries than poor countries even though the differences in the actual overall health PPPs are quite modest (the weights attached to them and rising productivity in the less labor intensive areas likely explains this). This is quite consistent with research on the consequences of Baumol’s effect on health expenditures.

source
The (ball-park) central estimate seems to be somewhere around 0.6, which, if correct, implies that health prices only grow about 60% as fast as productivity (or equivalent) increases, which implies that if volume per capita were held roughly equal we would see the health share declining relative to income levels (price * volume = expenditure).
Health prices can still grow faster than other price levels and contribute to overall inflation even while not (usually) growing faster than income, remuneration, etc.

source
Hashing out Baumol
Although cost disease does not, in and of itself, drive NHE faster than income growth, it is still important to understand insofar as (1) more labor intensive areas of health care are likely considerably more subject to said effect than the overall index suggests (2) if the true Baumol variable were actually ~zero, if productivity gains in health equaled that of the rest of the economy, the elasticity of NHE with respect to income might be somewhat smaller (i.e, assuming volume doesn’t increase correspondingly in said counterfactual!) and (3) it is likely that most of the stable price variances we see between countries in these more labor intensive categories are a product differences in income levels, not to so much to differences in health policy (most of the relevant market distortions are shared quite widely across reasonably developed countries).
Potential differences in quality aside, it is very likely the reason less developed countries (e.g., Russia, Mexico, etc) generally have relatively “cheap” health care (especially hospital services) is because they are less productive overall, real wages are lower, and ~all goods are relatively more expensive as compared to services, not because these less developed countries have better health systems that lead to greater efficiency or because they have more monopsony powers to dramatically reduce the cost of relevant factor inputs.

In higher income countries, like the US, overall economic productivity is much higher, workers command higher wages, and skilled and motivated labor is particularly scarce. Services are generally not tradable and tend not to enjoy the same sorts of gains in productivity as seen in other areas of the economy (manufacturing, agriculture, etc) so they tend to rise with respect to goods in both the spatial (towards high income countries) and temporal (as countries move towards higher income levels) dimension.
We see these same patterns play out in more disaggregated expenditure categories.
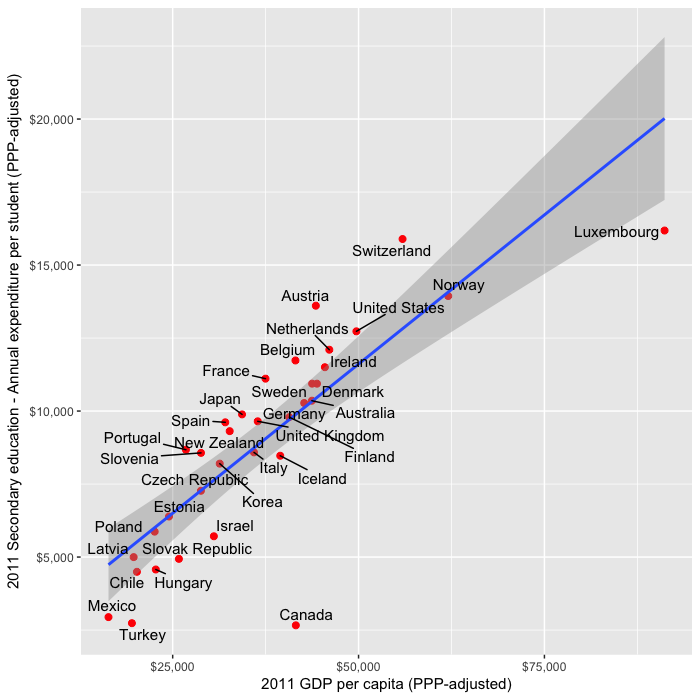
Like education:

Also note that the US’s high level of expenditures aren’t likely to be explained solely by high tertiary costs. We find conservative estimates of per pupil expenditures (not price levels) for primary and secondary schools track rather well with GDP despite the fact that it’s unlikely to be well explained by higher quality of teachers in rich countries.
Collective services (e.g., police, courts, etc):

Consumer services:

It is also likely some related issues have been found in construction costs and other areas that are predominantly non-tradable and/or fundamentally cannot match the productivity gains found in other areas of the economy.
These differences in service costs are also quite well correlated with each other.
For instance, hospital services vs education:

and to, much much lesser degree, overall health expenditures (which leans much more heavily on tradable & manufactured goods etc than the hospital services subset)

In short:
- much of the observed differences in health prices are likely to be explained by non-health system factors
- it correlates quite well with national income and consumption levels
- there are sound theoretical reasons to expect this
- the US residual is not especially large (very much contrary to popular belief)
- the impact of prices differences on real expenditures is generally vastly over-rated (it only marginally reduces the differences in volumes associated with income levels)
Domestic time series
The limited role of price found in health PPPs and the like between countries or in OECD analyses is also consistent with domestic time series studies in the US and other countries. For instance between 1940 and 1990 estimates of the increase in per capita health expenditure attributable to medical price inflation range from 0 to 22% (a period in which income more than doubled).

source
Likewise since 1970 nominal GDP per capita has grown at least as fast as the PCE health index, which is regarded by experts in this area as being amongst the best price indices for health prices.
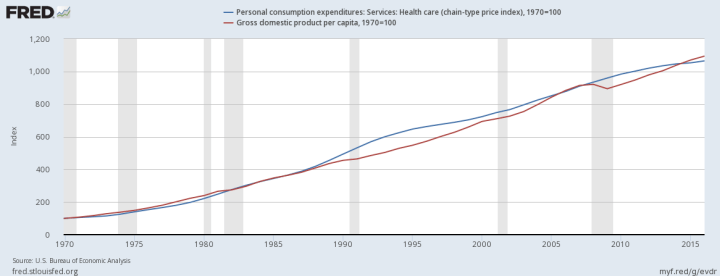
source
If this index is presumed to be reasonably representative of true (overall) NHE prices more broadly this means that price increases do not explain the large long run increase in NHE relative to GDP in this span and that the overall long run increase is almost entirely attributable to increases in volume. In reality there is good reason to believe these price indices miss real quality improvements in treatment and that treatment prices tend to overstate overall NHE costs in the long term (productivity improvements in other areas that sway NHE), i.e., the actual volume increase is probably somewhat larger still.
I index from 1970 in the plot above to make a point. Up until late 70s/early 80s US NHE was comparable to the NHE seen in other rich OECD countries, the plot above, however, suggests the price of health care in the US didn’t suddenly shoot up relative to incomes. In other words, changes in price are unlikely to explain it whereas changes in consumption and disposable income largely do (the US clearly diverged more starkly from the rest of the OECD in both of these dimensions in this same time period and both are exceptionally strong predictors of NHE). You would need to have some strange beliefs about the prices that must have existed in the US in the 70s to try to explain cross-sectional differences through prices if these price indices are reasonably accurate, as I think they are.
There are also some recent studies looking at disaggregated data on private claims:


source
Most categories saw little to no price increase and overall there was effectively zero net increase in prices.
This is not contradictory
To be perfectly clear: there is no contradiction in saying that overall health care prices have risen much faster than broader price indices and that the reason we spend more on medicine relative to our incomes is because we actually consume much more health care in real terms. This entirely consistent with Baumol’s effect and what Baumol’s variable greater than zero and less than one implies (see the 0.6 estimate in the OECD report above). That is, it implies that the price of said goods and services rise causally in response to greater productivity in other areas of the economy (rising prevailing wage levels without corresponding gains in the sector’s productivity) but less than the actual wage increase.

source
As we have gotten much more efficient at producing manufactured goods, food, etc domestically and have enjoyed the benefits of cheaper labor for tradable goods (and some services– see foreign call centers, transcription services, etc) via “free trade” those remaining categories of expenditure, like health and education, which cannot or do not exploit automation, labor in non-rich countries, etc to nearly the same degree will appear to shoot up in relative terms. This, of course, does not imply that they have truly become less efficient (with the same real factor inputs) or that the relative change in price level causes us to spend more relative to good measures of national income (note: the cash remuneration observed in common wage measures is very much incomplete insofar as it tends to exclude benefits, which have clearly risen considerably, not to mention profits/investment income and the like, which also contribute to AIC, GDP, etc).
So while it is generally true that we could buy a considerably larger basket of other goods and services (e.g., electronics, clothing, food, etc) for what it costs to buy the equivalent basket of health care in 2017 as compared to 1970, it is generally not true that the overall, long run, rate of growth in health price levels has exceed the average rate of productivity growth, GDP per capita, AIC per capita, etc (although this gets increasingly blurry as we approach an index/measure than lean much more heavily on domestic labor inputs) or, in and of itself, i.e., without increase in volume, could explain why overall health care costs are rising faster than income.
Health workforce
I believe in multiple lines of evidence so, to this end, I will present some data that points to higher volumes and suggests that price (especially via higher medical wages) is not the issue people think it is.
For instance, between 1965 and 2011 the health sector grew from ~3% to ~11% of the non-agricultural civilian workforce, a more than a 3.5 times increase in its share (and likely more of the workforce overall).
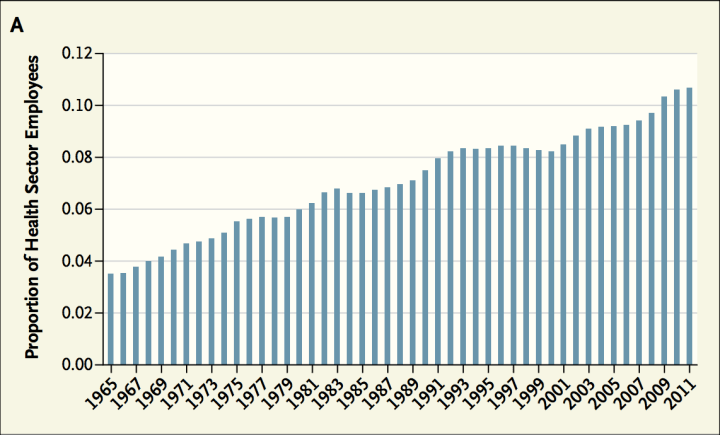
source
Clearly this isn’t just the roughly same number of providers demanding ever more money for their services. This is consistent with rising volumes of health care: more providers of various sorts, more technicians, more para-professionals, etc providing, administering, or otherwise facilitating the delivery of health care at various levels. Is it theoretically possible these people aren’t employed productively and that we suddenly forgot how to run a reasonably efficient system? Maybe, but that strikes me as highly unlikely (especially when we’re likely witnessing similar patterns in other developed countries).
Physicians wages explain little
Likewise, while quite a few people allege physicians are the culprit for (supposedly) high US prices (presumably due to uniquely restricted supply), increasing physician remuneration is not likely to explain much in cross-sectional or, especially, domestic time series analysis.


source
Or, over a longer period (albeit from blog):

source
And the ratio of physician remuneration relative to average wages is not that much higher than seen in other developed countries:


source
Keep in mind that both the US remuneration levels are for the self-employed (salaried rates tend to be quite a bit lower in the US and other developed countries due to differences in responsibilities, hours, etc) and total physician remuneration only accounts for something like eight or ten percent of health care costs. Even if US physicians worked for the wages seen in, say, the UK, setting aside all the other differences that contribute to this, the implied amount this would save isn’t exactly overwhelming.
On proxies for volume
Curiously some people make the claim that because the US doesn’t have more physicians, physician consultations, hospital beds, etc on a per capita basis and has shorter hospital stays that that must mean that it cannot be explained by volume (quantities) and that price must therefore play a major role. I spoke to these issues in a prior blog post, but, briefly, what they neglect to mention is that these measures are, for the most part, weakly to even negatively associated with NHE amongst OECD countries. If they can’t explain more than a few percent of the variance, many coefficients in the “wrong” direction and/or insignificant, there’s little reason to believe these variables say what they think about the US system. It is just not a good representation of what drives modern health care costs (maybe 50 years ago the correlation would be much higher). Moreover, if one looks at a much broader (albeit still woefully incomplete) array of rates of procedures, treatments, diagnostics, and other health system characteristics the US behavior is quite consistent with what we find in other high income countries (whether or not these patterns amount to “good” medicine or is “worth it” is another question), but we can at least say that high income, high NHE countries tend to behave like this, increasingly so as they get richer. It is also not unreasonable to think these characteristics (greater use of technology, diagnostics, cutting edge treatment, etc) would be causally associated with higher levels of health expenditures.

Evidence pertaining to a handful of other (tangential) arguments
Some people argue the US healthcare is so profoundly different than other countries that this must somehow explain stuff. While I can’t speak to every argument with sufficient length and detail, here are some statistics which suggest these sorts of differences are not all they are cracked up to be and that the US system generally looks much more like the rest the OECD than many people appreciate (especially on the delivery end).
Health finance
The voluntary/private/out-of-pocket share of NHE isn’t that much larger than many others and these don’t correlate with overall NHE significantly.

source
Net cost of health insurance
The net cost of (private) health insurance, the difference between what insurance companies collect and what they pay out in benefits, has averaged around 5-6% of NHE in recent history.

source
This very much includes the cost of processing claims, anti-fraud efforts, contracting with providers, coordination of care (kaiser etc), investing, marketing, executive salaries, and so on and so forth. Much of this is clearly needed under any reasonable system (some of the ‘savings’ in lower administration costs under Medicare, for example, also lead to higher rates of fraud and waste — not necessarily a ‘win’ for society).
Per beneficiary costs of private and public plans
Both Medicaid and Medicaid programs spend substantially more per beneficiary than private plans.

source
Obviously these population differ in substantive ways (age & income/poverty status), but no one could reasonably claim to call them cheap in the ways that matter. They are still clearly much more expensive than what we see in lower income countries for equivalent populations.
Hospitals
The for-profit share of hospital beds in the US is quite modest and not much larger than many other OECD countries:

Though some might argue non-profit hospitals aren’t publics and that there may be some principal-agent problems, these sorts of issues don’t necessarily disappear in public institutions (not to mention other problems can arise) and we can at least say that the non-profit distinction is an important one insofar as actual profit motive is concerned.
Concentration and persistence
Though many suggest the allocation of health expenditures across society is abnormal, the best available evidence suggests the US looks much more the rest of the developed world as a function of age, end-of-life status, health status, income levels, and so on.


Conclusion
The better data suggests price has been massively over-emphasized and the role of volume has been given short shrift in both public and academic forums as explanation for high and rising health care expenditures. Demonstrable errors have been allowed to go unchecked for some time even in exact sciences like (applied) physics. It surely doesn’t help that this area is highly politicized, the data have not been that good, and it takes a composite of a good number of data points with sound methodology to generate a truly representative sample to draw robust conclusions (only in recent years are the health PPPs reliable enough to take very seriously). Idiosyncratically (very) high US prices has become received wisdom and even honest, intelligent people that must know better (because they’ve actually reviewed enough of the pertinent the data) dodge the issue. I have seen numerous cases where objective quantitive results of the researchers’ own work rather soundly contradicts casual assertions made and many other cases where inconvenient data like this are simply truncated from plots and allowed to go without comment (though accessible in tables, appendices, etc for those with sufficient interest and attention to the topic)…. likely because the researchers efforts are not especially concerned with US prices specifically and they would rather avoid getting mired in controversy.
It seems likely people are wildly overpromising the changes any realistic reform of our health care systems could bring, both with respect to the long term trajectory of health care costs and the so-called health outcomes. I suspect our high and rising consumption of health care is largely a function of national wealth (+/- modest differences in propensity to consume, fiscal policy, etc) and I see little evidence that suggest that the different systems found throughout the OECD, let alone the average one, will produce much in the way of sustained savings. As in, even if we manage to marginally reduce health prices through use of greater monopsony powers, it’s not without some tradeoffs (e.g., reduced R&D incentives, reduced dynamism, etc) and it’s quite likely to spur further health consumption (not necessarily a significant net reduction in expenditure or a net gain in health outcomes). Though I certainly believe the systems found in several other OECD countries work reasonably well for them and have some advantages (and disadvantages), it’s just not the black and white issue people make it out to be where we’re simply leaving piles of cash on the table for no real reason and that all we need to do to capture it is adopt any other system.
Thanks as always for all the research that goes into these excellent reports.
What about the fact that Utah spends less on Healthcare per capita than Canada and Arizona just a little bit more? That makes it look to me like healthcare spending in the USA could be much lower than it is. It also looks to me like it is state regulation that makes health care spending so high in soem states. See: http://www.kff.org/other/state-indicator/health-spending-per-capita/?currentTimeframe=0&sortModel=%7B%22colId%22:%22Location%22,%22sort%22:%22asc%22%7D
Utah is the youngest state in the union by about three years.
http://overflow.solutions/demographic-data/what-is-the-median-age-of-the-residents-in-each-state/
Of course, you might make note of the fact that Alaska is the second youngest state, and yet their health expenditures ranks quite highly. I would blame this on how expensive the state is general (due to their remoteness) combined with the state’s high income.
Your charts for physician compensation appear to show that between 1995 and 2003 both GP and Specialist compensation went down. These numbers seem way off. Medscape compensation report shows that between 2010 and 2016 (6 years) doctors’ salaries went from $200K to $294K, on average. That’s an increase of almost 50%, or $100K, in just 6 years. Can you say that about any other profession?
Forgot to provide a link:
https://www.medscape.com/slideshow/compensation-2017-overview-6008547#3
Your data is 10 years old on doctor salaries – makes the entire analysis suspect.
1) The bulk of the analysis in this blog post is regarding the overall prices per transaction (visit, procedure, etc). It does not meaningfully rely on estimates of what physicians actually take home each year as the impact of physician wages on prices are observed at the transaction level.
2) Physician income accounts for around 8-10% of health spending nationally. The potential for elevated physician remuneration to explain US health spending is much more limited than many seem to believe.
3) US health spending was also much higher 10 years ago and there’s not much reason to believe US physician pay has shot up relative to other highly developed countries since.
4) OECD stopped publishing data on US physician salaries, so I didn’t have much choice there. That said, I will likely be doing a follow up analysis of physician pay using other data sources in the not too distant future (when I have the time).
About 2), it’s about 20%, not 10%. Hospitals are another 35% – 40%. See for example page 70 in:
https://www.cdc.gov/nchs/data/hus/hus16.pdf#094
Even this number, 20%, is misleading as over the past 10 years many hospitals have been buying private practices (my doctor is now employed and paid by a large network of hospitals).
Also see here:
https://www.cms.gov/research-statistics-data-and-systems/statistics-trends-and-reports/nationalhealthexpenddata/nhe-fact-sheet.html
Year 2015 Amount in Billions
National Health Expenditures $3,205.6
Health Consumption Expenditures 3,050.8
Personal Health Care 2,717.2
Hospital Care 1,036.1
Professional Services 840.2
Physician and Clinical Services 634.9
Other Professional Services 87.7
Dental Services 117.5
Other Health, Residential, and Personal Care3 163.3
Home Health Care4 88.8
Nursing Care Facilities and Continuing Care Retirement Communities4, 5 156.8
Retail Outlet Sales of Medical Products 432.0
Prescription Drugs 324.6
Durable Medical Equipment 48.5
Other Non-Durable Medical Products 59.0
Government Administration6 42.6
Net Cost of Health Insurance7 210.1
Government Public Health Activities 80.9
Hospital care, physician salaries (including dentists etc. here see table) $1.88T of the $2.72T spent in 2015 on healthcare. That’s up from $1.45T of $2.11T in 2009 (increases of about 30% hospitals + doctors, and overall)
3) Overall healthcare spending went up probably because doctors and hospitals can charge whatever they want. And as shown above hospitals + doctors are about 60% of healthcare costs. As a consumer, this is what you see – the price increases delivered by doctors and hospitals (and drugs to a lower extent).
No, actual physician remuneration (salaries, bonuses, benefits, net-income, etc accruing to physicians as a result of their work) is around 8-10% of NHE. Physician and clinical services have averaged around 20% of NHE for the past couple decades (+/- 1%), but this is a measure of the proportion of expenditures that are billed by and paid to physician offices (including most physician services in hospitals), outpatient centers, and lab services. cite.
Physician offices, outpatient centers and the like employ a lot of other people (about 6 other workers for every physician and surgeon in physicians offices nationally). Quite a bit less than half of their revenue actually credibly makes its way to physicians after accounting for overhead (other clinical staff, receptionists, IT, imaging, labs, rent, administration, malpractice, etc etc etc). You can see some quick estimates of overhead here.
The physician share of hospital expenditures is much smaller than the <50% found in physician and clinical services category (about 8% of their wages, less of total comp, and even less of their total revenues).
I do not dispute that the lions share of current health expenditures flow through professional health services and hospital organizations (~80%). My point here is simply the share of health expenditures that end up in the pockets of physicians and surgeons is around 10% of total health spending. Even if we could compel US physicians and surgeons to accept the multiples of average national wage seen in, say, France, setting aside differences in opportunity cost, education, and so on and so forth, we’re still only talking around 1-2% of health spending. In other words, the potential for savings under semi-realistic reform scenarios that could be produced by reductions in physician pay alone are actually rather modest (and probably over-optimistic, if anything).
To follow up to my earlier response, here are the 2015 estimates for general practitioners and specialists. I spliced comparable data from the 2015 MedScape physician compensation report to capture the US with OECD’s reported multiples. I find MedScape’s data to be credible and generally consistent with current BLS estimates, earlier OECD estimates, and so on. This picture hasn’t much changed.
General practitioners and specialists, respectively, average around 2.5 and 3.5 times the average wage in each country. Relative to average wages, average annual physician compensation in the US is not much above average. The picture is even less dramatic once you account for limitations of the data (comparability issues) and other factors. For instance, the multiples found in former eastern bloc countries tend to be low due to the legacy of communist influence (lots of physicians per capita, low prestige, high % female, etc). The nordic/scandi countries tend to have more compressed income distributions generally, so they don’t need to pay as much, relative to average wages, to attract and retain this sort of talent.
If you look at relatively more comparable countries, such as Canada, Germany, France, and other reasonably large, relatively more market oriented economies the differences are typically even smaller. Keep in mind that many of these other OECD countries also have more physicians per capita and their physicians work somewhat fewer hours (amongst other issues), so the below average annual compensation for physicians don’t necessarily correspond causally to lower prices or a reduction in overall expenditure levels for physician services (not to mention the role of physicians assistants, nurse practitioners, and the like in the US….)
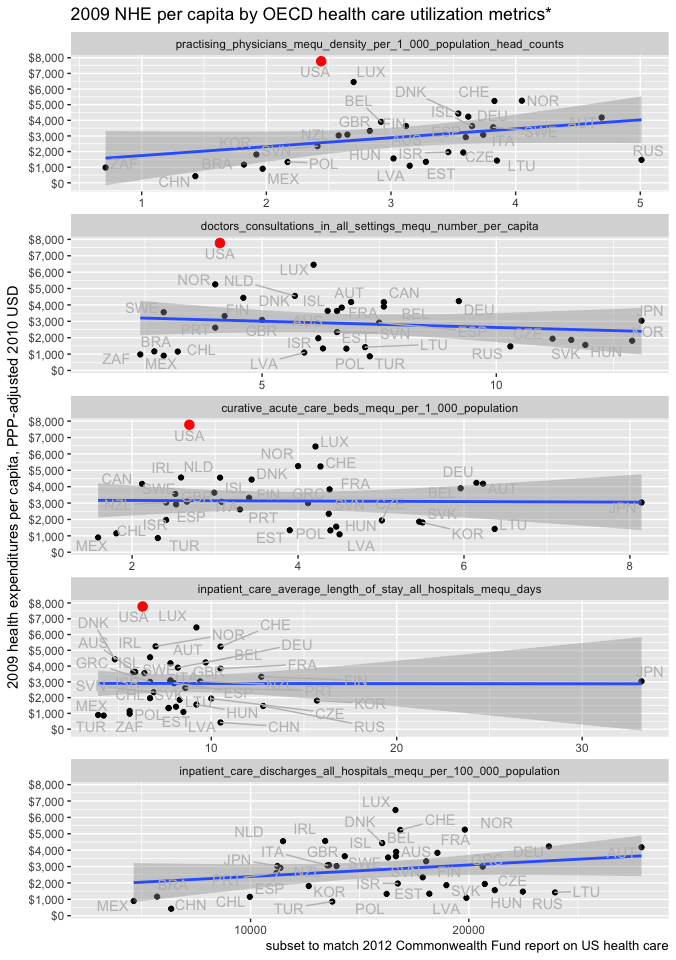
The premise of the article (kudos, a lot of work there…) is that higher income and consumption are the root cause of higher healthcare spending in US. But everywhere I was able to find data, US shows fewer hospitalizations per person with shorter stays, fewer doctors visits etc. While there IS higher utilization vs other countries, it is only for expensive technology (which come with higher prices). IMO, the higher income in US is not causing higher spending. Rather, the higher income allows for higher prices (up to a point, after which the system will blow up). In 2013 bypass surgery was $15K in The Netherlands vs. $75K in US (link below). I don’t think such a massive price differential can be justified by the higher income in the U.S.
http://www.commonwealthfund.org/publications/issue-briefs/2015/oct/us-health-care-from-a-global-perspective
Thank you. Yes, I’d put it as: higher real material living conditions, whether measured by comprehensive measures of household consumption or disposable income, explain ~90% of the variance in health spending internationally and do an excellent job of explaining why US health spending appears to be an outlier (not to mention a several other outliers as a function of GDP, some of which have received a lot of attention in the media and policy circles, such as Singapore). Not only are these household measures much better correlated with health spending, they also nearly fully mediate the role of GDP (or the other components on GDP) in multiple regression analysis.
Health spending is not unique in this behavior either. If you perform dimension reduction techniques, like PCA or factor analysis, on the various components and sub-components of consumption (even if they are transformed to z-scores, log scaled, adjusted for category specific prices, and so on), the factor or component scores that naturally fall out of this sort of analysis is consistently nearly perfectly correlated with these measures of living conditions (as in, PPP-adjusted AIC per capita and PPP-adjusted net-adjusted household disposable income). Likewise, if you want to do a simpler analysis, you’ll also find these individual expenditure categories behave much like health as well, as in, they are individually much better correlated with material living conditions than GDP and material living conditions mediates GDP in OLS.
In other words, the consumption behaviors of countries relates directly and very strongly to how much households have (or think they have) to spend on a per capita basis in a given year, as measured by AIC or nAHDI. Moreover, some categories have much different elasticities than others, meaning that the proportion of consumption allocated to particular categories of goods and services changes quite dramatically with wealth, and the behaviors are quite consistent in both the spatial (country) and temporal (year) dimensions. The basket of real goods and services consumed per capita, whether adjusted with more granular PPPs or the broader economy-wide PPPs, can be quite well predicted over time and across countries with constant PPP-adjusted AIC per capita (highly elastic goods and services like health to a much greater degree than in less elastic goods like food). Whether GDP is higher or lower than expected, conditional on the household dimension, is practically irrelevant across these consumption categories (near-zero marginal informational value).
There is also a fair amount of intellectual/theoretical support for this argument from leading left-y economists (they propose AIC and aHDI in the paper as their preferred measures of material living conditions)
But, as I pointed out in an earlier blog post, these utilization metrics proffered by the Commonwealth Fund and others do a terrible job of explaining overall health spending . Number of doctor visits per capita, for instance, is actually slightly inversely correlated with health spending (quite possibly spuriously). Even in a multiple regression, where we risk overfitting, these measures collectively explain just 14% of the variance (many in the wrong direction for this argument to hold btw!) and are fully mediated by AIC.
If they can’t explain more than a very modest fraction of health spending in the OECD in general, even excluding the US, and many of these indicators point in the opposite direction argued (the model isn’t even plausible), one can hardly credibly claim that these indicators constitute a meaningful indictment against the US health system. Indeed, I’ve gone a little further than this recently and have shown that even if we compare inpatient curative spending and to similarly crude measures of inpatient curative volume, the number of discharges and/or bed-days per capita, there is almost no relationship….
The weight of the evidence strongly suggests:
(1) national health spending is driven by national material living conditions (~90% of the variance)
(2) it’s overwhelmingly through real volume per capita, not price levels
(3) the lions share of volume is through greater intensity per visit/encounter/etc, not number of visits, bed-days, etc.
Put differently, although there seems to be some idiosyncratic differences in how frequently people visit the doctor, hospital, etc in different countries, the change in spending over time within countries and the variance in spending between countries is generally orthogonal to encounter utilization metrics like doctor visits, hospital admissions, bed-days, and so on. Rather, the evidence suggests countries adopt increasingly intensive care as they get richer and the number of visits, disease burden, and the like plays a much smaller role in determining national health spending than most people seem to believe [N.B., even though disease burden and the like surely influences who, how, and where money gets spent (within a given country and year) and probably how much is spent per encounter to some degree, it’s not necessarily changing the net expenditure appreciably because societies largely adjust to live within their latent willingness to spend on health].
Actually we see this in lots of other areas as well (not just expensive diagnostics)! This sort of “spare no expense” medicine, which we clearly see in the US, is largely a product of our exceptionally high national wealth and we see similar behaviors in other countries in proportion to their wealth.
The IFHP data, which the Commonwealth Fund used in their analysis, is not reliable. Doing this sort of analysis properly is non-trivial. Their data sources are too limited and their methodology is too weak to be up to this task (not to mention minimal disclosure of methods, data sources, etc). They don’t do nearly enough to address issues that seriously confound attempts to infer differences in true price levels. For instance, they list “prices” for MRIs for multiple countries, but in some countries it includes actual expert analysis and in others it includes facility fees and so on and so forth. In many cases the price clearly isn’t even for the same bundle of goods and services. It’s also not reasonable to compare administrative prices in non-market (state-run) transactions to market prices. There are many other issues.
The health price analysis conducted by OECD affiliated researchers as part of their health PPP series, which I described in this blog post (aboe), is by far the best data we have on this topic. Unlike the IFHP reports, they take careful consideration of the issues I’ve alluded to and construct vignettes to ensure we make as close to “apples-to-apples” comparisons (quasi-prices) as we can reasonably make today. Their analysis strongly suggests US prices are not particularly high and that high US health spending is overwhelmingly explained by real volume per capita.
It suggests that the weighted average of US health prices were only ~10% above the OECD average in 2014 and generally on or even below trend. The hospital services category, which tends to be much more determined by domestic labor costs, was ~70% above the OECD average in 2014, but not much above trend (to even below trend with the more appropriate AIC measure). Whereas the price for labor intensive price levels like hospital services tends to move in lock-step with real income levels (almost 1:1), as Baumol’s effect suggests, the overall price level of health care in the US and other rich countries is kept down by some combination of falling prices on other goods and services in health care, which are tradable and/or manufactured so as to exploit large productivity gains, and increasing shares of them.
Btw, to your earlier point about shorter hospital stays, part of the tradeoff in a high income, high productivity countries is that the real price of domestic labor rises faster than inflation — (domestic) services tend to be a lot more expensive than (tradable/manufactured) goods. To keep health care costs down rich countries need to become more efficient, to reduce labor inputs to obtain the same (or comparable) services. One of the ways health systems have discovered is by reducing unnecessarily long hospital stays (which require clinical supervision, food, environmental services, patient transport, and so on and so forth). Similar patterns are observed in other OECD countries. However, by shortening hospital stays and keeping people out of the hospital in the first place (US does a lot of stuff on an outpatient basis), the average price per bed day will tend to rise, ceteris paribus, because those people that are admitted or are not discharged are more likely to be sicker and require more intensive care.
Sorry for the duplicate post. The reason I am looking at hospitals and doctors combined is because it has become really hard to separate the two, as more and more doctors are employed directly by hospitals.