
In my prior few posts I made a strong case that the United States’ exceptionally high health care expenditures are well explained by its unusually high material standard of living. In response to this several people I have interacted with have fallen back to the position that something still must obviously be uniquely wrong with the US health care system because US outcomes are significantly below what one might expect given its level of spending:

They believe it cannot be a coincidence that the country that spends so much more than expected (according to naive expectations) also gets worse outcomes than expected and generally gets worse outcomes than the most developed countries of predominantly European and Asian origin.
In this blog post I will address the so-called “outcomes” dimension and explain why these apparently sub-par outcomes are not only not otherwise inexplicable, but can actually be explained in a fairly straight forward and parsimonious fashion For the moment, I will narrow my focus on the subset of factors that drive US health outcomes significantly below naive expectations (not necessarily the full residual) and that I have good reason to suspect are significantly causally related to the expenditures issue. Later, perhaps in another lengthy blog post, I will address other factors that are mostly orthogonal to expenditures and that further affect US health outcomes.
Little of the bivariate relationship between expenditures and life expectancy is actually caused by it
Health Care Expenditures (“HCE”) are strongly correlated with national wealth (GDP, AIC, GNI, etc), intelligence/achievement test scores, social capital, trust, etc. These are also are independently associated with health outcomes and are robust to the inclusion of multiple controls. In short, health care expenditures are a strong proxy for economic, cognitive, and social development indicators.
Actual Individual Consumption (“AIC”) alone is a stronger predictor of overall health outcomes than HCE.
This is true on the expanded WHO/WorldBank international data set (which includes much less developed countries)

And, if you have a problem with less developed countries / potential data quality issues, there’s always OECD. Restricting OECD data to exclude lesser developed countries like Mexico, Korea, etc, in addition to USA (because “outlier”), and using time series data:
[more on this topic later]
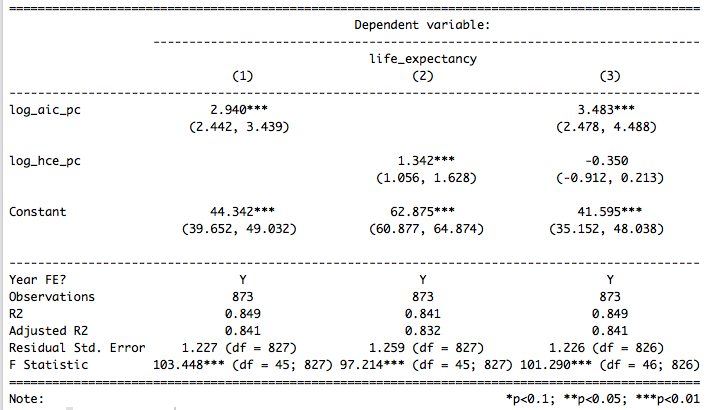
I find that AIC alone mediates the relationship between HCE and outcomes in several multiple regression specifications. Including further controls (e.g., health status, continent/region, etc), restricting the analysis to mostly rich countries, and more does little to change this conclusion. In short, while I would not dispute that the provision of health care saves lives or argue that it explains none of the variance between any countries today in any dimension (certainly some are better than others in narrow areas), the actual causal contribution is surely much smaller than the implied association in bivariate analysis. Determining the unique contribution of health expenditures between countries requires much more careful and sophisticated analysis than critics let on.
A large fraction of the apparent income effect is not causal either
Although economic development surely improves health outcomes through channels besides actual medical intervention (see: public sanitation, clean drinking water, safer roads, access to education, etc), wealth is also associated with many things that are independently associated with life expectancy too (many of them significantly endogenous). IQ predicts national wealth and it also predicts a large proportion of mortality within countries (even when we control for many covariates). Controlling for national IQ or various international test scores (e.g., PISA, PIAAC, etc) significantly reduces the apparent relationship between HCE + AIC and life expectancy.

source
The US enjoys a much higher material standard of living than many key predictors would suggest
Likely as a result of having significantly lower taxes, a smaller welfare state, freer labor markets, relatively copious risk-capital, etc, the United States is able to generate much higher material living conditions than what measures of intelligence and other indicators of human capital would suggest. The precise cause(s) of US advantage here are somewhat beyond the scope of the argument, but what matters is that it does outperform expectations by a large margin.
For instance, amongst the mostly developed countries with whom the US is often compared…..
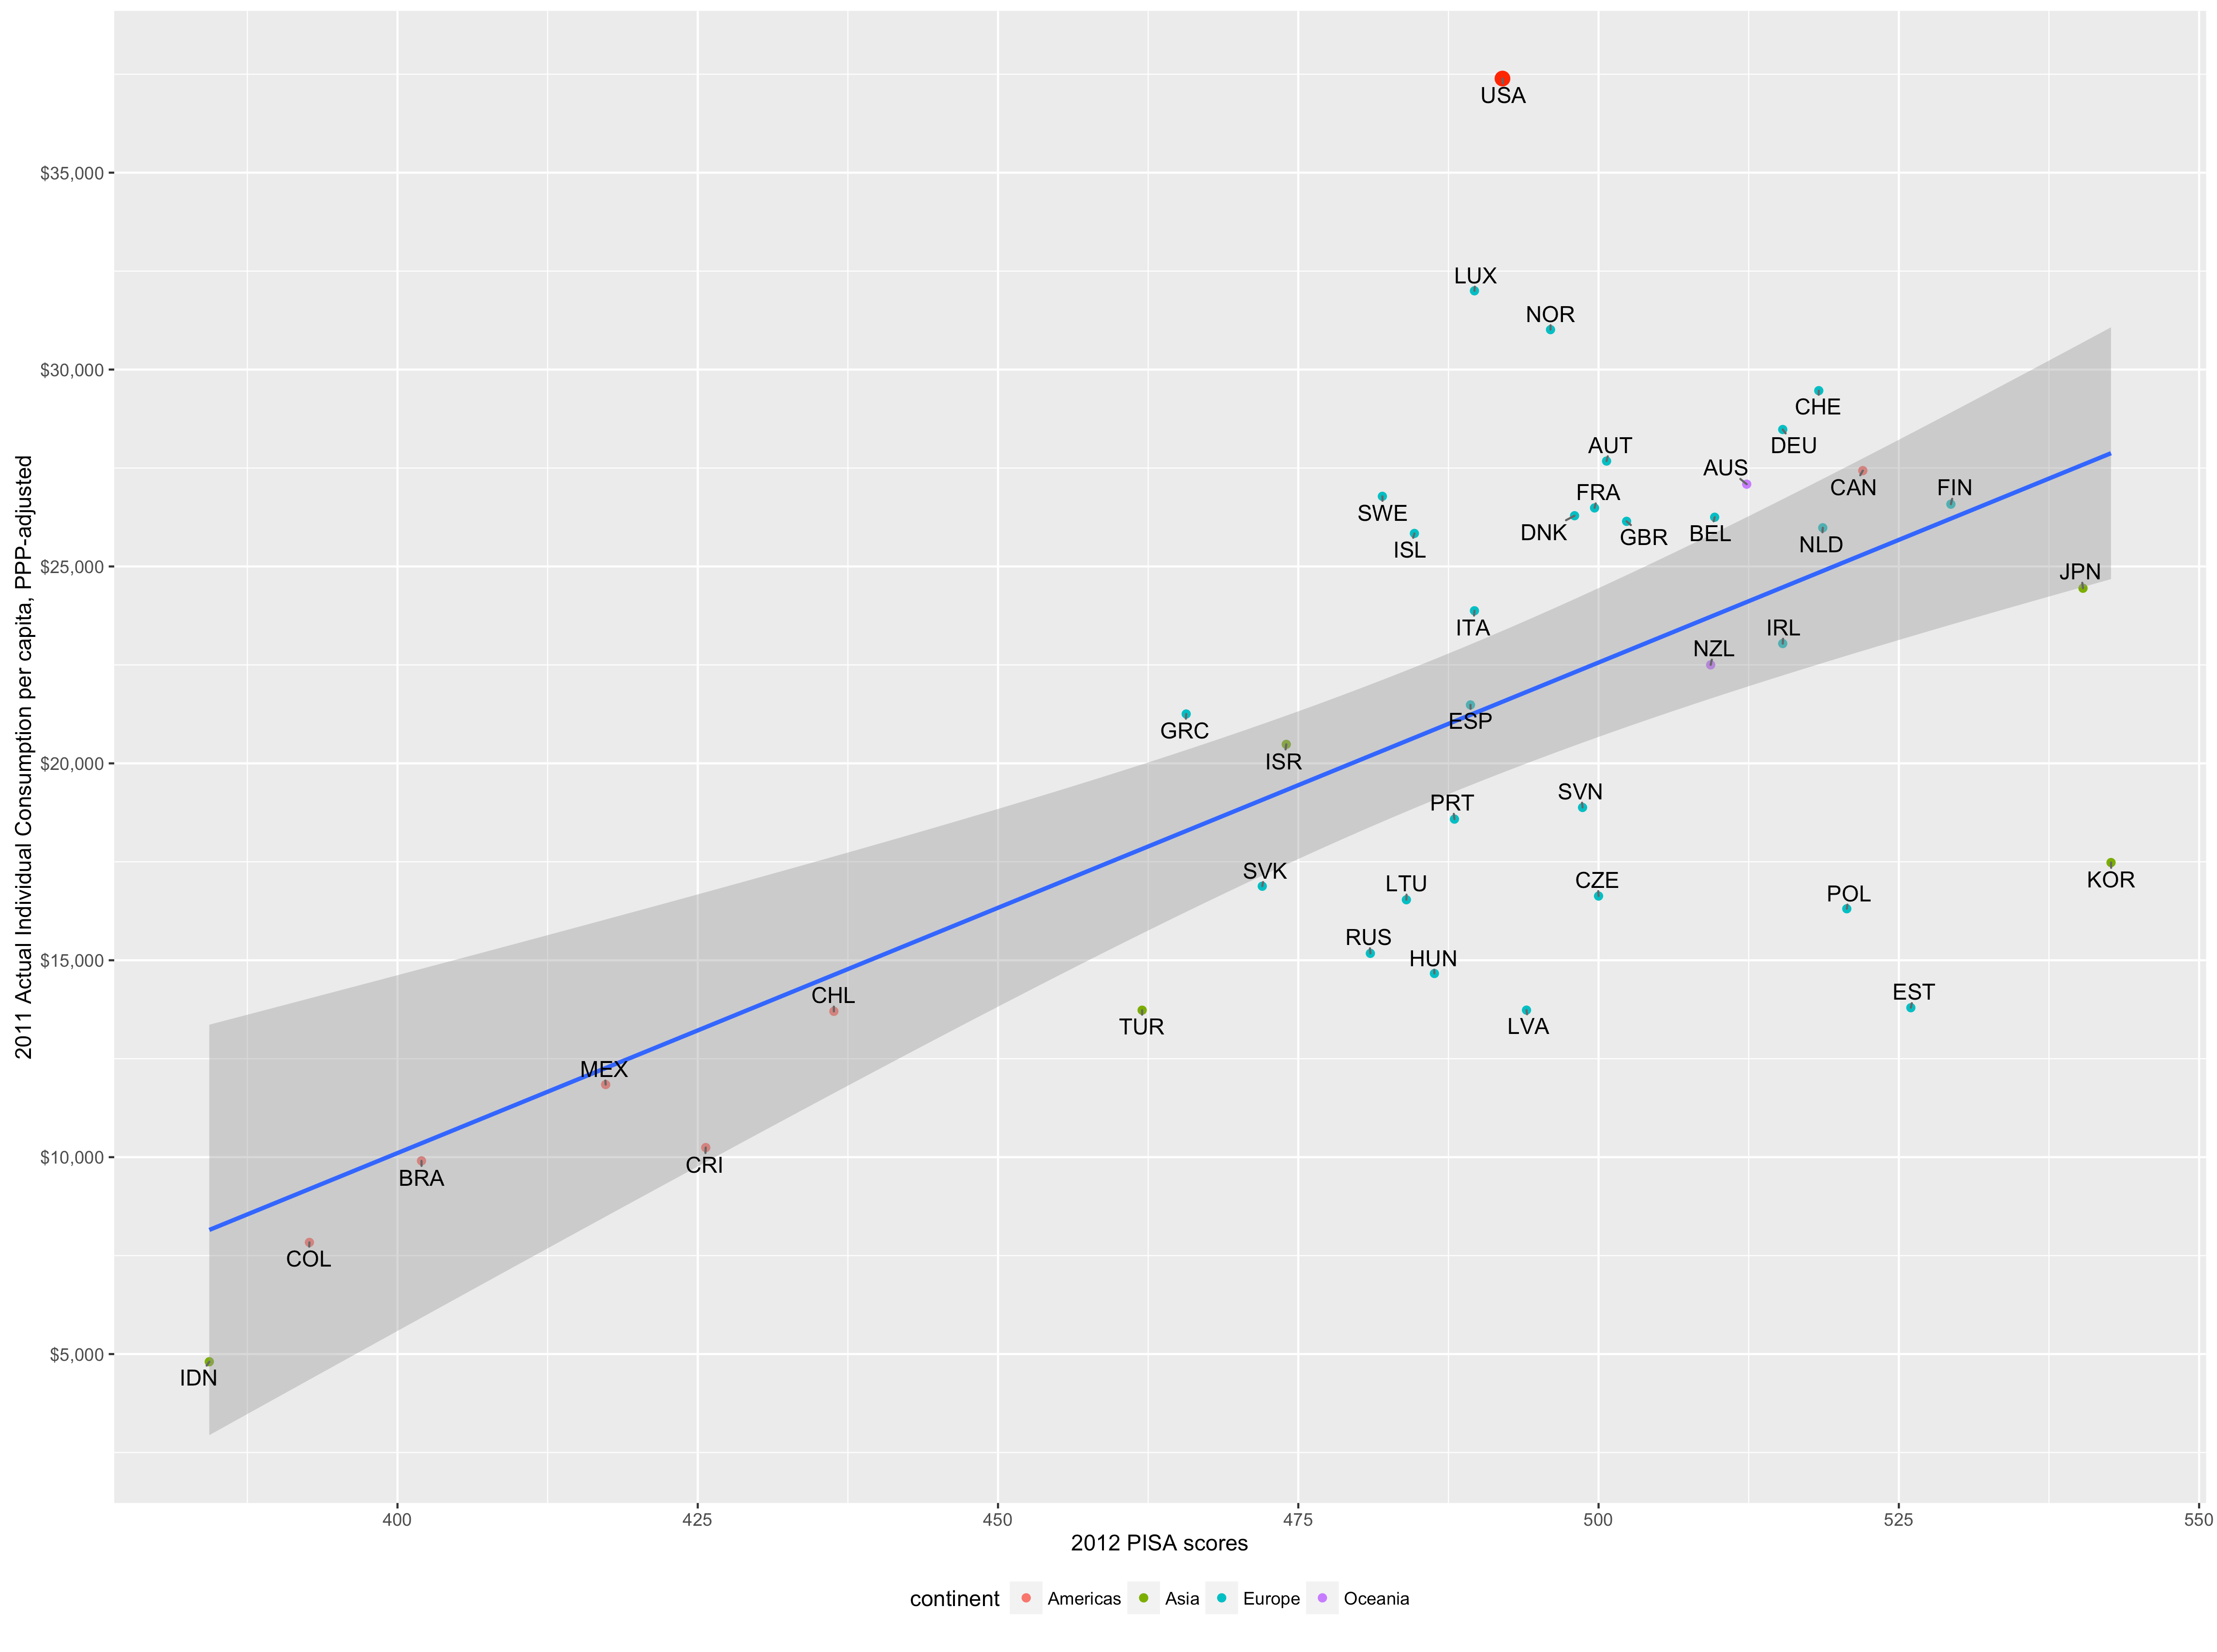


Although the US is far from being a miserable place to live, it does not on average look, act, or behave like the most developed countries of Europe and Asia. Yet, despite all this, it has an exceptionally high material standard of living. The ordinal relationships here are substantially endogenous, i.e., they reflect characteristics like general cognitive ability, conscientiousness, time preference, social capital, trust, etc. They are significantly related to genetics and, yes, probably to some degree cultural norms, values, and expectations, much of which can be traced back hundreds or thousands of years (not necessarily the product of current policy, environmental conditions, etc).
A general factor of social development?
It is possible to devise a general factor of social development with factor analysis to summarize many different dimensions from life expectancy, to family formation, to homicide rates, to income, and more with a single scalar value. Invariably within and between populations there is a high degree of correlation between the individual measures and the S factor and the S factor and cognitive ability. These are typically highly correlated with measures like HDI (albeit without arbitrary weighting, scaling, inclusion/exclusion, etc used by HDI and similar indices).
Although the S factor here is loaded with GDP per capita (which inflates the US relative to other indicators), life expectancy, and many other variables, you can see that this S factor is pretty well correlated with life expectancy even amongst the relatively range restricted OECD subset.

Likewise, though it was never included in the analysis, S is also pretty well correlated with AIC.

The US stands out here too.
If I had more time, I’d derive this myself without including the economic aggregates or life expectancy (or close proxies for them), but, given the loadings and such, you can be pretty sure the US would move down in this modified form of S.
Crude modeling exercises
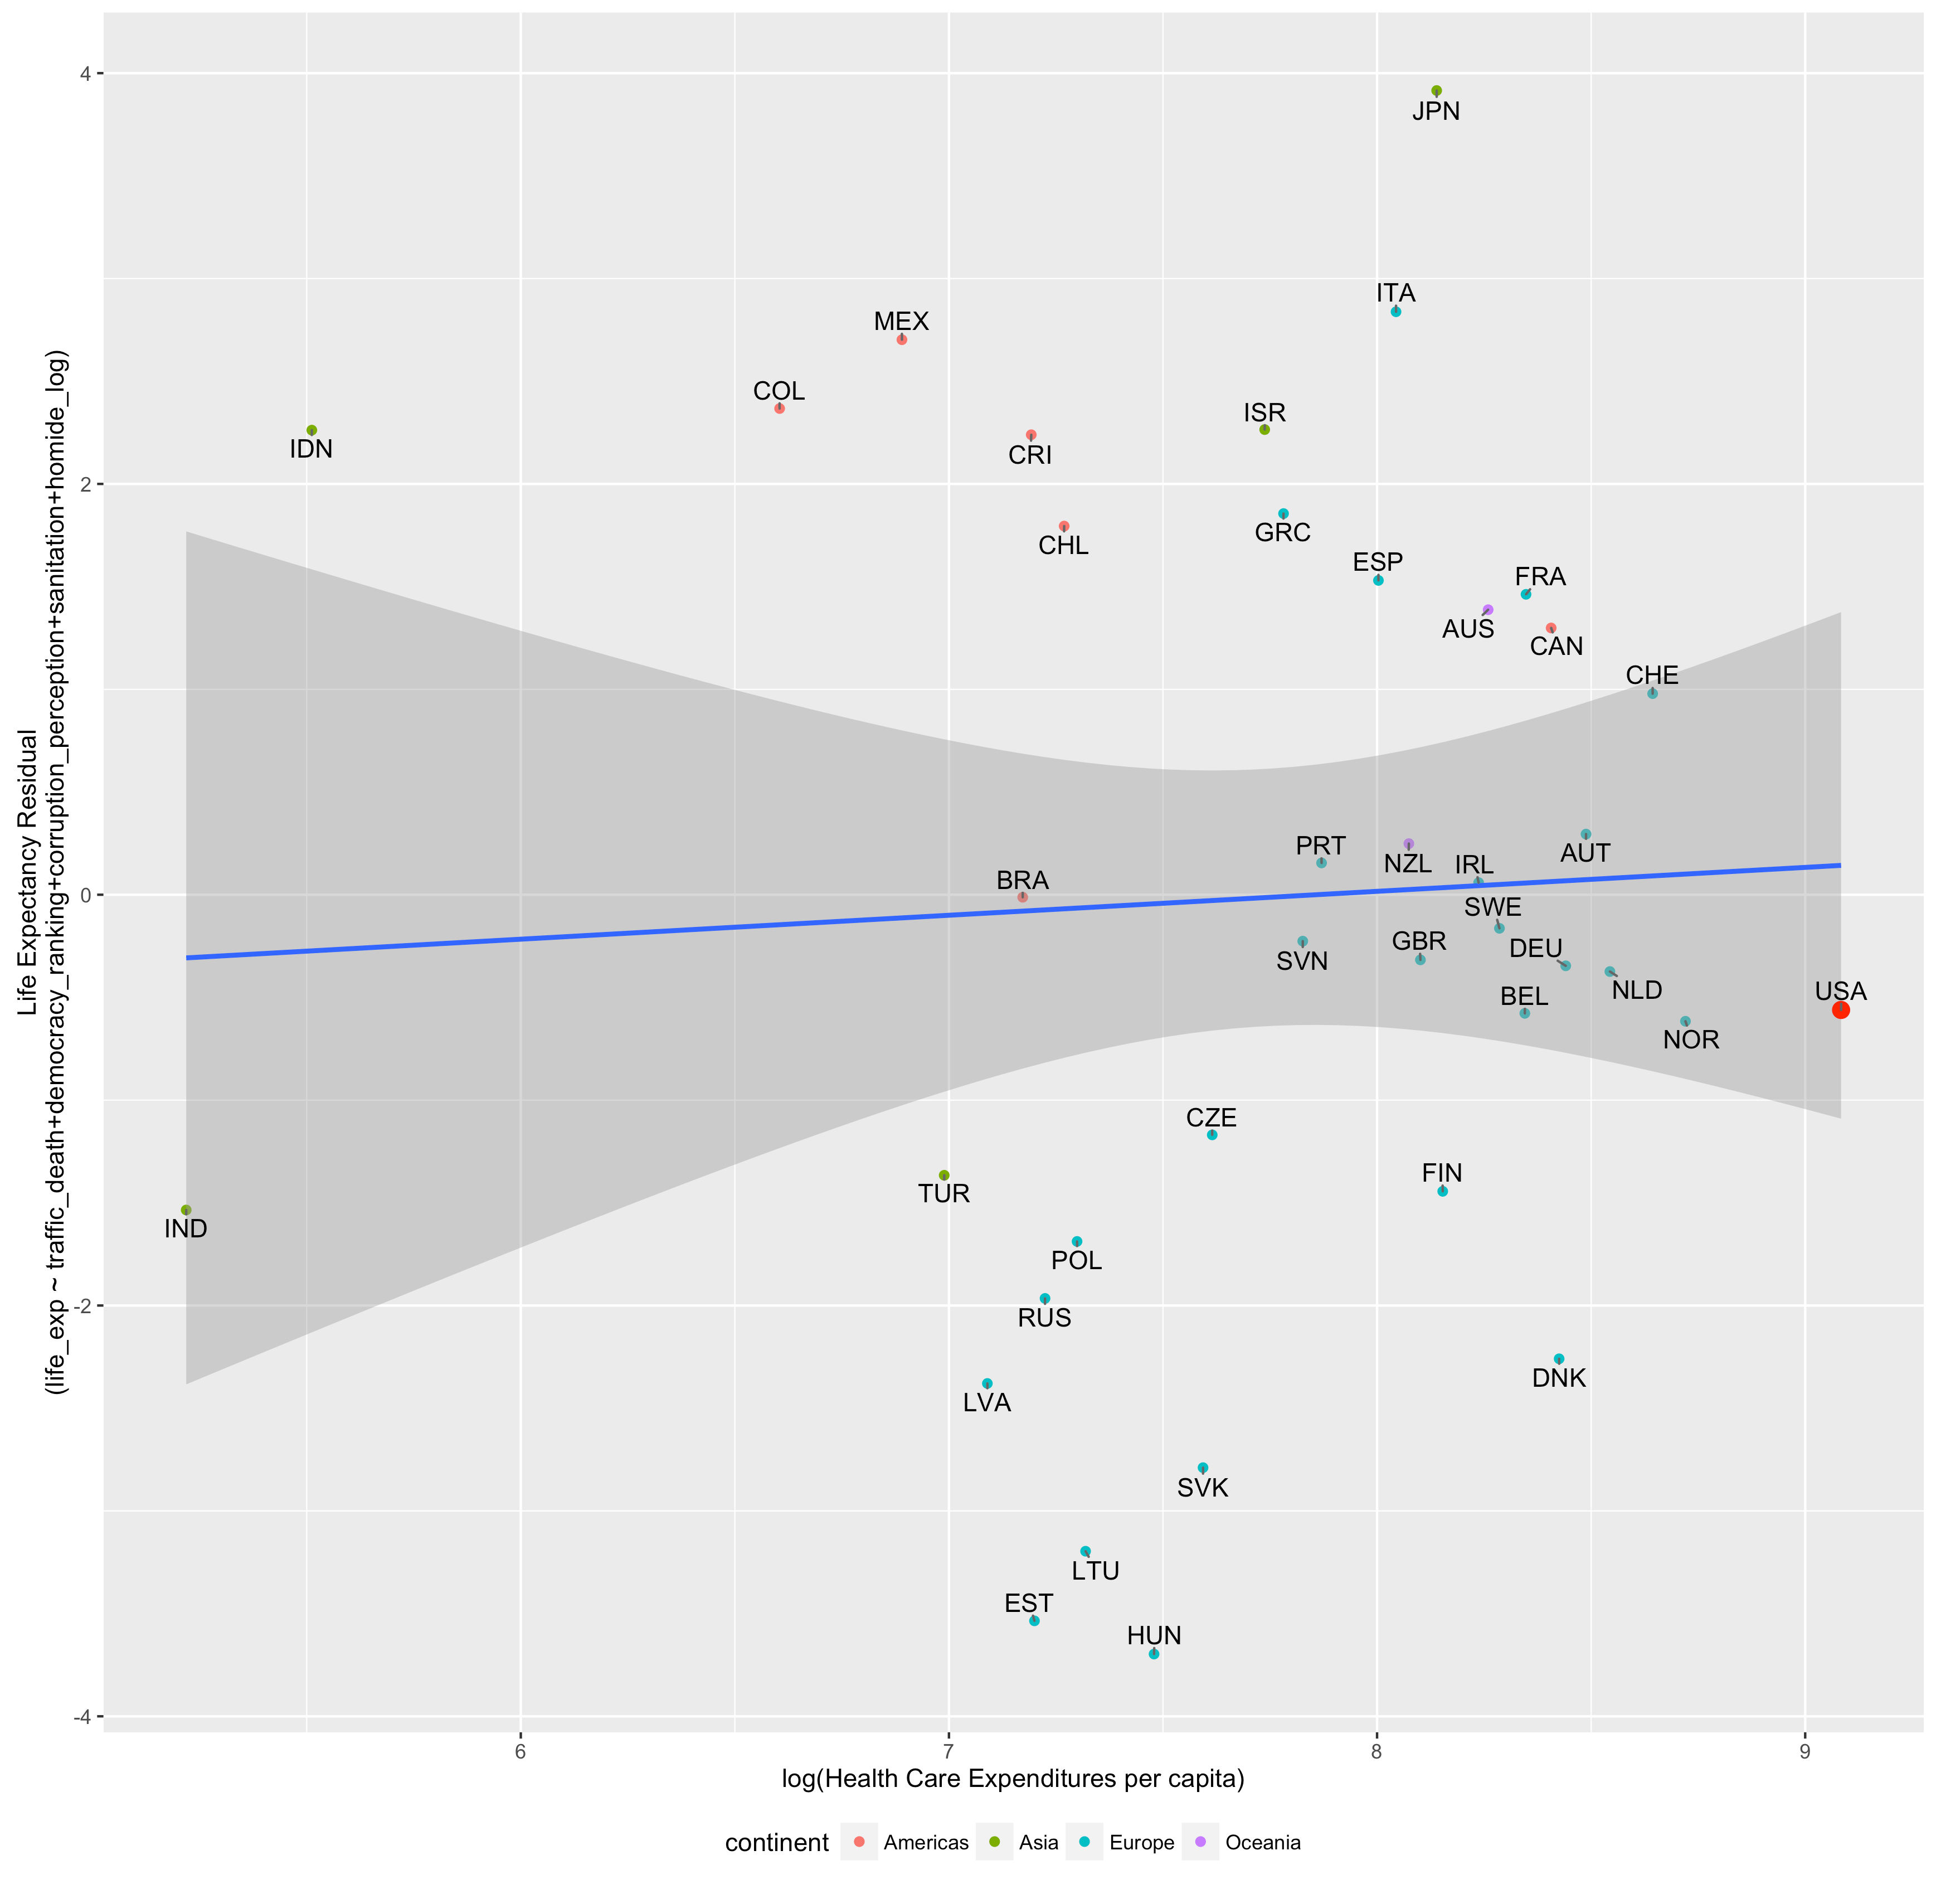
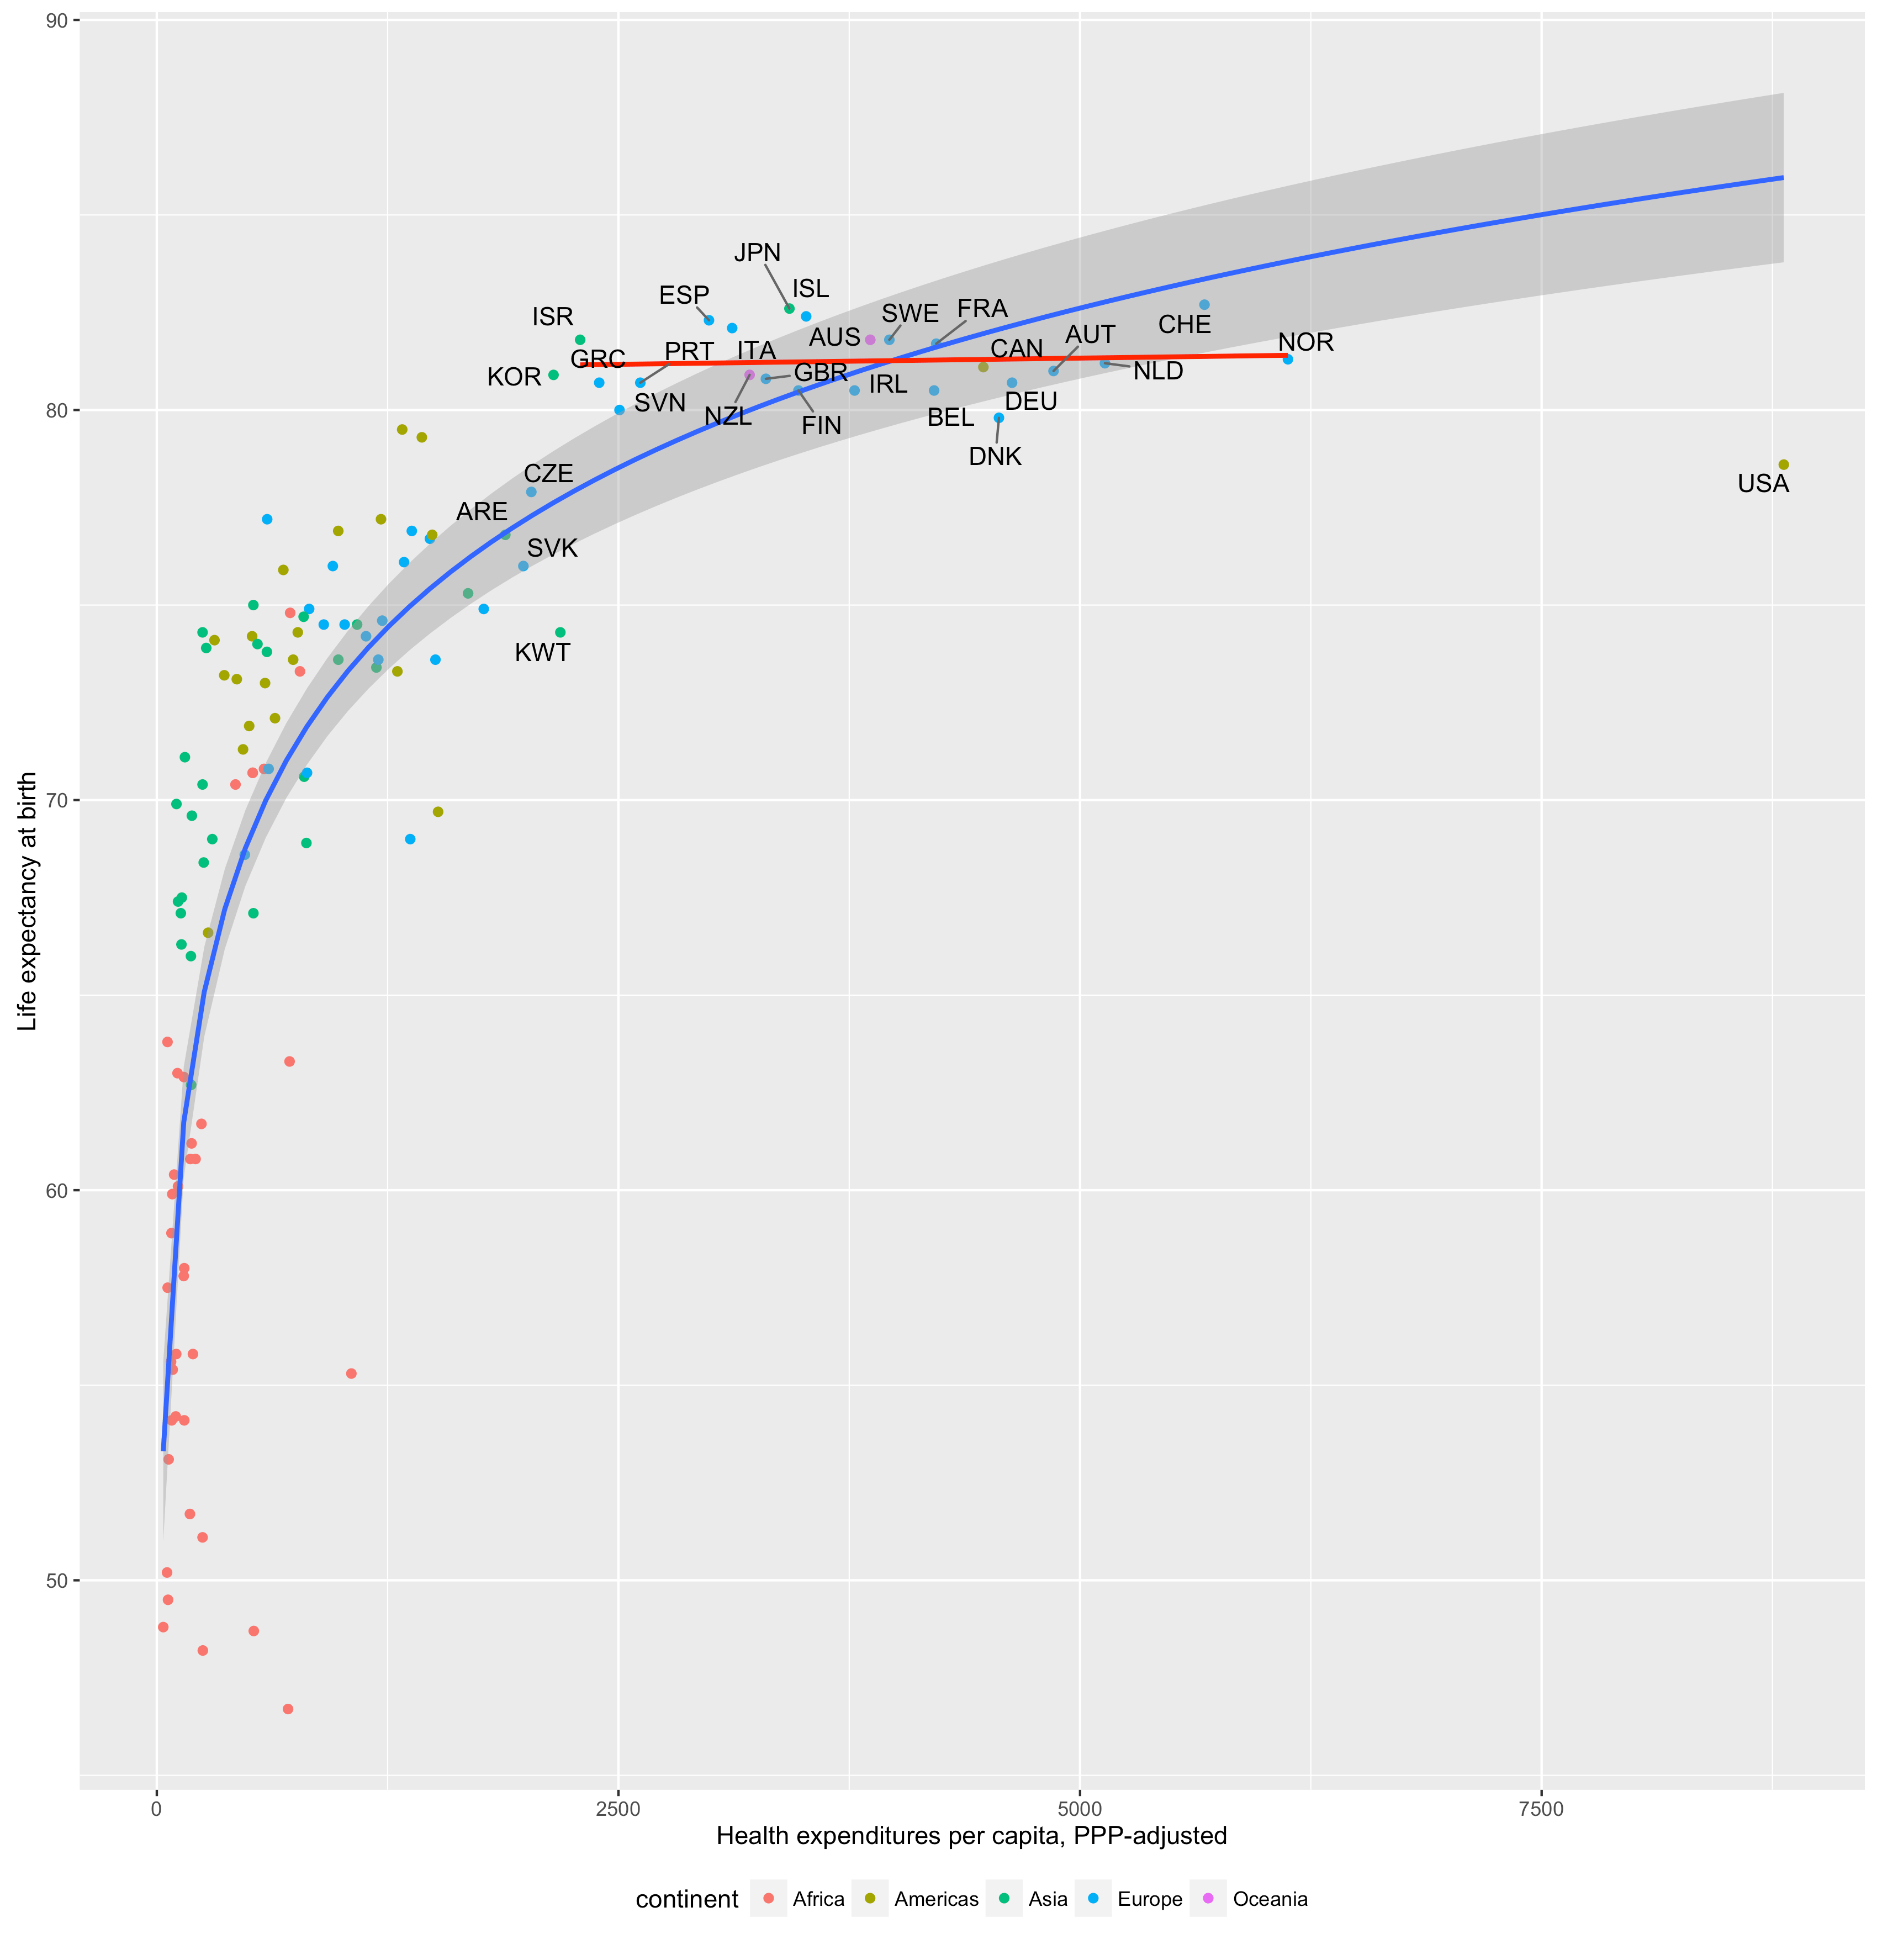
In lieu of a more sophisticated measures for these purposes, we can quick-and-dirty model life expectancy amongst the OECD countries using crude thresholds for economic development (e.g., sanitation and water supply) and social development. Excluding US from the training data we can explain most of the variance with a handful of indicators:

Despite the fact that the US was not included in the training data, it actually fits quite well on the trend line.

Note how in this model the US is predicted to resemble significantly less rich countries like the Greece. And again, relative to the the life expectancy prediction, the US really stands out vis-a-vis AIC.

Plotting the residuals by HCE:
Even with this crude model, there is no clear indication that health expenditures tell us anything that we couldn’t have predicted otherwise with these indicators.
These issues are related
Even amongst reasonably well-developed countries life expectancy is determined significantly by factors beyond economic development and, especially, health care provision. There is only so much the health system knows how to do. If the population makes poor choices (see: excess calories, limited exercise, smoking, drugs, reckless driving, etc) the best, most cutting edge, medicine can only do so much to counter-act them. Much of the high efficacy technology, know-how, etc is highly diffuse, broadly similar amongst even reasonably developed countries, and the returns to additional expenditures are rapidly diminishing everywhere, ergo we see little evidence that health care expenditures independently explains much of the overall variance in better specified models. Health expenditures, meanwhile, are strongly predicted by economic development, especially as measured by AIC (largely without hyper-rational cost-v-benefit calculation), which, in turn, is substantially determined by cognitive and social development, which predict risky behaviors that affect life expectancy.
Therefore, if you have a country that outperforms its average level of cognitive and social development with respect to AIC, you should expect it, ceteris paribus, to spend substantially more than equivalently developed countries (especially due to the non-linear rate of increase) while achieving substantially worse outcomes than its level of health expenditures or its level of economic development would naively predict. The apparent disconnect between health-spending-and-wealth and health-outcomes-and-spending are substantially connected; they are not entirely idiosyncratic differences that are orthogonal to expenditures or economic development.
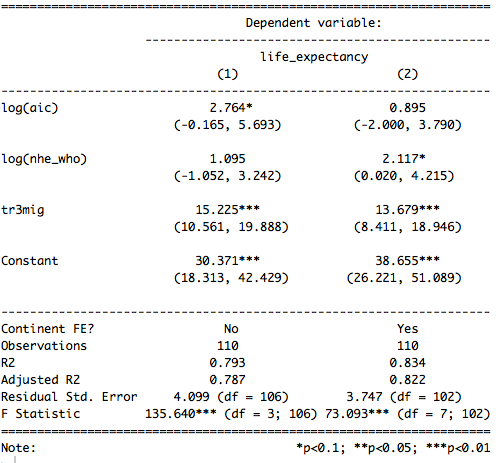
I will briefly demonstrate what I mean by constructing several crude models to predict AIC, NHE, and life expectancy and then showing that these residuals are correlated.

In model 1 we predict AIC with IQ, teen birth rate, and water/sanitation index, model 2 is same as model 1 but for NHE instead, and with model 3 we predict life expectancy with the log of NHE.
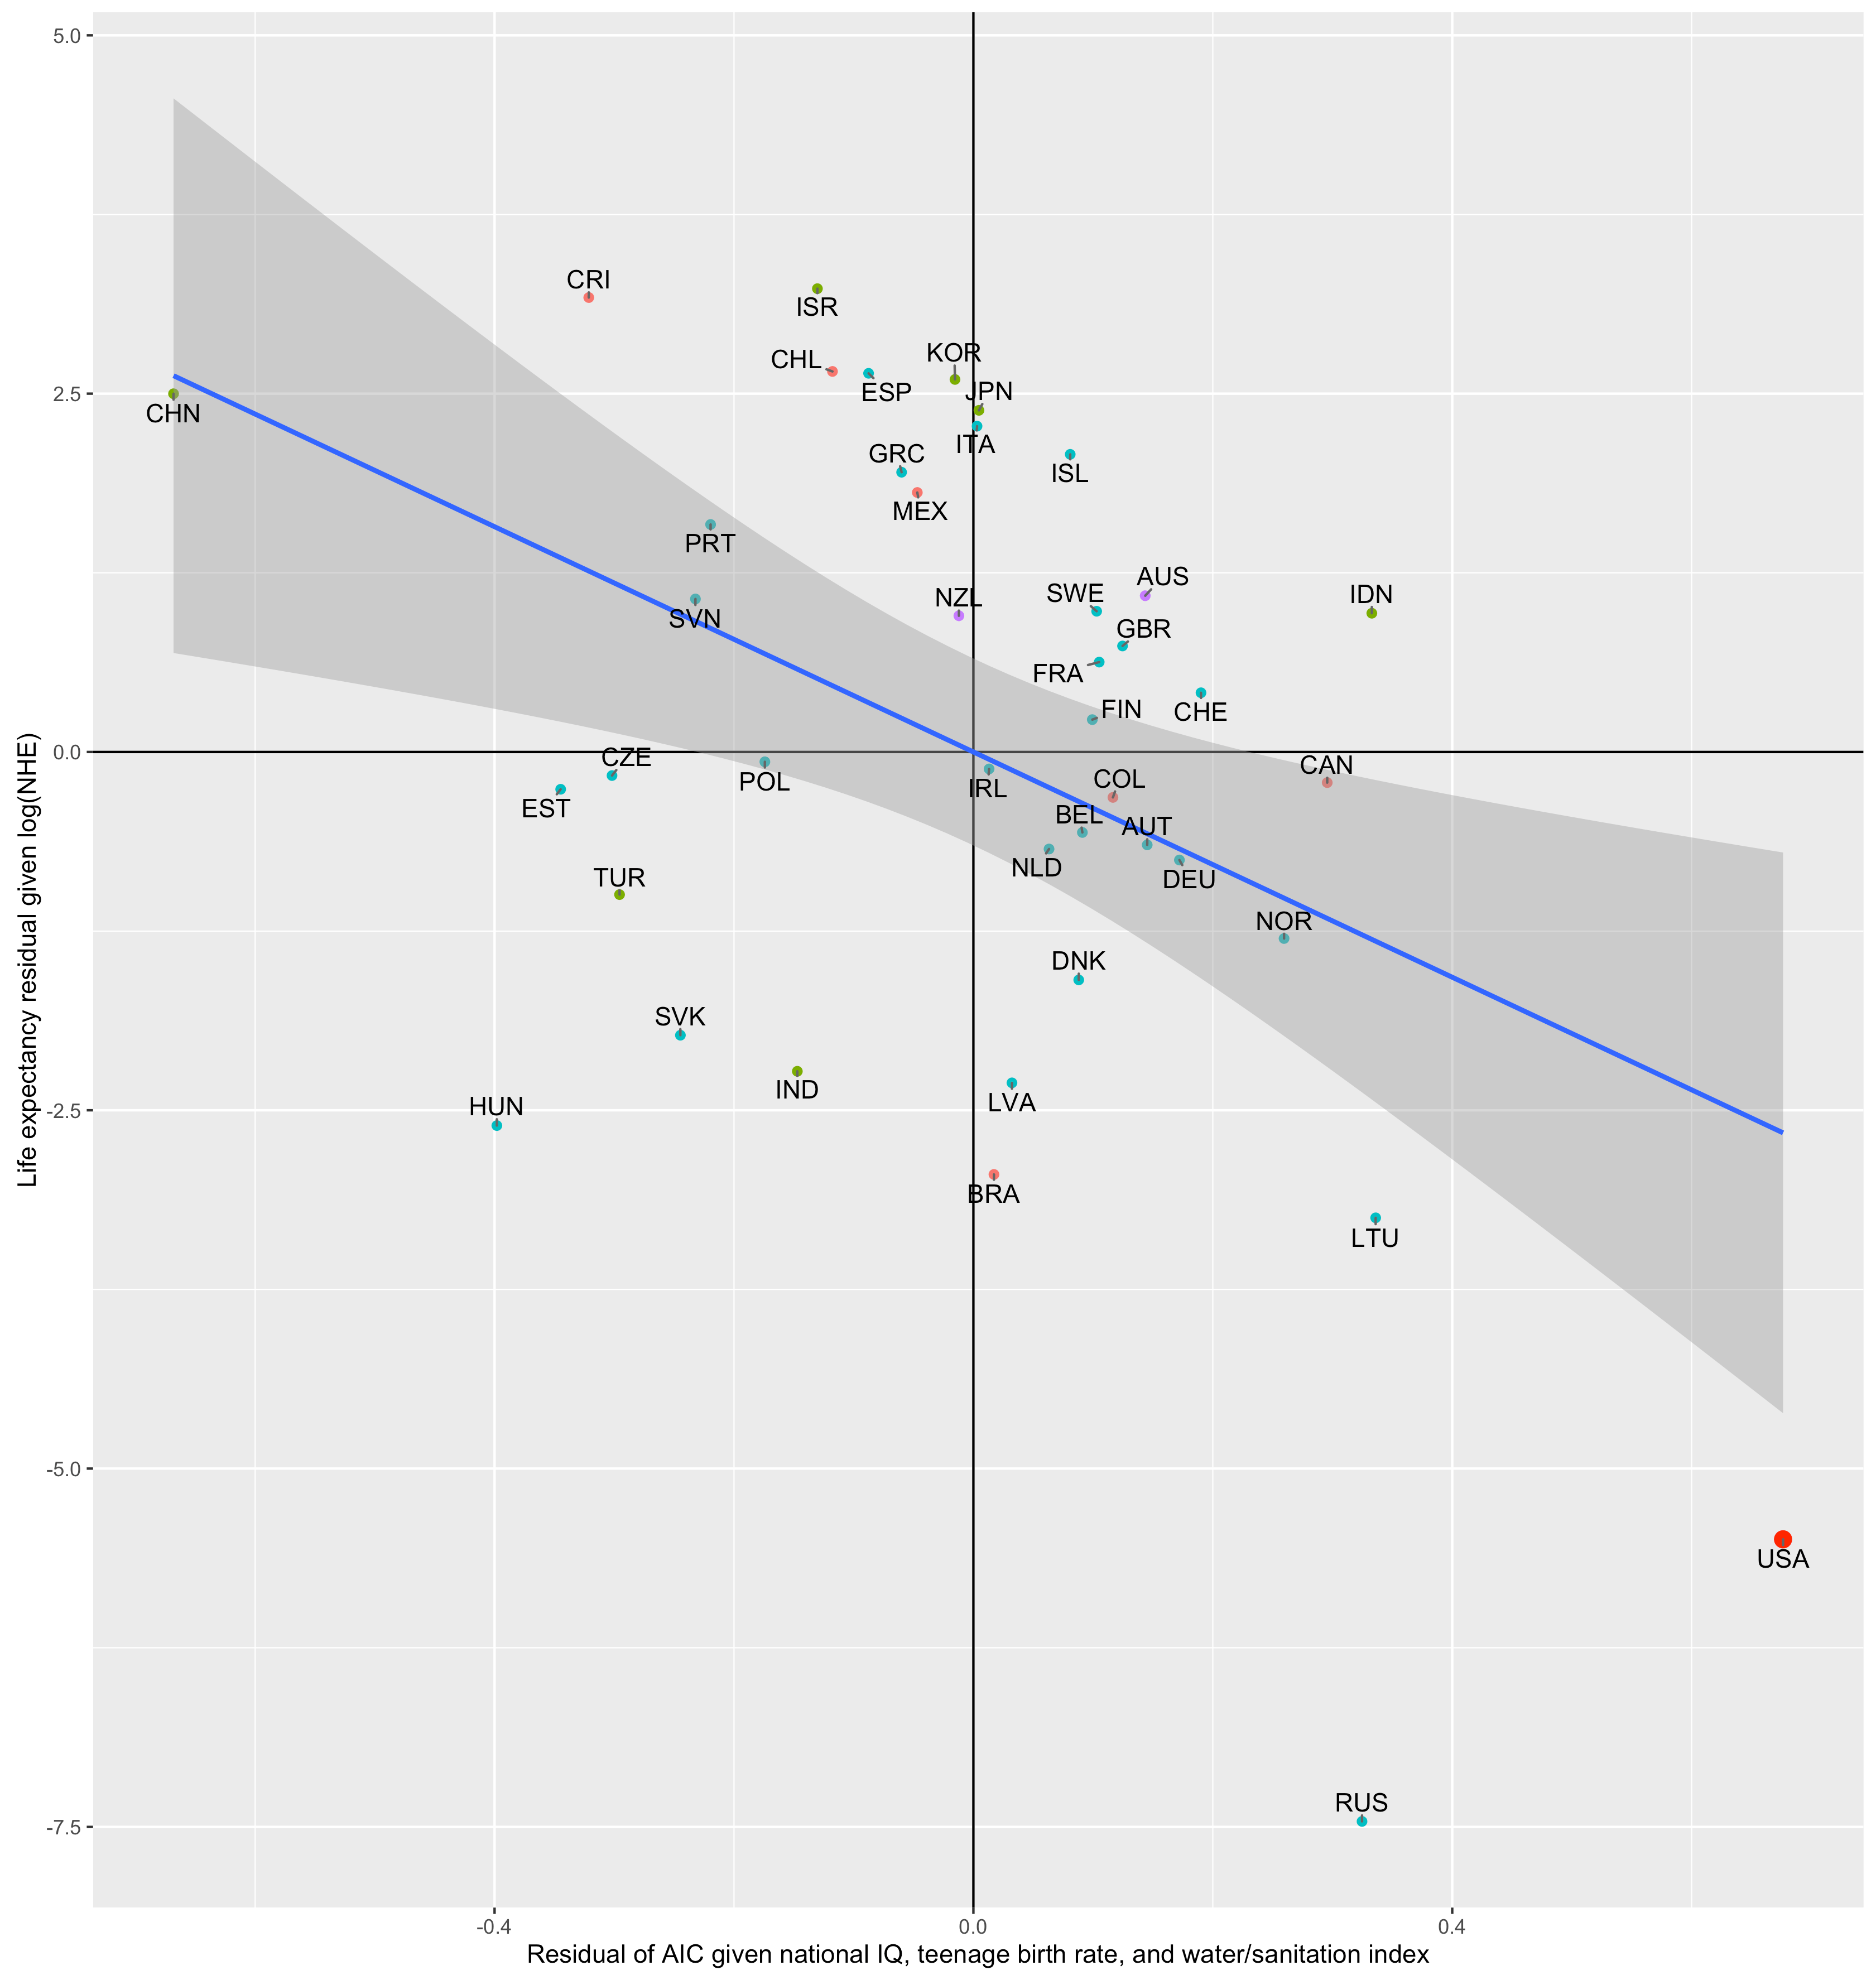
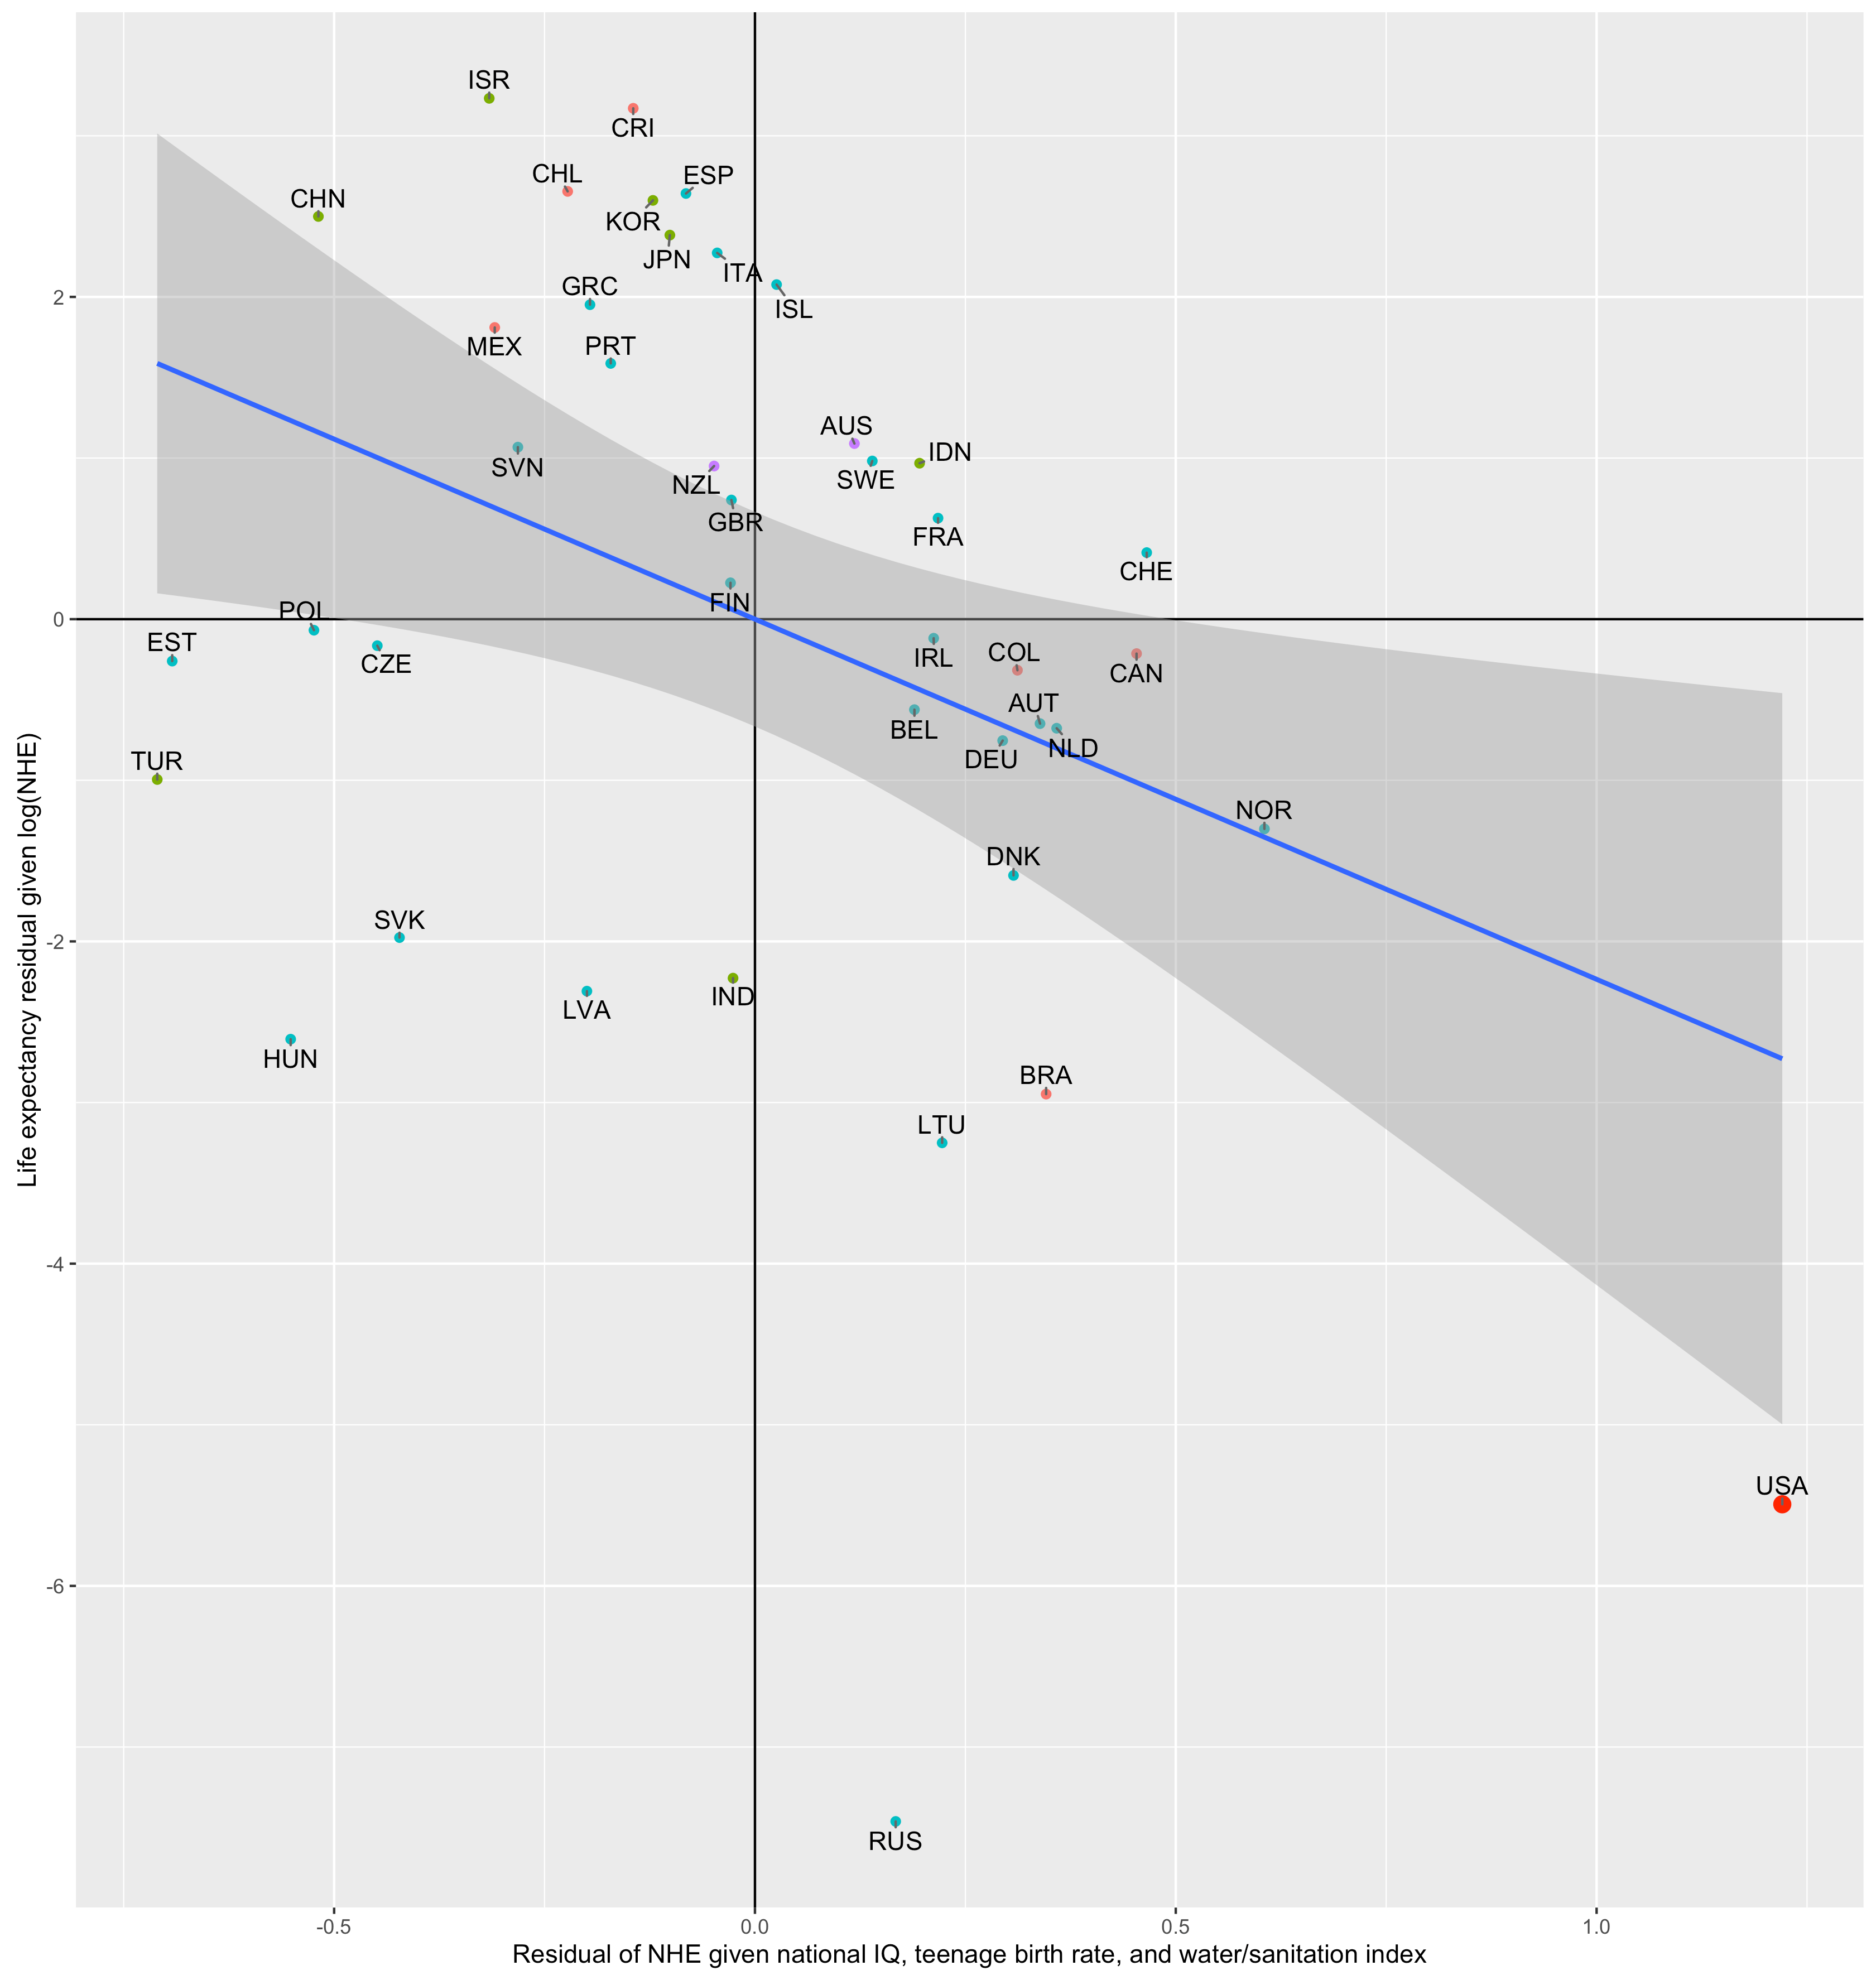
Countries with higher AIC or NHE than expected also tend to see less life expectancy than expected under the bivariate model using log(NHE). This shouldn’t be surprising since we find these same predictors with these same countries partially mediate this same relationship in OLS and these predictors are also correlated with AIC in similar directions and magnitudes.

Virtually no apparent relationship between HCE and outcomes amongst the most developed countries
Although we can approximate the broader bivariate relationship between expenditures and life expectancy as logarithmic, the observed relationship amongst the more developed countries, those with whom the US is typically compared, looks non-existent or, at least, is not consistent with a strong trend. For instance, if we plot a regression line for all countries spending more than 2200 PPP-adjusted USD per capita (chosen to include our usual comps) and exclude the US the slope is dead flat.
Countries like Norway and Luxembourg spend more than twice as much Israel and Malta and see significantly shorter life expectancies (and yet somehow we hear very little about that!)

Speaking of which, I reminded this well-circulated plot that invites a very different impression:
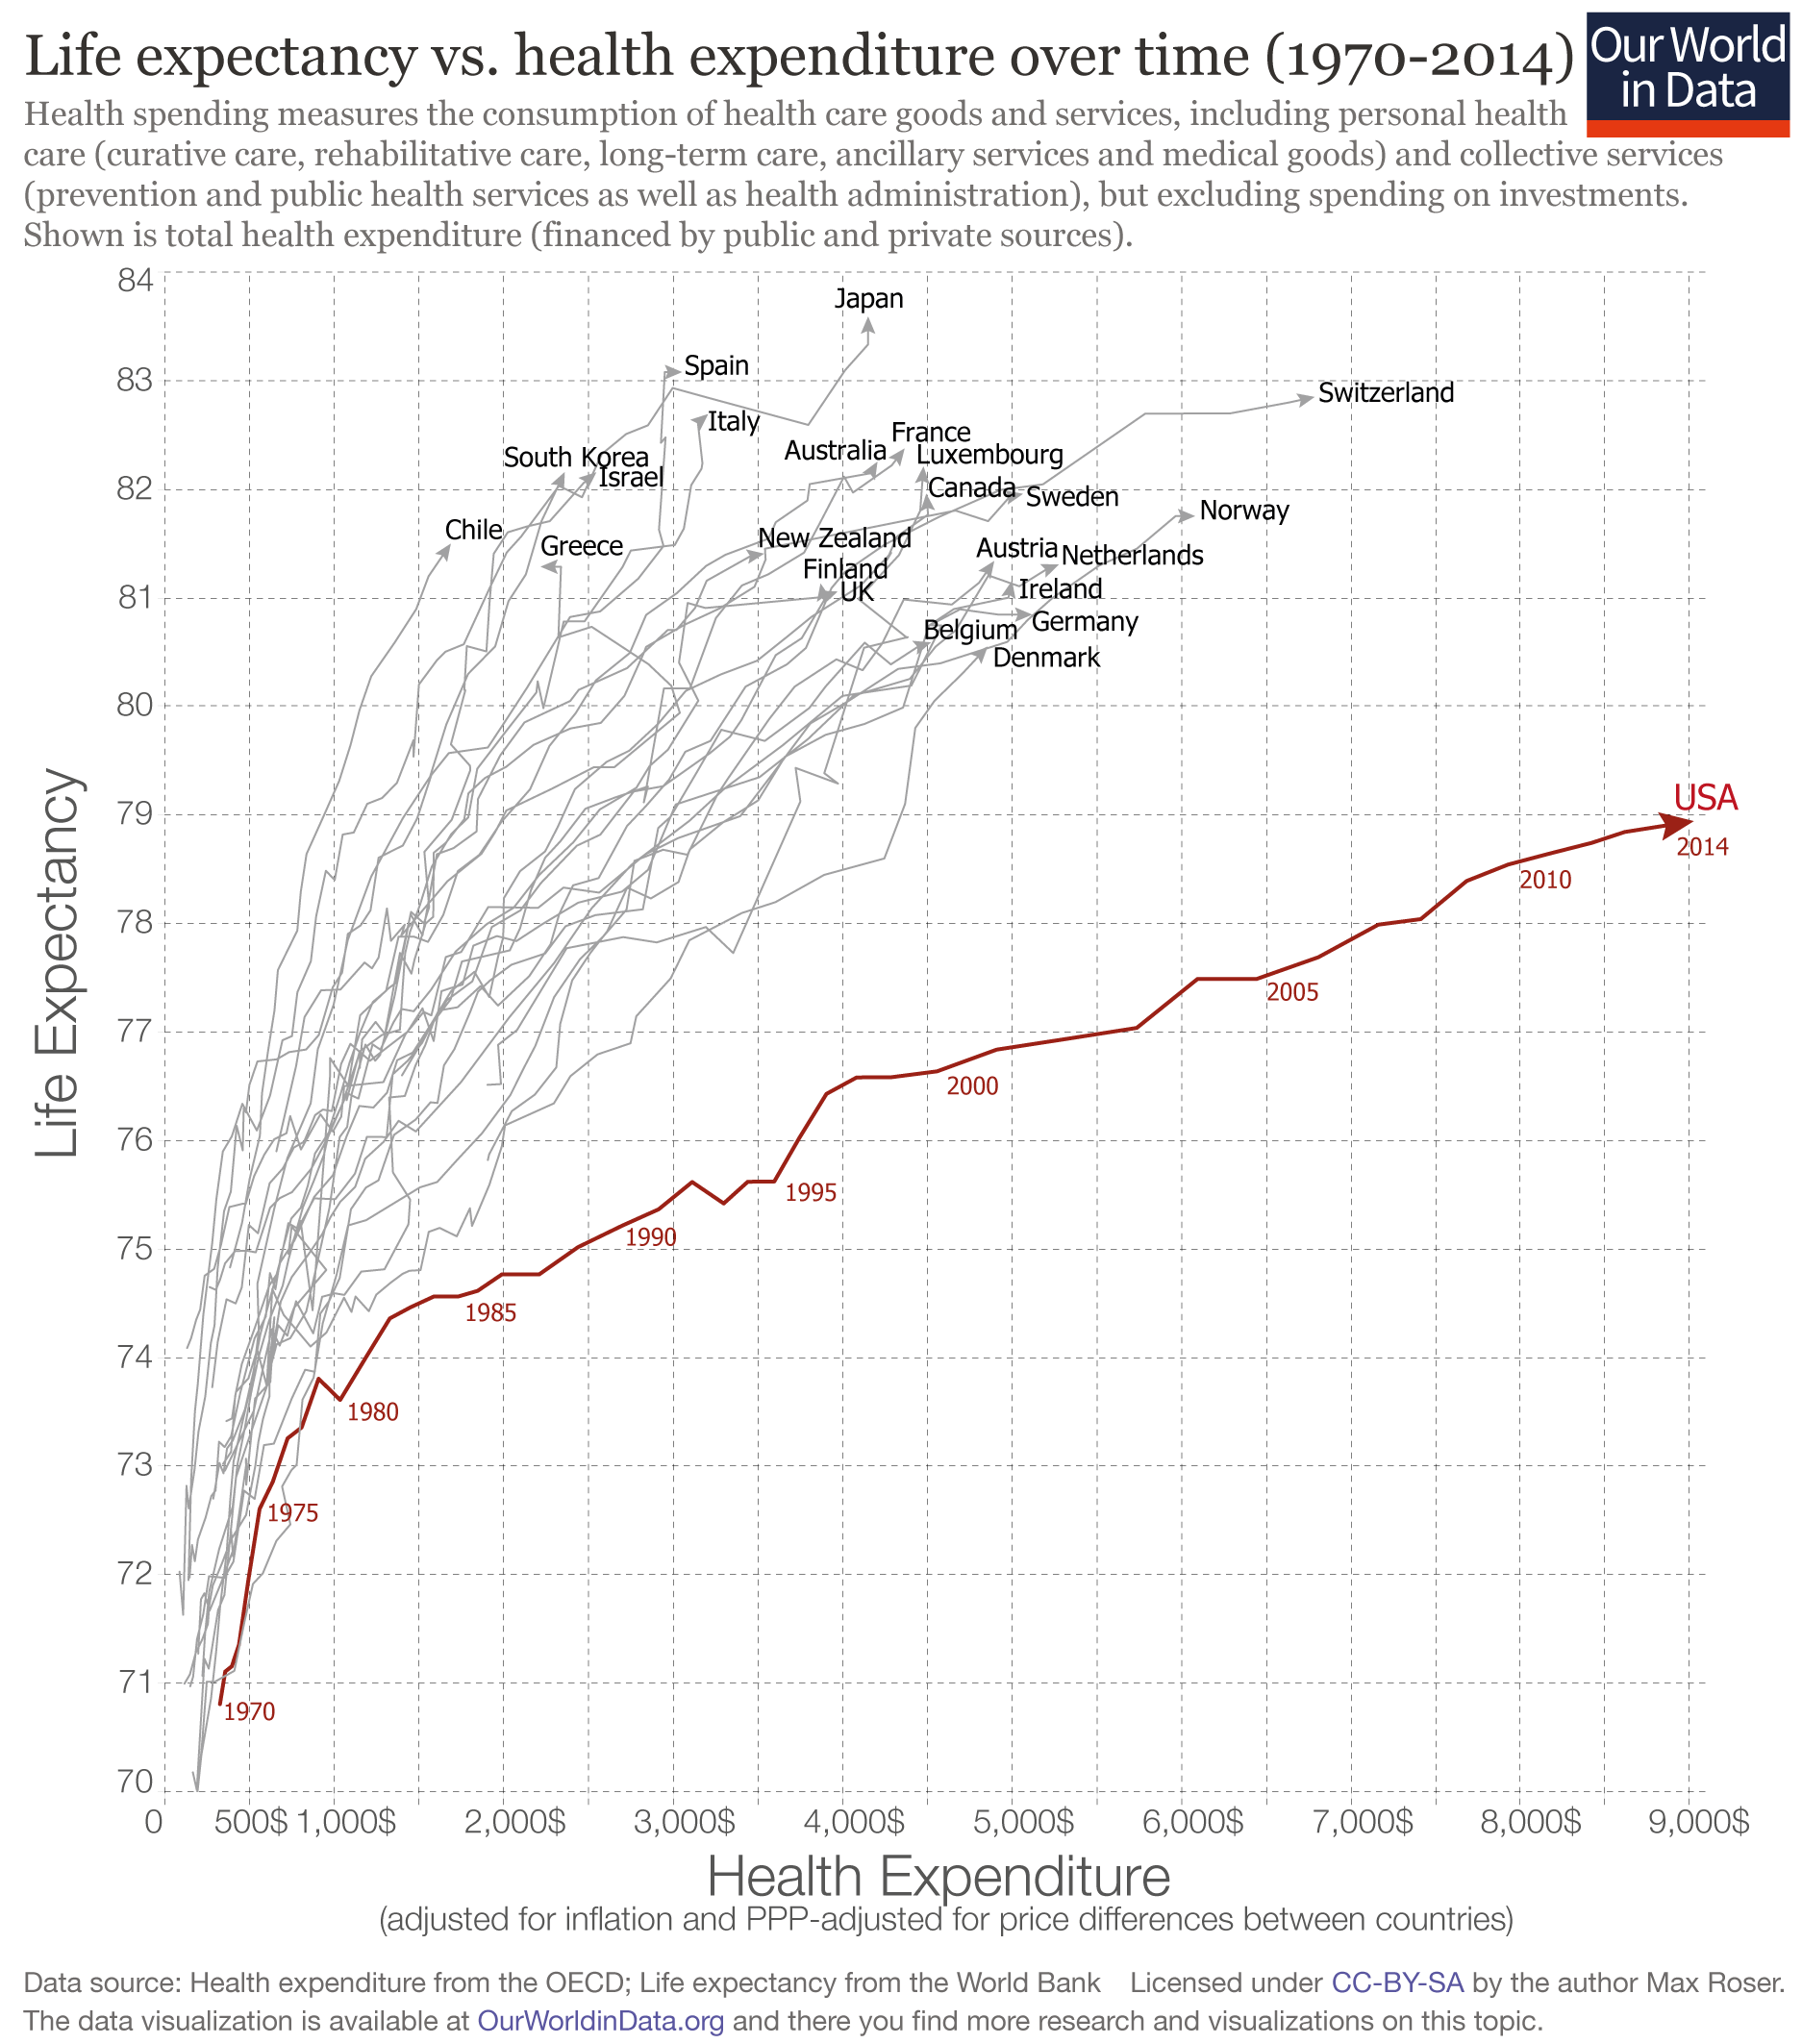
It misleads more than it enlightens because (1) you cannot see the actual temporal trends (2) virtually all evidence suggests the actual relationship is much closer to logarithmic than linear [x-axis should be scaled accordingly] (3) it makes it difficult to infer the actual moment-in-time slope.
Compare with an animated version:

Note: The blue line is a regression line excluding USA (red includes USA)
Any reasonably careful analysis of this same data would have made plain the absurdity in their assertion that “the presented visualizations are nevertheless indicative of a clear and strong relationship; the health returns to healthcare investment suggested by the figures above are substantial“.
Moreover, we find AIC mediates HCE amongst these relatively highly developed countries (these aren’t just “unobservables”).
If we take time series data directly from OECD for a similar set of developed countries (notably excluding USA):
![]()
and use mixed model wherein the slopes for AIC and HCE are allowed to vary each year to predict life expectancy we can get a better handle on what is going on here.
Comparing models with AIC and HCE alone:

The model with AIC is significantly better fitting than HCE alone.

Adding HCE does not significantly improve the model fit and the parameter estimate for HCE (the green line) is truly negligible across all years. AIC starts out as significantly positively associated (on average) with better health outcomes but shows a strong secular trend of decline (even pointing towards distinctly negative outcomes by around 2010)

Meanwhile, the annual fixed effects estimate (intercept adjustment) shows a strong secular trend of increase.

In my view these estimates are consistent with:
- the notion that differences in health care provision actually causes relatively little of the observed bivariate relationship or, alternatively, HCE is so poorly estimated by WHO, even amongst the most developed countries (!!), as to be practically worthless [which would call into question the main evidence behind the notion the US much more than expected]
- the declining marginal significance of wealth as countries get rich
- the broad diffusion of medical technology, know-how, and public health efforts amongst countries of significantly different economic status (see: time trend/year fixed effects)
- possible negative health consequences resulting from historically high material living conditions are starting to take over (especially amongst richer countries like the United States).
Significant negative income effects are not at all unreasonable
Obesity is increasingly world wide and, contrary to popular impression, obesity is quite strongly correlated with national wealth, as are diabetes, smoking, inactivity, and several other strong predictors of long term mortality rates.

The actual causal effects associated with wealth are probably larger than it might appear because the higher income countries tend to be relatively better adapted culturally and, yes, probably genetically to a world of abundant nutrition, limited manual labor demands, etc, which offsets the bivariate relationships to some degree. (Also, if you’re particularly observant you might notice that different groups see significantly different slopes as a function of AIC than others…. there is likely a rather strong interaction effect here between development indicators and national income measures)

Data for diabetes diagnoses show very similar patterns (unsurprisingly because these are tightly linked at a population level).
As countries get rich food becomes very cheap relative to incomes, so they need to spend less of their income on food.

source
The United States happens to have the highest material standard of living (as measured by AIC and related measures).

Which is why I’m not, amongst other reasons, surprised to find the the US consumes significantly more than most (and probably has had a significant lead over most of Europe for over two hundred years)

In any event, as the positive effects of income start to diminish (sanitation, water, public health, vaccines, etc) the negative effects associated with income (obesity, diabetes, etc) are likely to start dominating mortality trends amongst the relatively more affluent countries (or at least they are likely to if they don’t manage to dramatically change the trajectories vis-a-vis obesity, diabetes, etc). This does not necessarily mean life expectancy will decline, since technological improvements in medicine, public health, etc are apt to offsets these issues to some degree. However, because the technological improvements tend to be diffuse and, in the long run, not particularly proprietary to rich countries or beyond the reach of those with more limited budgets, the average marginal effects between countries are apt to be non-trivially negative amongst those that are already highly developed.
I would envision something of a U-shape curve as a function of log AIC like so:

The US is considerably further along this curve than the modal anglo/european country.
Note: Some people think this cannot be because the rich tend to be skinnier and healthier in developed countries, but this is not uniformly true outside of the developed world and, regardless, it’d be an example of Simpson’s Paradox.
The past predicts current health outcomes
There have been a series of “deep history” economic research papers that have documented strong links between technological, state, agricultural, and other historical markers of development and current economic outcomes.
For instance, Comin, Easterly, and Gong find that the level of technological development in 1500 AD, well before the colonial era, european slave trade, etc explain a large fraction of GDP per capita today adjusting for migration (i.e., how developed were the places migrants came from). The overwhelming conclusion of these studies is that “people” matter much more than “places”. Places that were originally populated by mostly lesser developed groups developed quite rapidly once people from more developed places migrated there and vice versa (similar patterns are also found within countries, i.e., the origins of peoples’ ancestors predicts their ordinal position in the income distribution even several generations later)

At it turns out, several of these economists actually provide the data for the public on their websites (yay!).
These deep history measures actually explain quite a bit of the life expectancy variance between countries even controlling for log(HCE) and log(AIC)!
To ensure I had the correct variables selected and for grins, I plotted AIC and found that it correlates with 1500 AD technology at least as well as it does with GDP (significantly better in r-squared terms).
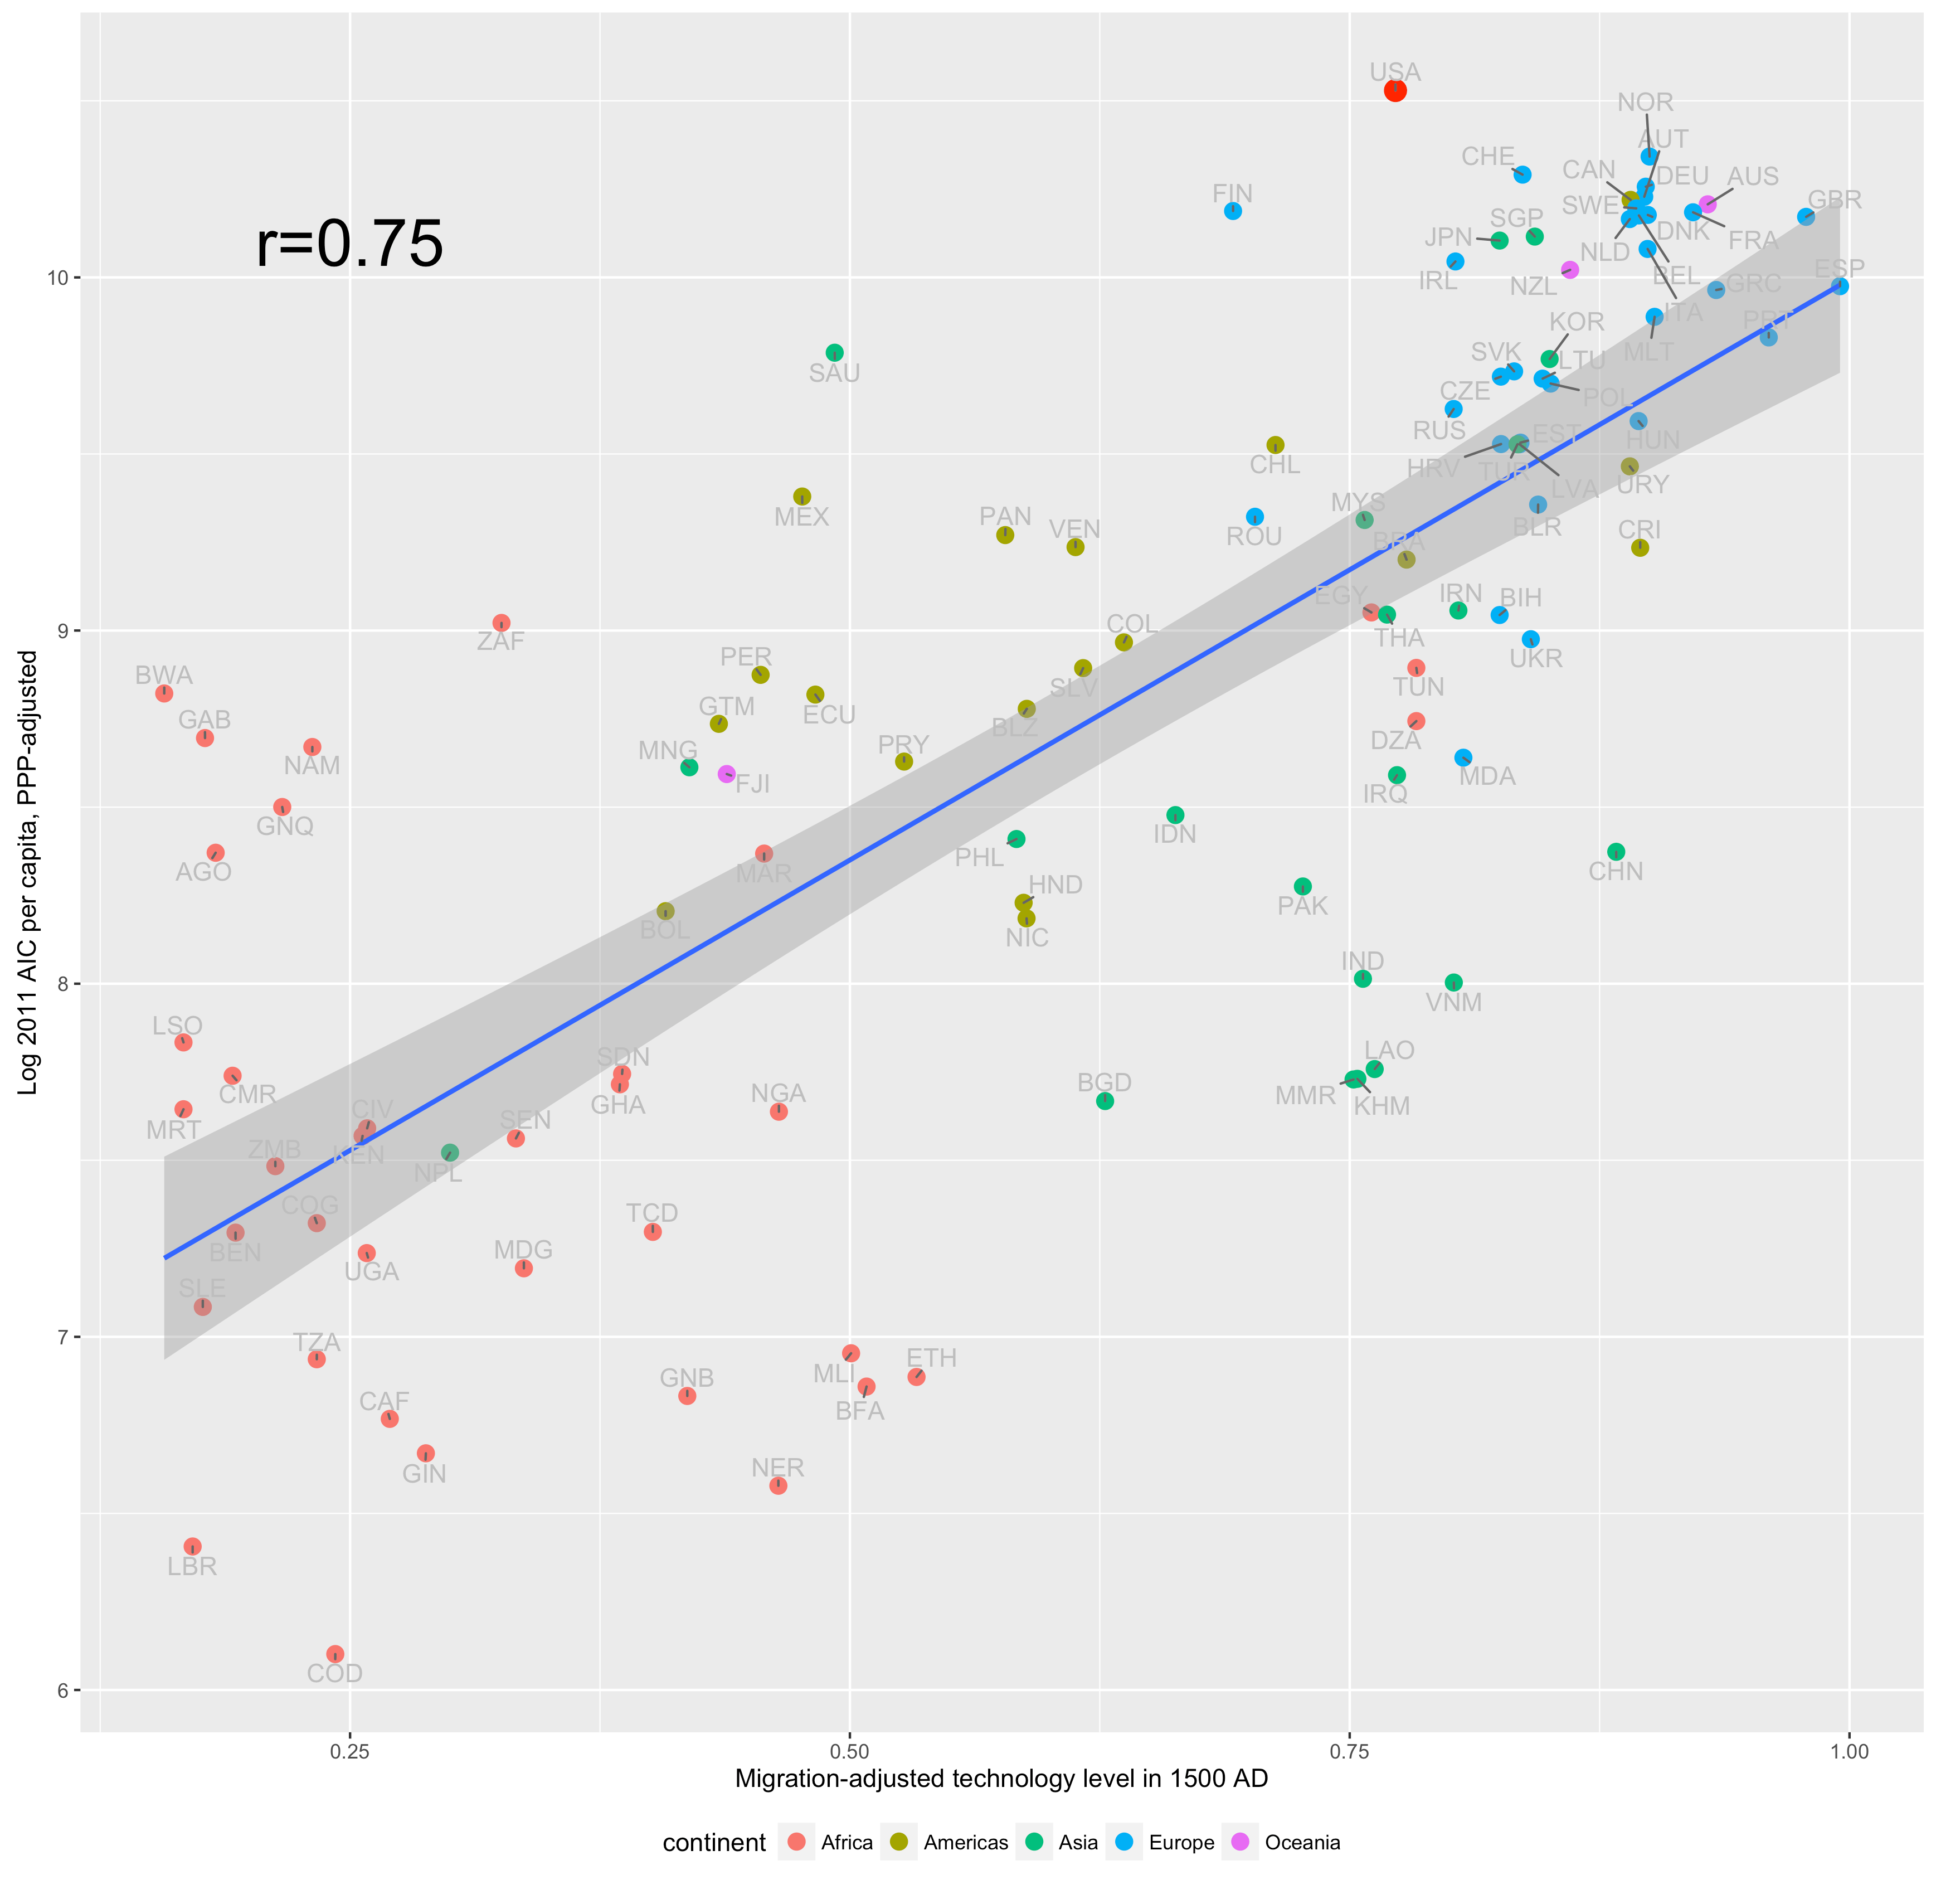

If model 5 below you might note that this measure of technology for 1500 AD (tr3mig) actually substantially mediates much of the apparent explanatory power of AIC.

Also this doesn’t appear to be driven by, say, modern day africa systematically under-performing because adding continent fixed effects do little to change the technology coefficient in model 2 here.
This is pretty amazing given that (1) this measure of technology is imperfect (2) our modern day estimates for HCE and AIC should be much more accurate and more precise (less noise, less inference) and (3) presumably these health outcomes should be mostly determined by current day wealth and health care expenditures. That we still pick up such a strong signal further confirms that income and health expenditures are far from the only relevant determinants of health.
Presumably the preferred arrow of causation favored by US health care critics goes something like GDP -> HCE -> health care provision/quality -> Life Expectancy, but here we find measures of deep history, which far pre-date these particular material circumstances and which are surely have some significant measurement error associated with it, predicts not only GDP (and thus HCE) but also does much to mediate the influence of these presumed intermediate causes in OLS. Funny that!

Even though there is a bit of a residual here, the US looks fairly reasonable in the broader global perspective.

If I plot this with continent fixed effects and a dummy variable (is_latin), I get a pretty similar result:

Note: Hispanics seem to be substantially longer lived than expected in the US (see “hispanic paradox”) and in multiple analyses here, which push out US and Canada when continent fixed effects are applied (groups south-north america together), so I felt it best to include a dummy variable for the (broad) region to correct for this.
Along a similar vein, if I inspect state histories using the Putterman and Weil state history series, I find deep history has a rather profound impact here too. Not quite as much as the technology series, but still clearly significant and still clearly robust to the inclusion of continent fixed effects (in fact, the presumed income effects shrink quite considerably when continent FE are included!)

Note: statehistnXXXv3 where XXX is the discount factor (0.1%, 1.0%, and 5.0%).
Likewise, if I combine the 1500 AD technology and state history scores into the same dataset, the apparent income/HCE effect plummets.


There are a million different ways to analyze this data, but I hope I have at least convinced you that you must take endogeneity seriously. The history of people predicts health outcomes today even after we take into account their current income and current health expenditures. Much of the apparent income effect and health expenditure effect are confounded by demography. You should not assume the bivariate relationship between HCE and Life Expectancy is entirely causal or, especially, that the differences between countries are primarily a product of differences in health provision, especially when those countries differ in other important dimensions.
The patterns in the United States are inconsistent with a general pattern of poor health care provision
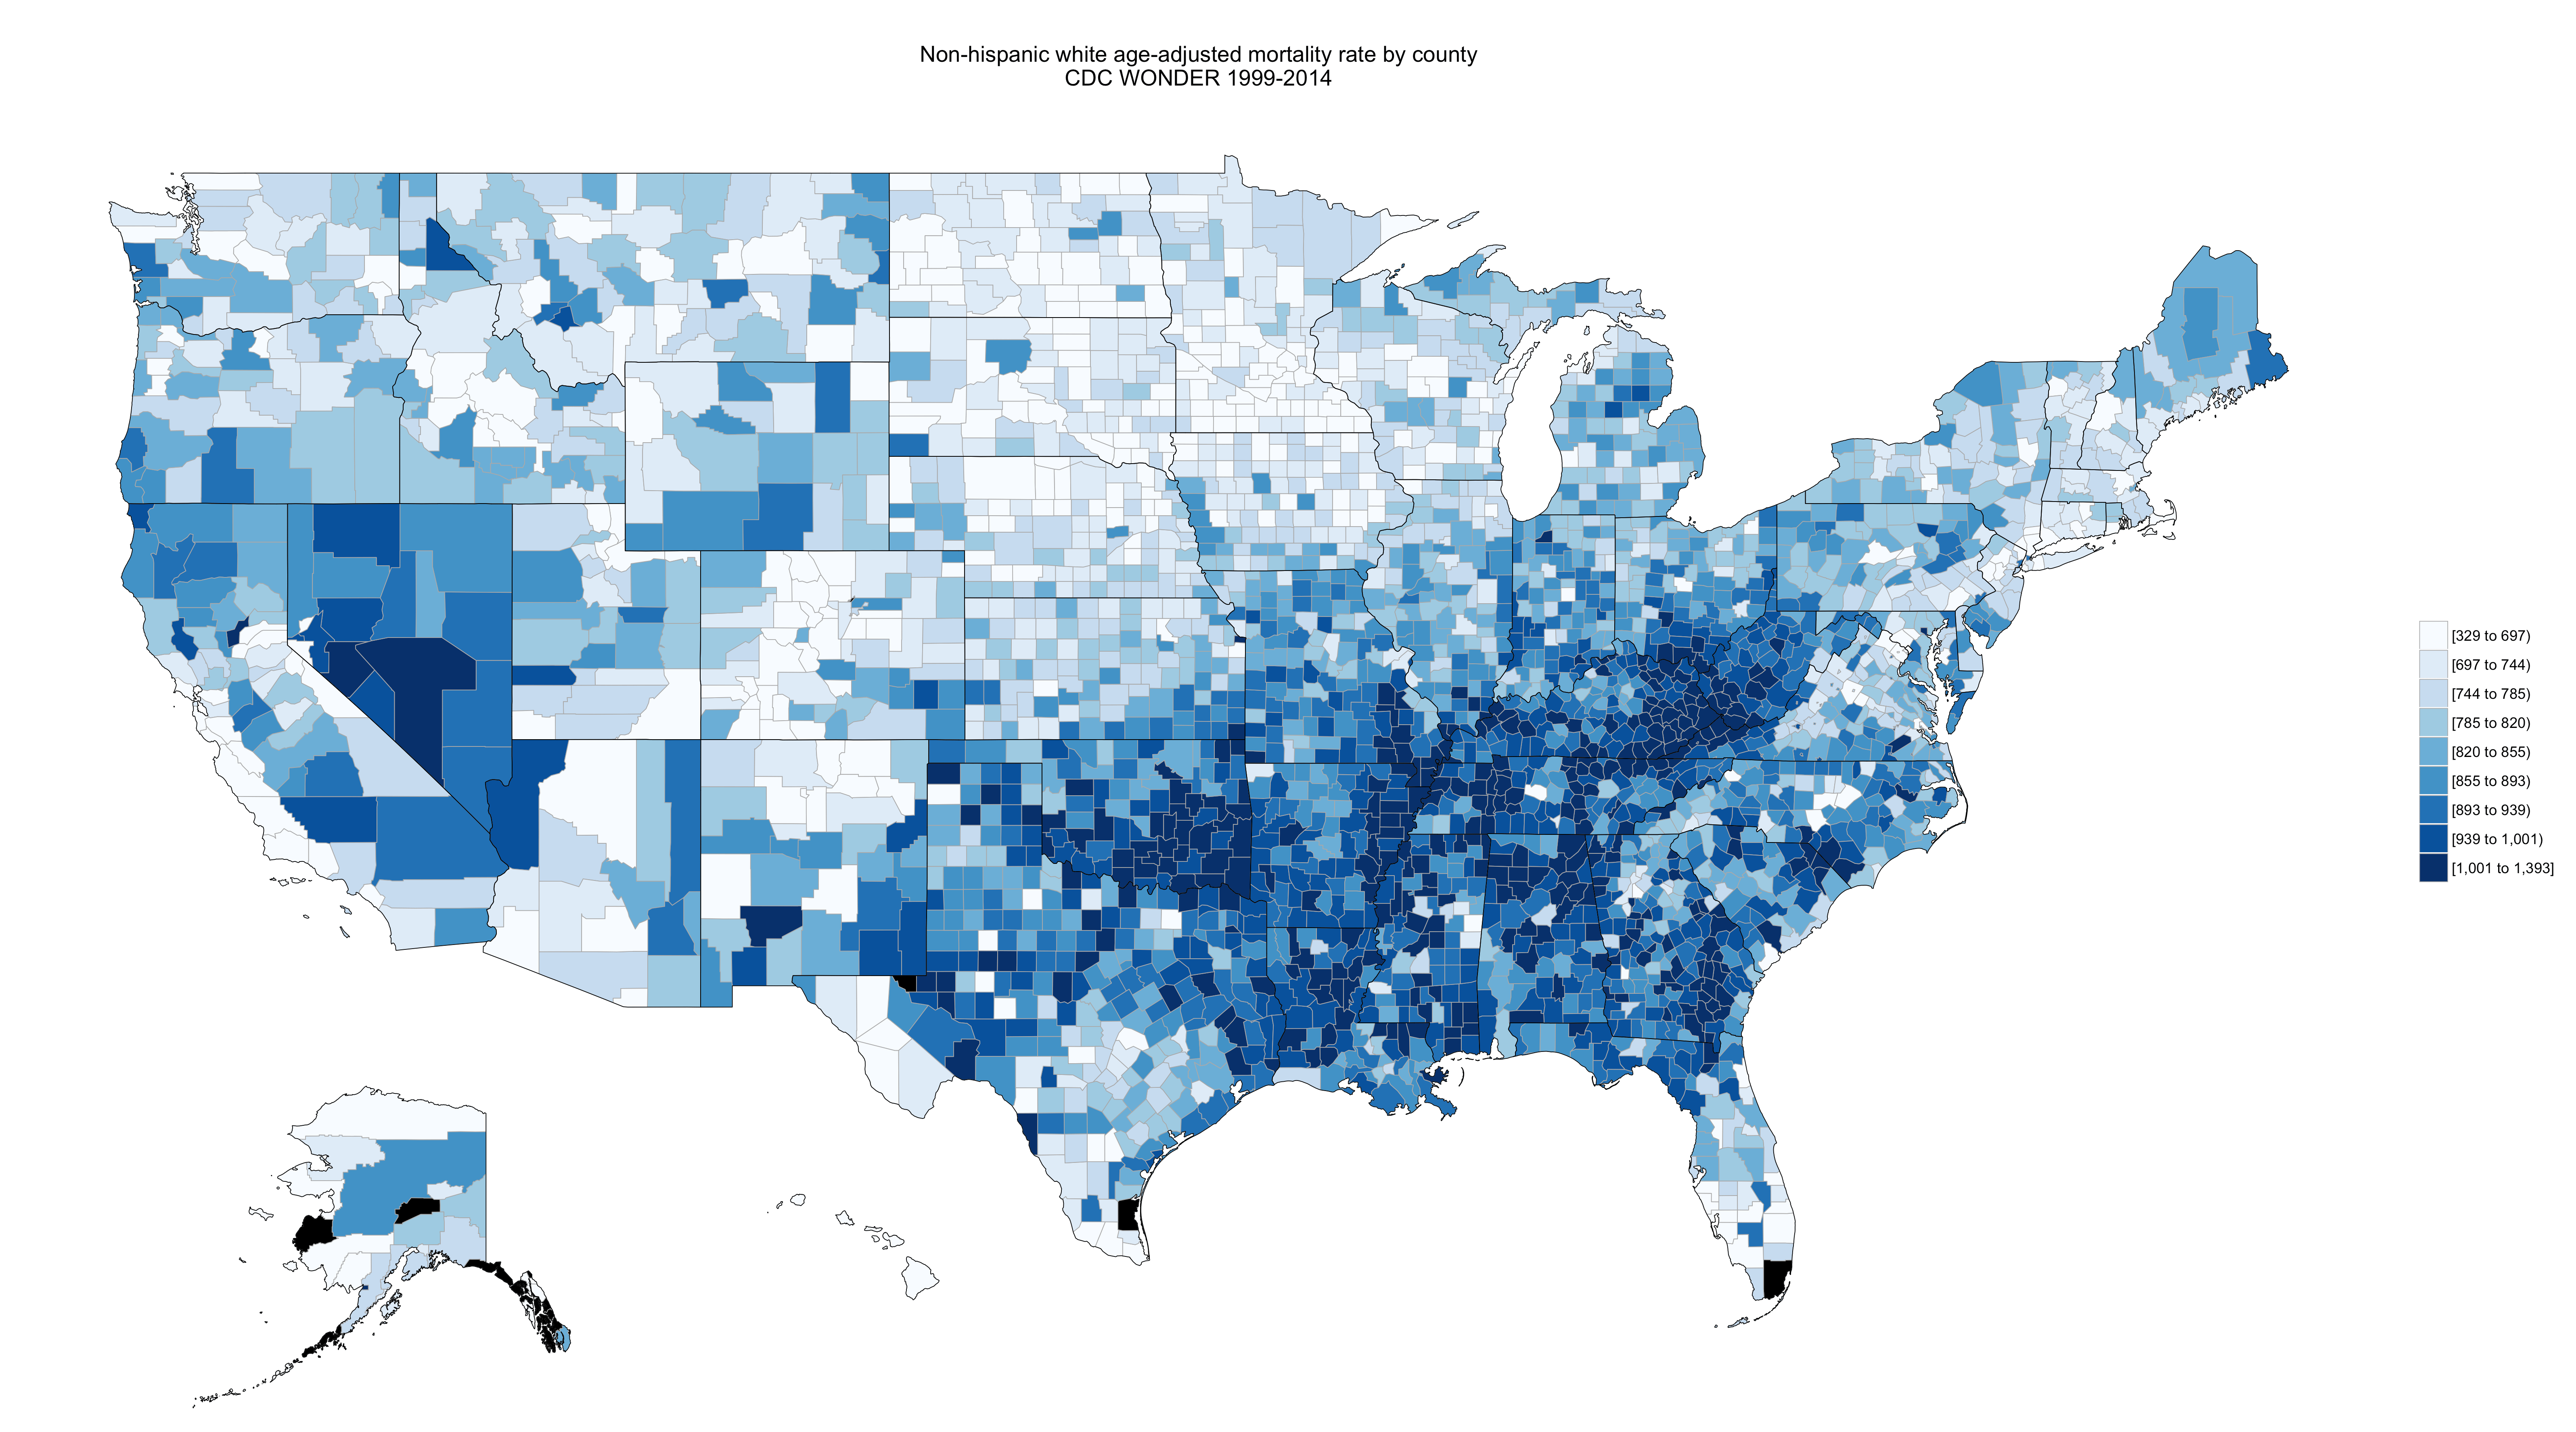
US life expectancy is dramatically depressed by the south and Appalachia. The more northern and coastal states of the east and west coast do quite well on average and counties in neighboring states further removed from these regions tend to as well (see South Florida).

source
If US life expectancy was reduced primarily because of peculiar differences in how health care is managed and paid for in the US, as most of its detractors argue, I would expect most places to be substantially below average. Instead what we find is many areas performing fairly comparably to N/W Europe (before accounting for confounders) and some regions with fairly distinct demographics and histories contributing dramatically to mean underperformance despite sharing very similar health care systems vis-a-vis reimbursement practices, hospital types, etc as the rest of the United States.
Nor, for that matter, are these patterns well explained by poverty rates, income, or lack of health insurance. We tend to find similar patterns even if we control for these things.


Race plays a major role
There is a strong and very linear relationship between percent black and overall mortality measures.

At the county level it explains about 17% of the variance in premature age-adjusted mortality in population weighted terms. And including covariates like median income, poverty, health insurance rates, income inequality, etc, percent black remains a strong and highly significant predictor.

You might also note that neither inequality nor health insurance rates are associated with higher mortality after controlling for income and race.
This is not entirely driven by higher black mortality rates
While there is sure to be a significant mechanical effect from higher black mortality rates (which also, in and of itself, partially explains overall US life expectancy), we also find that percent black predicts higher non-hispanic white mortality at multiple levels of analysis and that this holds up to various other controls.
See Angus Deaton’s work on how fraction black mediates the apparent effects of income inequality.


We also find large effects outside of the south (clearly not just a proxy for “south”)
This doesn’t entirely surprise me since I have seen similar patterns with covariates of health in other research and analysis I have done, both thorough and very casual. For instance, I have found fraction black associated with higher levels of stress, lower levels of subjective well being, higher crime rates, school discipline problems, etc… and they’re generally poorly explained by income, education, and other observables (save, perhaps, rate of single motherhood rates and related which are strongly associated with percent black). These strike me as plausible channels through which health of other communities, especially multi-generational whites (as opposed to more insulated recent immigrants), might be effected. This is also consistent with the research conducted by Robert Putnam vis-a-vis “diversity” and social capital (and related). My suspicion is that this is less about race per se than behaviors and lifestyles that tend to be strongly associated with particular groups today and how those behaviors affect the status quo. With enough controls (e.g., % single mother households) the significance of race/ethnicity would probably shrink substantially, nevertheless it’s clearly a strong predictor and it has little to do with the usual suspects (e.g., income, wealth, state, region, etc).
For instance, modeling non-hispanic white (NHW) age-adjusted mortality rates by county with a robust set of controls for the white populations’ characteristics and those of the broader community (especially including income)

We clearly find residuals are positively correlated with percent black in regions well outside of the south or those are in close proximity with it.


Much of what we associate with the south doesn’t look to be an exclusively southern phenomenon. If anything the slopes tend to be even steeper outside of the south.
Interestingly, if you so much as control for fraction of children in county (all races) living in single-mother families, these effects disappear!

Percent black explains most of the variance in family formation at a county level, but nonetheless this tends to go to my point that it’s not black per se that causes this; it’s behaviors associated with them that brings this about and, once you control for this with a reasonably strong measure of this nature, black tends to lose most (and sometimes all) of its explanatory power.
Besides the relatively more objectively negative effects (crime and social disorder more broadly), there is surely also some bi-directional cultural exchange between populations. When a group moves somewhere they bring their culture and traditions with them and they adopt some of the prevailing culture and traditions. Which is to say that “white” culture, to the extent we can talk about it as a single thing, has been influenced to some degree by its historical and on-going interactions with blacks and other groups (which we can’t easily observe or control for with OLS and the like). See food/cuisine, music, etc. Differences of these sorts may have health consequences.
Whatever the precise causal pathways these factors significantly distinguish the United States from other highly developed countries and they have little to do with how health care is provisioned.
Neighborhood effects
A number of people recently are arguing that communities, even zip codes, have massive causal effects on health and wellness. Though at least some of these apparent effects are bound to be genetically confounded due to people selecting into communities non-randomly (above and beyond controls due to measurement error and unobservables), I do not entirely dismiss the significance of place within the US due to greater spatial and racial/ethnic diversity, not to mention data produced by recent evaluations of Moving-to-Opportunity (MTO) experimental data and the like.

source
These show clinically significant reductions in obesity and other indicators of metabolic disorders despite having little-to-no impact of income, education, access to health care, or exercise in their data (they speculate stress may explain this).
Where I differ from most of these proponents is the apparent view that neighborhoods are mostly a product of income/poverty that merely happens to people (exogenous factors). Rather my view is people create their environment to large degree and it has less to do with material living conditions than people like to believe (yes, even in the US). Moving a handful of individuals into substantially better ordered and healthier behaving communities may well have profound health implications for the movers, but the relevant characteristics of those communities are mostly a product of the sorts of people that occupy them. It is not a magical property of the land on which they stand. Moreover, the effects are bound to be substantially symmetric, i.e., communities shapes movers but movers also shape their communities profoundly (though, in small proportions or over short time intervals, the effects on mean outcomes are apt to be too modest to measure without a large number of observations).
White life expectancy in most northern states compares reasonably to much of Europe

This is particularly true outside of Appalachia. It’s possible this is just a coincidence, perhaps operating as a proxy for historical white southern migration or unmeasured SES (despite controls for income, education, etc etc), but it’s certainly not well explained by income and other common economic covariates.
I certainly don’t find these racial associations at the state level with other groups, notably including latinos (who are are pretty much identical to blacks in economic dimensions)

Black and white life expectancy are quite significantly correlated at a state level, but I find little sign of asians and latinos being correlated with blacks or whites.

The health system is unlikely to explain these patterns.
Rural (non-urban) fraction probably also makes a difference
Using nothing more than a few broad racial/ethnic variables and percent of county rural I can explain roughly half of the population-weighted variance between counties.

And these predictions largely square with what we find at a state level

I could, of course, explain more with predictors like education, income, etc, but presumably most people accept that these variables speak to a certain reality that has little to do with the peculiarities of our health care system in the broader international perspective (i.e., reimbursement systems etc etc). These also distinguish the US from other highly developed countries with which we are usually compared.
A larger fraction of our population lives further away from significant population centers than what is typically found in many other developed countries, which go to employment, education, health care provision, etc to varying degrees.

Although US population density is certainly amongst the lowest, this statistic isn’t very informative for these purposes because it matters little if there are vast unoccupied areas in a country per se. The OECD statistics on percentage living in urban areas aren’t very useful here either because the definitions vary quite substantially between countries (you’ll find population density varies considerably by region types. What US calls “urban” is several fold less than dense than “urban” in the UK, Germany, etc, likewise for other categories).
Non-hispanic whites are also substantially more likely than other groups to live in less urbanized environments.

Controlling for cognitive ability (using district level test scores as a proxy for IQ rolled up to county level) and major racial/ethnic composition we find a strong and generally linear pattern of decreasing life expectancy in rural areas of the United States.


Behavioral differences explain most of the variance
I can explain most of the differences in county life expectancy using smoking rates, obesity rates, and physical inactivity. All three are quite well correlated with each other and they correlate with other behavioral issues as well (drug use, violence, etc). Introducing controls for income, inequality, insurance rates, education, and more doesn’t much change the conclusion that these are very powerful predictors.

Taking the simple average of standardized smoking, obesity, and inactivity rates, I can produce a reasonable behavioral index to explain most of the variance in county level life expectancy rates.

Of course we can do a bit better still with OLS:

And better still if we account for 3 major racial groups (% black, asian, and hispanic) and add the injury death rate into the mix.

And if we use this same model to predict outcomes at a state level:

I submit that there isn’t a lot of mystery here. States with high rates of smoking, obesity, low-activity, and accident deaths suffer quite predictably; those with comparatively healthy lifestyles by US standards don’t. Even if this is in part acting as a proxy for other behavioral/lifestyle issues or, perhaps, unobserved genetic differences, this is still significant, especially when there is very little evidence to suggest that differences in insurance, physicians per capita, spending, etc explain any significant fraction of the variance within the United States.
Let’s compare state-level expenditures for giggles:

There does not appear to be any significant correlation here. Presumably at least some critics would expect to see a correlation if they believe (1) all states were approximately equally efficient (2) HCE isn’t inherently subject to rapidly diminishing returns and (3) genetic and behavioral differences are of trifling significance.
Wealth is unlikely to explain much
Lest you think state differences are just a product of pervasive grinding poverty in southern states, Appalachia, etc, I invite you to compare GDP per capita figures in these states to many high HDI OECD countries.

Note: I excluded Luxembourg and District of Columbia (USA) from this analysis because they are astronomically high, which makes it hard to see the rest, and not reasonable comparisons either. Ideally I’d have a measure like AIC at a state-level too (see high export states like N. Dakota and Alaska!), but I don’t actually have AIC at a state level and I’m not confident PCE can be equated reliably with AIC.
Even the poorest states are quite rich as compared to much of the mid-tier OECD countries.
Do you really think Mississippi has equivalent human capital characteristics as, say, New Zealand? West Virginia vs Finland? North Carolina vs Netherlands? If wealth itself were responsible for these differences you’d expect many of the poorest countries to be lagging here and yet we find precisely the opposite.
I submit that human capital characteristics through their effects on health behaviors are much stronger predictors of health “outcomes” amongst reasonably wealthy countries. Just because relatively poor states like Mississippi, West Virginia, Alabama, and company have wealth equivalent to much of the OECD does not mean that they are otherwise equivalent. In fact it’s quite likely if they were to secede from the United States their GDP would plummet as they enjoy economic spillovers and significant transfers from more productive parts of the United States today.
Nor are these likely to be explained by state inequality
Although, at first glance, it might look like there is a mild correlation between state income inequality and state life expectancy, this is mostly driven by percentage black (produces higher inequality and is associated with worse outcomes with extensive controls).
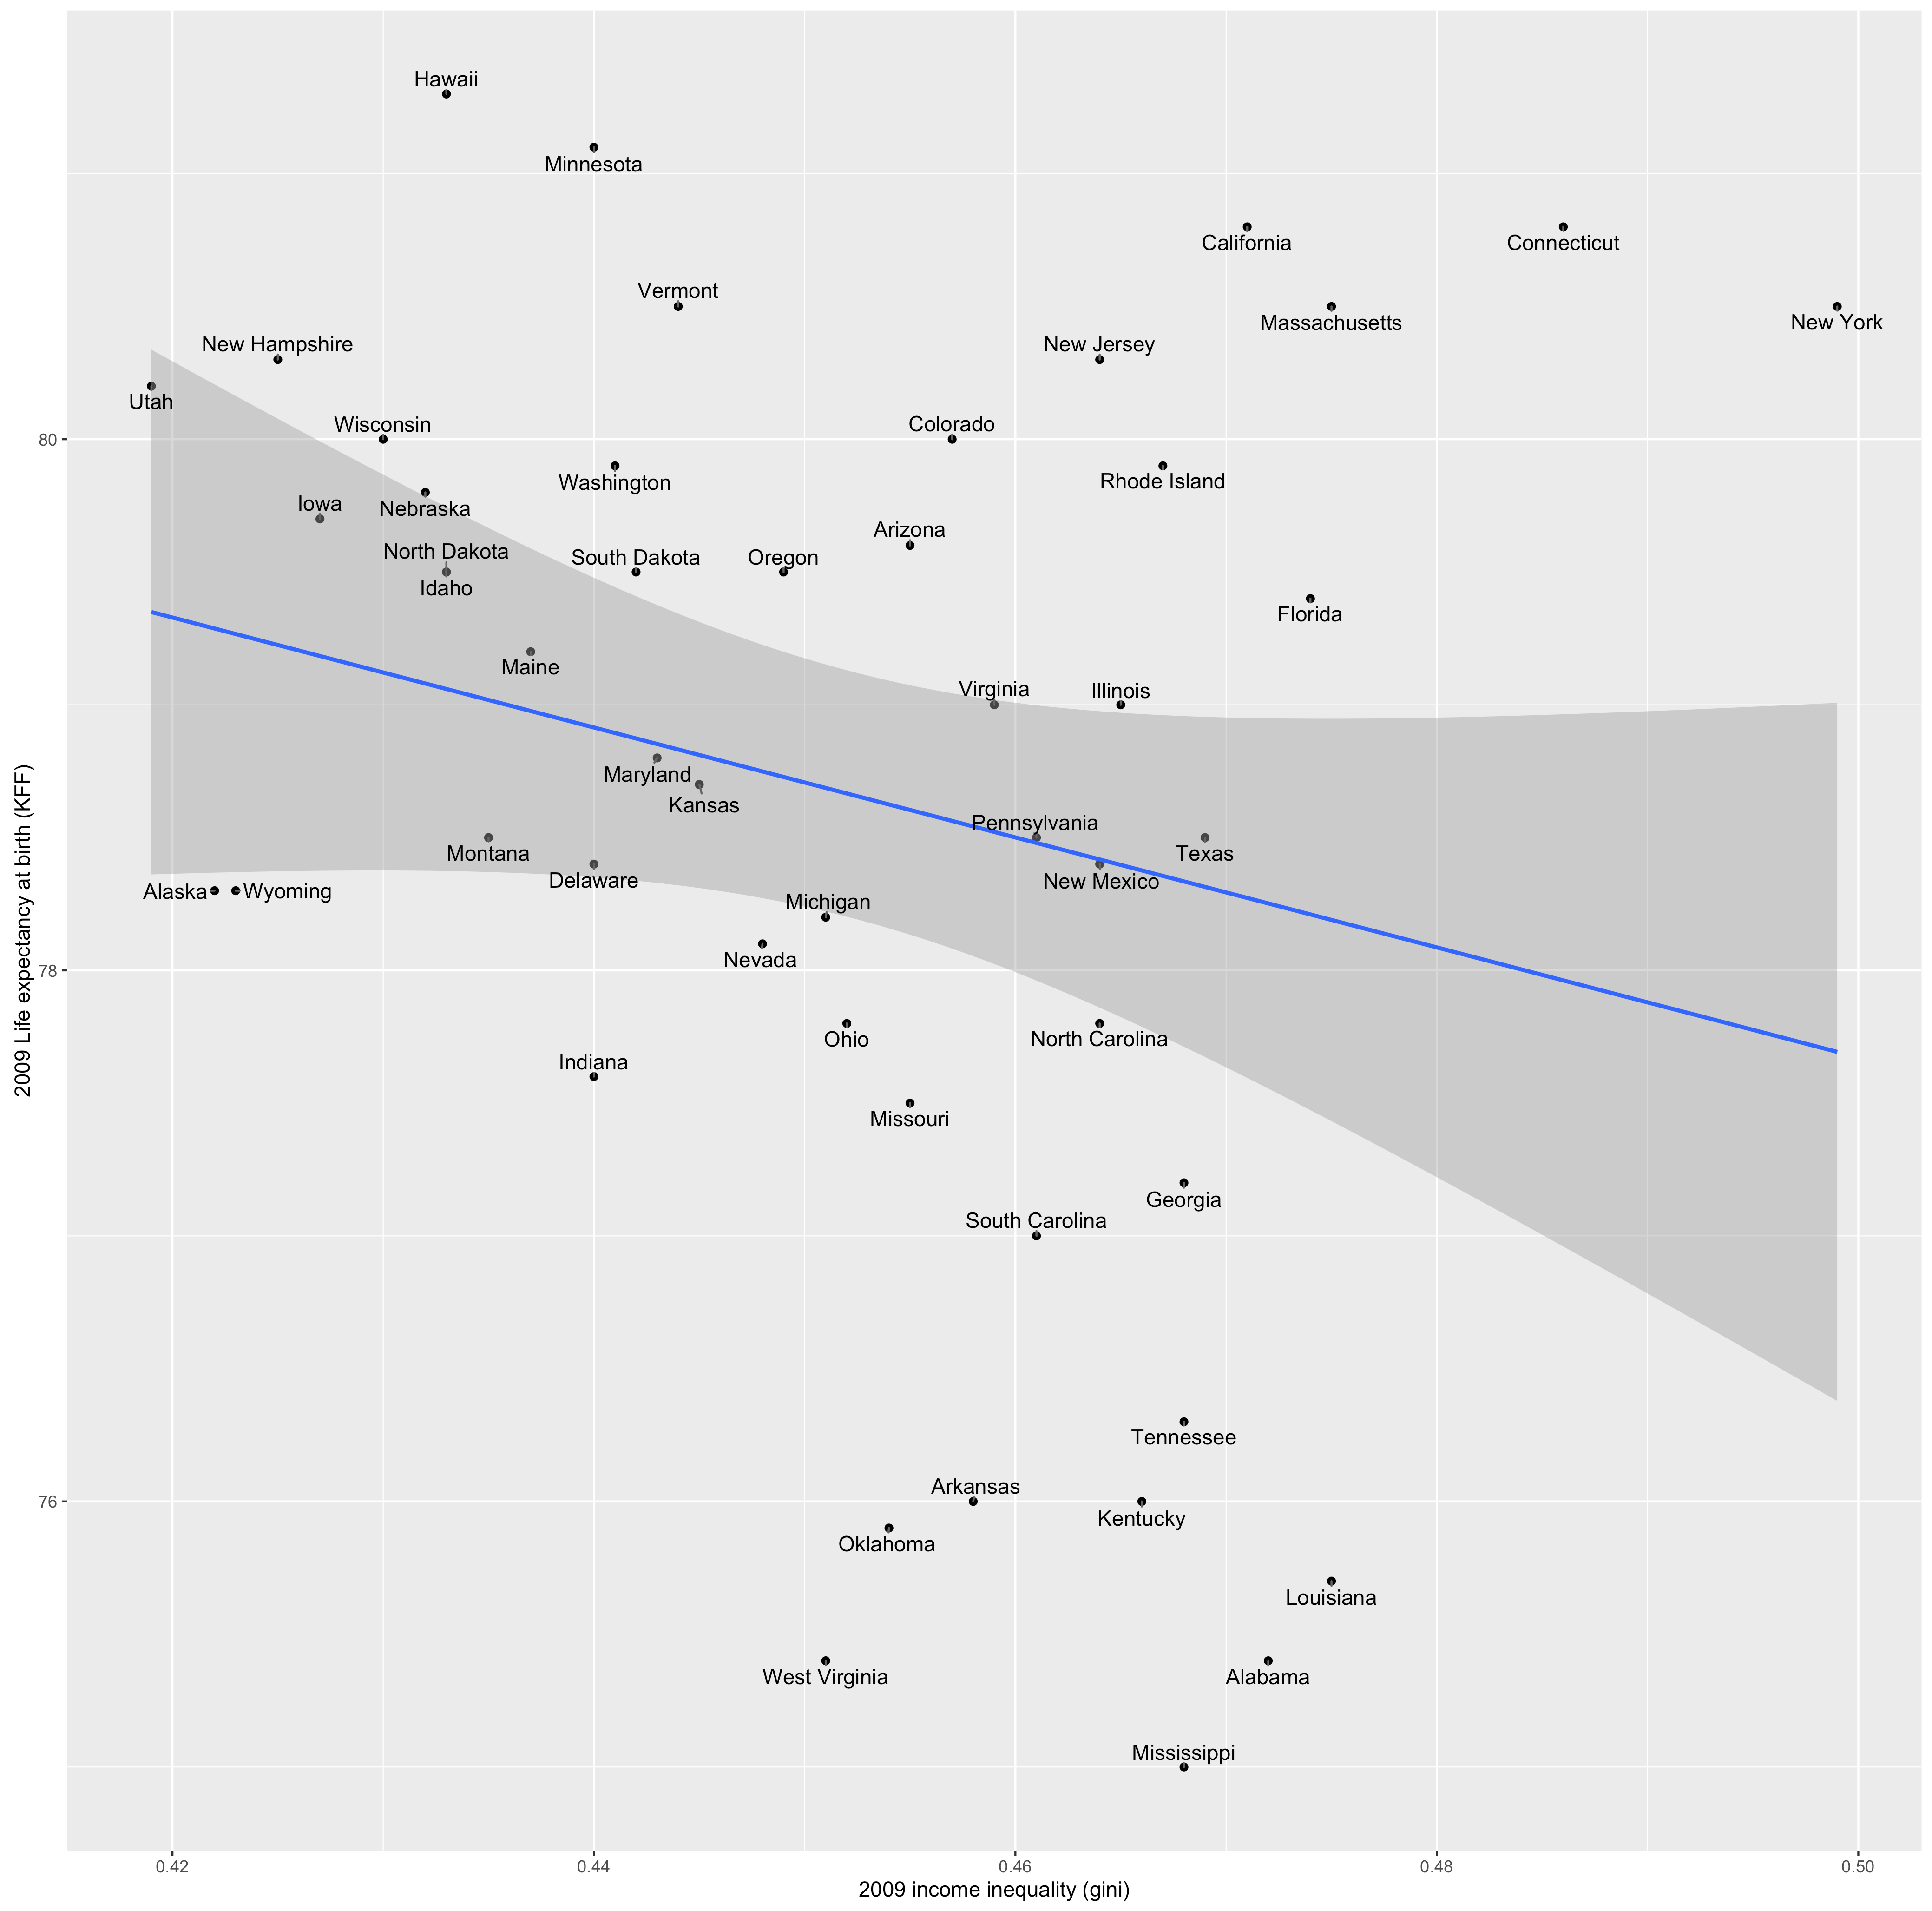
For instance, we don’t find this correlation if we look at black life expectancy.

Or if we control overall life expectancy for percent black

Or white life expectancy for percentage black

Several significant US minority groups live much longer
If you don’t believe genes or subtle cultural/lifestyle differences can yield large systematic differences in mortality rates, how do you explain this?

Why is it that Latinos, a statistically poor and not particularly well insured group, significantly outlive europeans in Europe even in some generally mediocre states vis-a-vis white and black life expectancy if the health system is presumably to blame for abbreviated lives? Why do we find low income asians and latinos significantly outliving whites and, especially, blacks in California?


source
Careful studies on so-called “salmon bias”, the tendency for immigrants to return to their homelands as they get old/sick, show it is of little significance. Likewise for selection bias.
We also find hispanics have similar IMR nationally as whites despite their relative poverty, greater rates of obesity, diabetes, etc. This tends to argue further against salmon bias.

People have found that differences smoking rates are likely to play a major role (note: surveys of smoking rates, intensity, etc tend to be subject to substantial measurement error and thus underestimate the true effects)

They’re also significantly more physically active, thanks to concentration in occupations involving manual labor (agriculture, cleaning, etc), which implies better health (despite some risk factors like obesity). And there is a fair amount of data to suggest that their life expectancy is inversely proportional to how well acculturated they are (which goes diet, lifestyle, social/family support, etc). I also found that controlling for risk-factors like smoking, obesity, and activity levels fully mediates the association life expectancy and mortality associations with percent hispanic/latino at a country level.
We also find the Amish live significantly longer than (non-Amish) non-hispanic whites despite what is sure to be a much lower material standard of living and large avoidance of the health care system.

There is no risk for selective migration, salmon effect, or other related confounds here because the Amish have been here for generations.
All of this is generally consistent with the importance of lifestyle and behavioral risks (smoking, family stability, diet, physical activity, etc).
Differences in health care provision explain virtually none of the overall variance in mortality
There is very little evidence to suggest that differences in health care provision within the United States explain a significant fraction of the observed differences today and quite a lot of evidence that shows otherwise.
For instance, with countyhealthrankings.org data I find no sign that more health care provision is correlated with reduced mortality (in fact, somewhat the opposite). These indicators also do little to change the associations with income levels, race/ethnicity, education, and the like.

Likewise, Raj Chetty et al finds that even amongst lowest income groups insurance rates, preventative care, medicare costs, and they like are not significantly associated with life expectancy and, if anything, these indicators also point in somewhat the opposite direction.

Likewise, Schoenbaum et al find no association between so-called “amenable mortality” (health issues that the health system can presumably help fix) and uninsurance rates:
This article examines associations of socio-demographic and health-care indicators, and the statistic ‘mortality amenable to health care’ (amenable mortality) across the US states. There is over two-fold variation in amenable mortality, strongly associated with the percentages of state populations that are poor or black. Controlling for poverty and race with bi- and multi-variate analyses, several indicators of health system performance, such as hospital readmission rates and preventive care for diabetics, are significantly associated with amenable mortality. A significant crude association of ‘uninsurance’ and amenable mortality rates is no longer statistically significant when poverty and race are controlled.
Likewise, perhaps even more persuasively, experimental evidence points to similarly null results following the rollout of PPACA (“Obamacare”) in Oregon despite significant increases in health care utilization.

Along a similar vein, there was a RAND experiment a few decades ago that found similar null results (I’ll let Robin Hanson summarize this literature)
From 1974 to 1982 this experiment spent about $50 million to randomly assign over two thousand non-elderly families in six U.S. cities to three to five years of a specific medical price, ranging from free to full price, provided by the same set of doctors. (See the 1983 Brook et. al. New England Journal of Medicine article, and the 1996 Newhouse et. al. book Free for All?) The experiment’s random assignments allowed it to clearly determine causality. Being assigned a low price for medicine caused patients to consume about 30% (or $300) more in per-person annual medical spending, though less for hospital spending and more for dental and “well care.”
The RAND experiment was not quite large enough to see mortality effects directly, and so the plan was to track four general measures of health, combined into a total “general health index,” and also 23 physiological health measures. Their main result: “For the five general health measures, we could detect no significant positive effect of free care for persons who differed by income … and by initial health status.” This summary isn’t fully forthcoming, however. At a 7% significance level they found that poor people in the top 80% of initial health ended up with a 3% lower general health index under free medicine than under full-priced medicine.
Among their many specific findings, the most significant was at the 0.1% level: people with free eyeglasses could see better. But it has long been obvious that eyeglasses help people see, and eyeglasses are basically physics, not “medicine.” The second most significant specific finding was that at a 1% significance level those with free medicine had about one and a half fewer days per year when they could do their normal activities. This effect was also to be expected, due to time needed for doctor appointments.
The third most significant specific finding, and strongest unexpected one, was that people with free medicine had lower blood pressure, at a 3% significance level. But a study that looks at thirty measures in total should, just by chance, find one unexpected finding that seems significant at the 3% level. So taking data mining (i.e., searching for results) into account, this blood pressure result should be set aside.
Objectively read, i.e., studying the actual data instead of weak characterizations of it, the weight of the evidence points strongly against differences in health care access, especially via health insurance, being a significant contributor to broad differences in health outcomes. We don’t find this at an international level amongst broadly comparable countries; we don’t find it domestically between counties, states, MSAs, etc; and we don’t find this with more carefully controlled experimental evidence.
I do not mean this to suggest that health care is totally irrelevant, but rather that the entire developed world gets almost all of the bang for its buck vis-a-vis broad mortality measures in the first few dollars spent. This sort of high impact medicine is broadly similar everywhere in the developed world (antibiotics, vaccines, trauma medicine, etc) and tends to be targeted at cases where its apt to make a real difference (those with obvious need), so the differences in broad averages between places in the developed world largely come down to genetics and lifestyle. The US could probably cut spending in half with little obvious effect on overall life expectancy (not the same as specific outcome measures), but the same is almost certainly true for most of the developed world too!
US performance in cause-specific mortality does not correlate as expected with the degree to which those causes are explained by spending
As I mentioned previously, using “amenable” or “avoidable” mortality to gauge the relative efficacy of health systems is problematic While these may in principle be amenable to health care that does not imply that the variance between places or groups is likely explained by health care given that many of these causes of death are also heavily influenced by non-health system factors. For instance, we could argue HIV/AIDS is mortality is amenable to medicine insofar as we can substantially extend the lives of the infected, but no one has any cures yet and some populations are infected at much greater rates than others (behaviors, existing infection rate in the population, etc), so it’s a great mistake to assume greater mortality is a result of worse health care.
Another way to approach the issue of health system inputs versus outcomes is to look for patterns between countries by causes….
If (1) US health care was dragged down by inefficiency (2) developed countries are generally efficient in their health expenditures (3) developed countries are relatively similar in actual cause-specific non-health system risk factors and (4) developed world has not long since past point of diminishing returns (given current state of technology/know how), then I would expect to find the degree to which cause specific mortality is predicted by overall health expenditures (excluding USA) to correlate substantially positively with US outcomes relative to others in a quasi-poisson model trained with non-US data. That is, the larger the proportion of cause specific variance explained by overall health expenditures (amongst non-US), the larger the US standard deviation from mean outcomes should be. Even if US fails similarly in all areas of medicine the non-health care sources of variance should still help produce the expected correlation. In this conception I would kind of expect things like YLLs to accidents to be relatively less correlated as compared to, say, YLLs to heart disease (especially due to the presumed power of preventative medicine relative to counter-veiling forces vis-a-vis diet, lifestyle, etc).
What I find is not consistent with or is even the opposite of the aforementioned expectations, i.e., the more health expenditures appear to be associated with reduced mortality (negatively correlated w/ YLL) the better the US appears to look. With more narrowly defined comps the slope is mostly flat (correlation coefficients with many causes tend to be more modest to sometimes non-existent) whereas with a broader range of comps the slope is distinctly negative.

Note: The green line is the slope only including negatively correlated (more HCE=lower mortality), red line is only positively correlated (more HCE associated with more mortality), whereas purple is the combined slope regardless of correlation sign.


And if we do the same with closer comps:


Although the US is a bit more than one standard deviation worse relative to the most developed countries this does not appear to correlate in the expected direction with the association between cause specific YLL and HCE. To my eyes this is entirely consistent with the US population being sicker due to diet and lifestyle and the health system doing what little it can to counteract these effects. Please note that (1) a significant fraction of these causes actually are significantly positively correlated with HCE (more HCE/GDP associated with more mortality) (2) many are weakly correlated — especially amongst the most developed and (3) I am not controlling for confounders like national income, obesity, etc etc.

Note: The blue line is quasi-poisson regression line modeled as log(HCE), excluding USA, projected for the entire range
It seems that the general trend here is those causes have the greatest impact on life expectancy tend to be relatively poorly explained by HCE (especially broadly throughout the entire distribution). These are also the areas where US tends to do fairly poorly (albeit significantly less than many might imagine….even small excess in these categories has a large effect). On the other hand, those that are well and thoroughly correlated (not just concentrated amongst the least developed) typically drive a relatively small proportion life expectancy and these are also areas where the US tends to be much more in line with expectations (to even outperform). These patterns are consistent with lifestyle differences, especially obesity/diabetes, current/historical smoking, violence, accidents, etc.
Health care interventions have little average effect on key indicators today
Despite the persistent lack of substantial independent relationship between health care provision and mortality, growing rates of obesity around the world, and better explanations for these differences (national wealth, diet, human capital differences, etc), some people still seem to think that somehow these health markers would be much different under another health regime. This strikes me as a weak argument because the best available evidence suggests no health system has the foggiest clue how how to significantly curb obesity long term through lifestyle intervention. The weight loss reductions with the obese through lifestyle interventions are tiny (meta-analytic estimate of 1.56kg or 3.4 lbs)

Typical results are modest weight loss after a few weeks, followed by regaining of weight, so that within a year or two results are pretty negligible. Longer term studies (e.g., 5 years post) show approximately no long term improvement. Moreover, some of the relatively more successful studies with intensive intervention show that even sustained (modest) weight loss patients had just as many heart attacks, strokes, and other cardiovascular related health problems! In short, about the only thing that works is bariatric surgery and related mechanical interventions and these are not cheap or particularly under-utilized in the US. Therefore, it is extremely unlikely that health care plays a substantial role in Europe’s lower rate of obesity, diabetes, etc.
State and regional differences pre-date modern health care systems
“Studies of colonial mortality present a picture of considerable regional variation in adult mortality, with New Englanders enjoying life expectations well above those for individuals living in the Chesapeake and further south.
There is evidence of the beginning of convergence in adult mortality rates during the colonial period. At age twenty, the life expectation for both men and women appears to have been more than 50 percent higher in New England than the Chesapeake in the seventeenth century. For the early eighteenth century, a comparison of the estimates of Phillip Greven, James Somerville, and Susan Norton for New England with Daniel Levy’s for Maryland and South Carolina suggests that the New England advantage had fallen to about 25 percent.”

source
Likewise, even amongst a relatively elite social strata, there were significant regional differences in life expectancy.
 source


source
Although the earlier (pre-public health) data are a bit sketchy, they certainly suggest these regional differences predate modern health care systems. There might be long standing differences in life history strategy, i.e., if life is perceived as short people are apt to be more inclined towards immediate fulfillment instead of optimizing for long term health and wellness. There are likely to be significant spillover effects so the consequences may not be limited to the lower socioeconomic groups. One might argue (rather speculatively) that had the south emphasized education, public health, and the like as much as some parts of New England did this might look somewhat different centuries later, but there many counters to this and that is really an entirely different argument than the presumption that these differences are substantially a result of inadequate health care provision today!
Geographical correlates of health
The United States is considerably closer to the equator than the most developed regions in the OECD. Many parts of the US south are particularly hot and humid by European standards.


Historically, even in relatively recent history, this had major health implications for the US south vis-a-vis malaria and various other tropical diseases.

This also had (and likely still has) some effect directly through heat exhaustion and the like. Today air conditioning/electricity offset most of its direct effects.


source
There appears to be something of a U-shape relationship between temperatures and mortality wherein the sweet spot is around 50-60 degrees Fahrenheit (10-15.5 C) and much hotter or cooler will tend to cause significant increases in mortality all else being roughly equal.

source
Because of modern technology (air conditioning, electricity, treatments for tropical diseases, antibiotics, etc) I don’t think these are terribly significant today, but these may have contributed to some of the patterns we see today through its effects on attitude.
Expanding on geographic themes and historic migration patterns
Previously I mentioned that there are significant spatial patterns in mortality/life expectancy in the United States. These areas are centered predominantly around the South and, especially for non-hispanic whites, Appalachia.

source
There are strong trends along longitude and latitude such that you will see substantially less mortality further you are away from these places. Perhaps the best way to visualize this is with a density map weighted for the mortality rate.
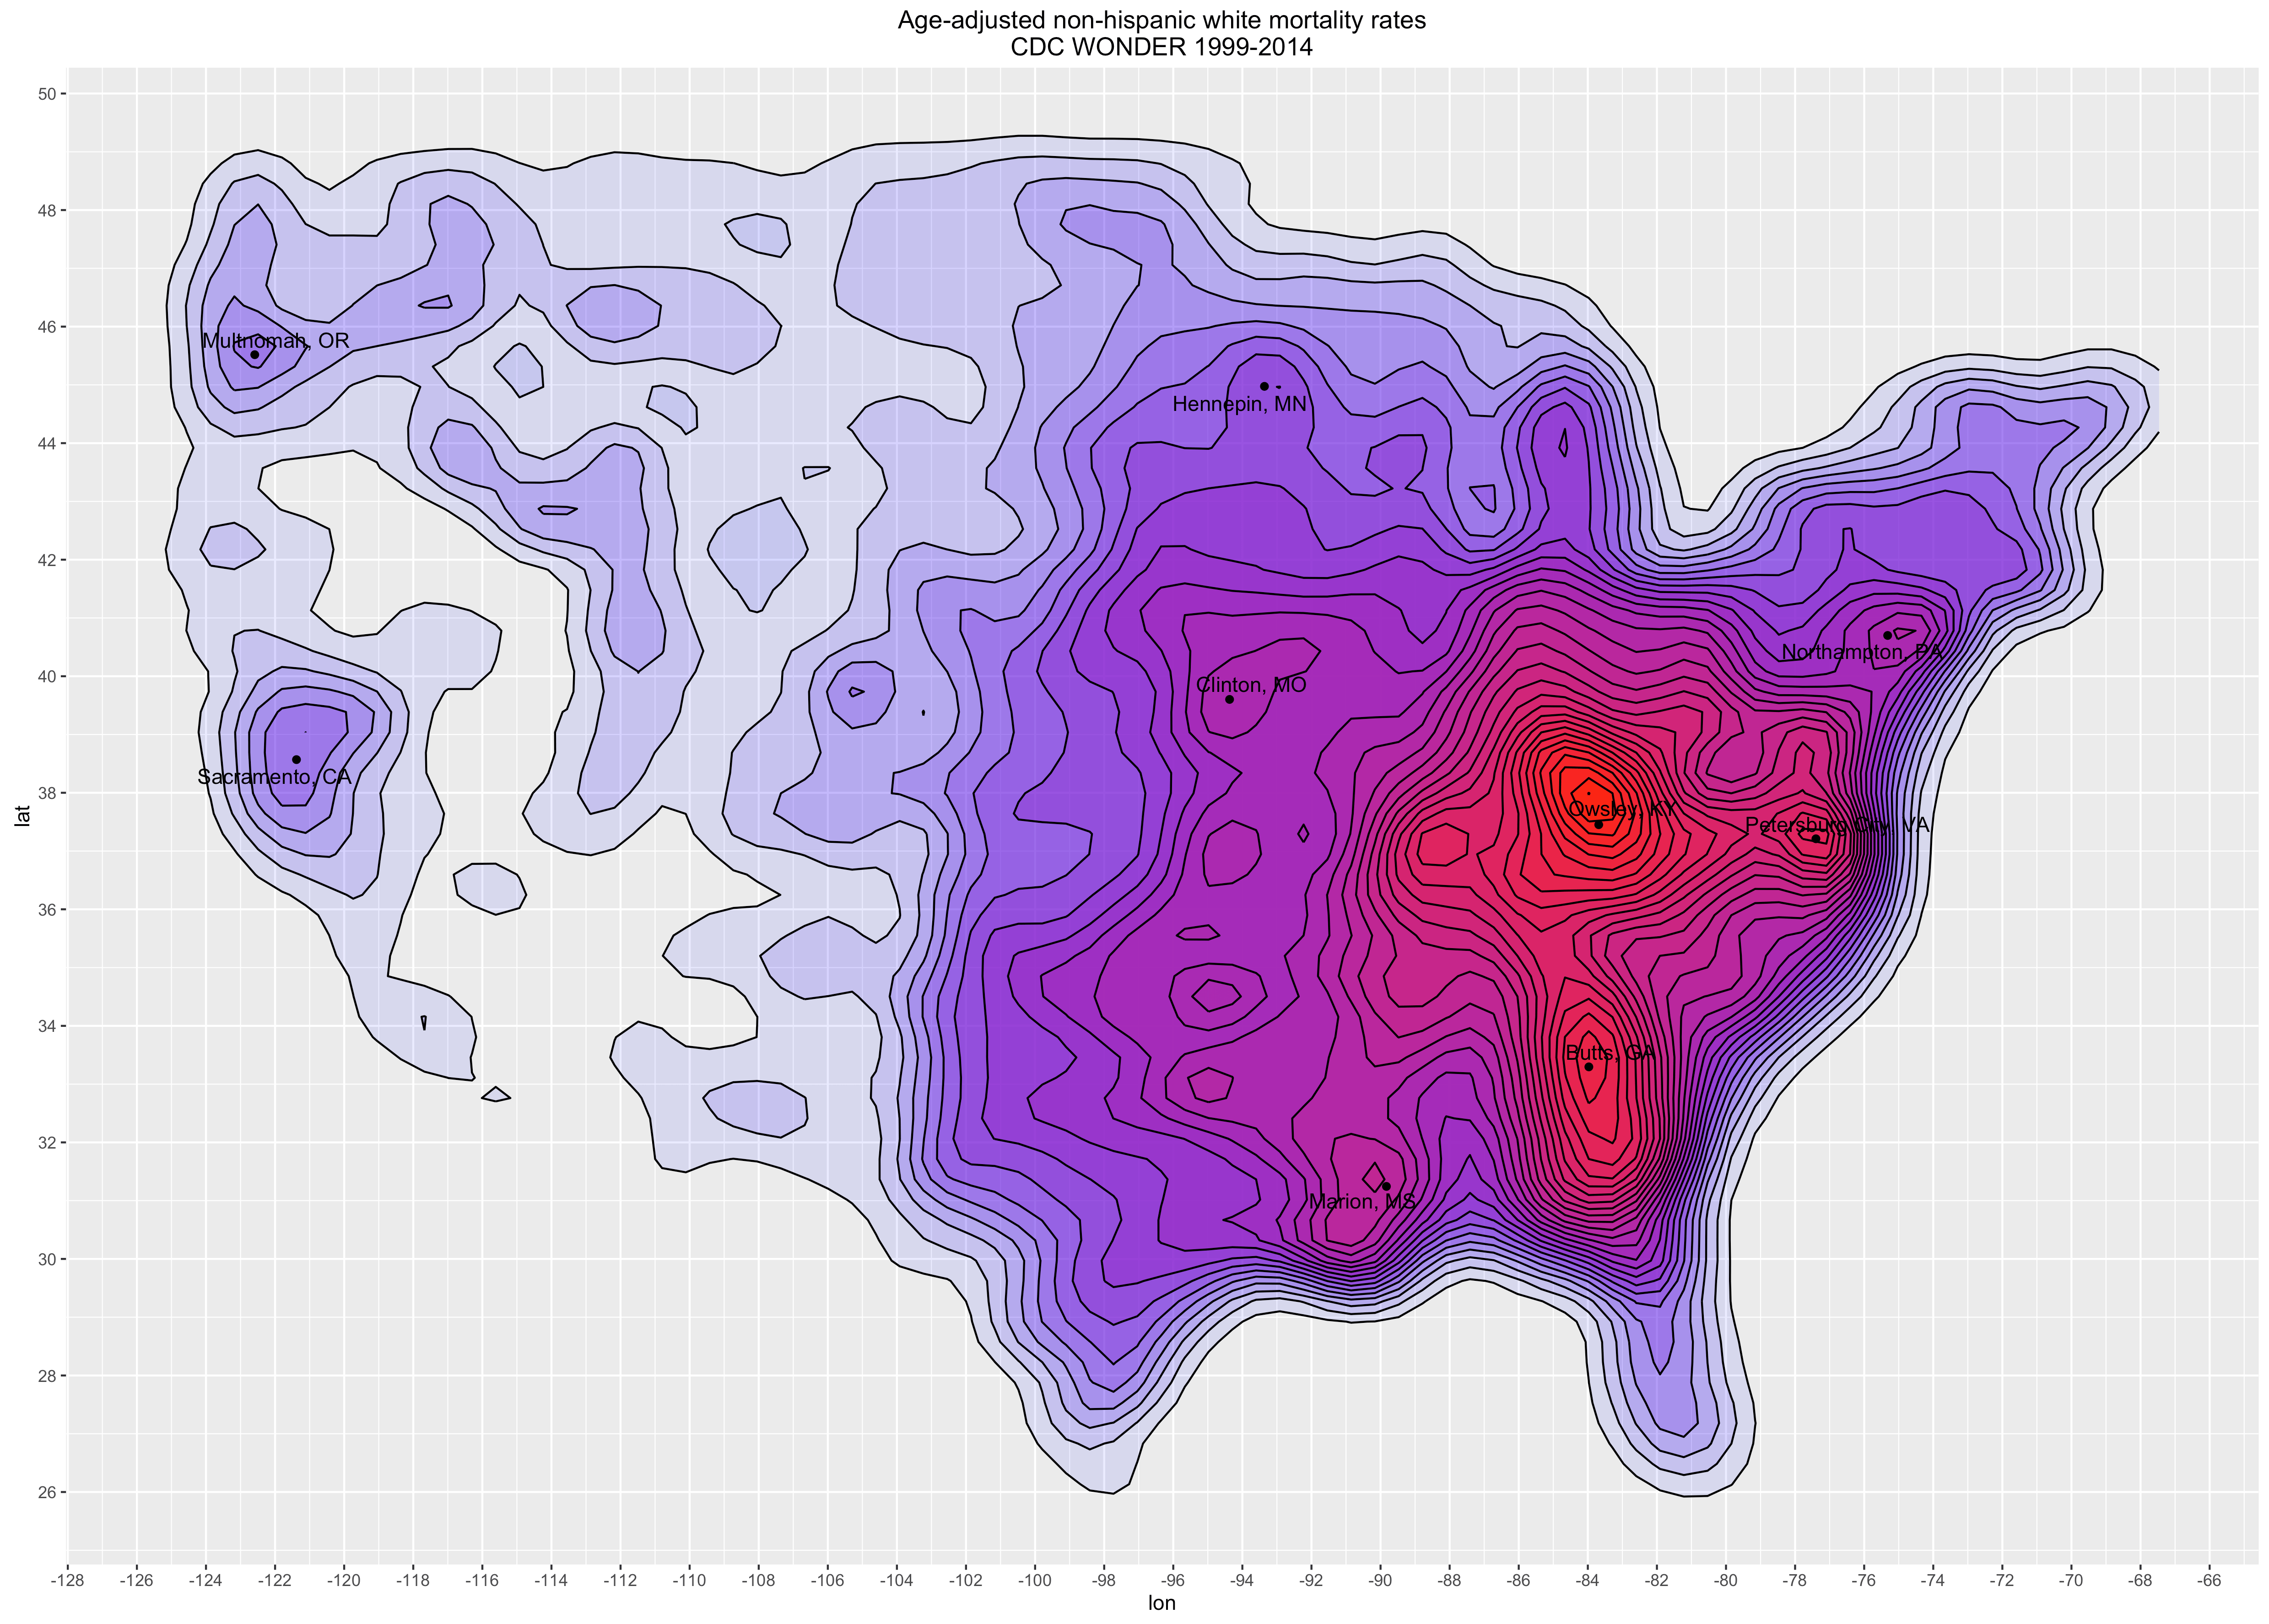
As you can probably see here there is a hot spot centered around Appalachia and inland deep/lower south. It’s mostly heavily skewed towards Appalachia though.
More coastal counties of the south, particularly those areas from Florida through Virginia, tend to look much more like the Northeast than what we associate with Appalachia or even the deep south.
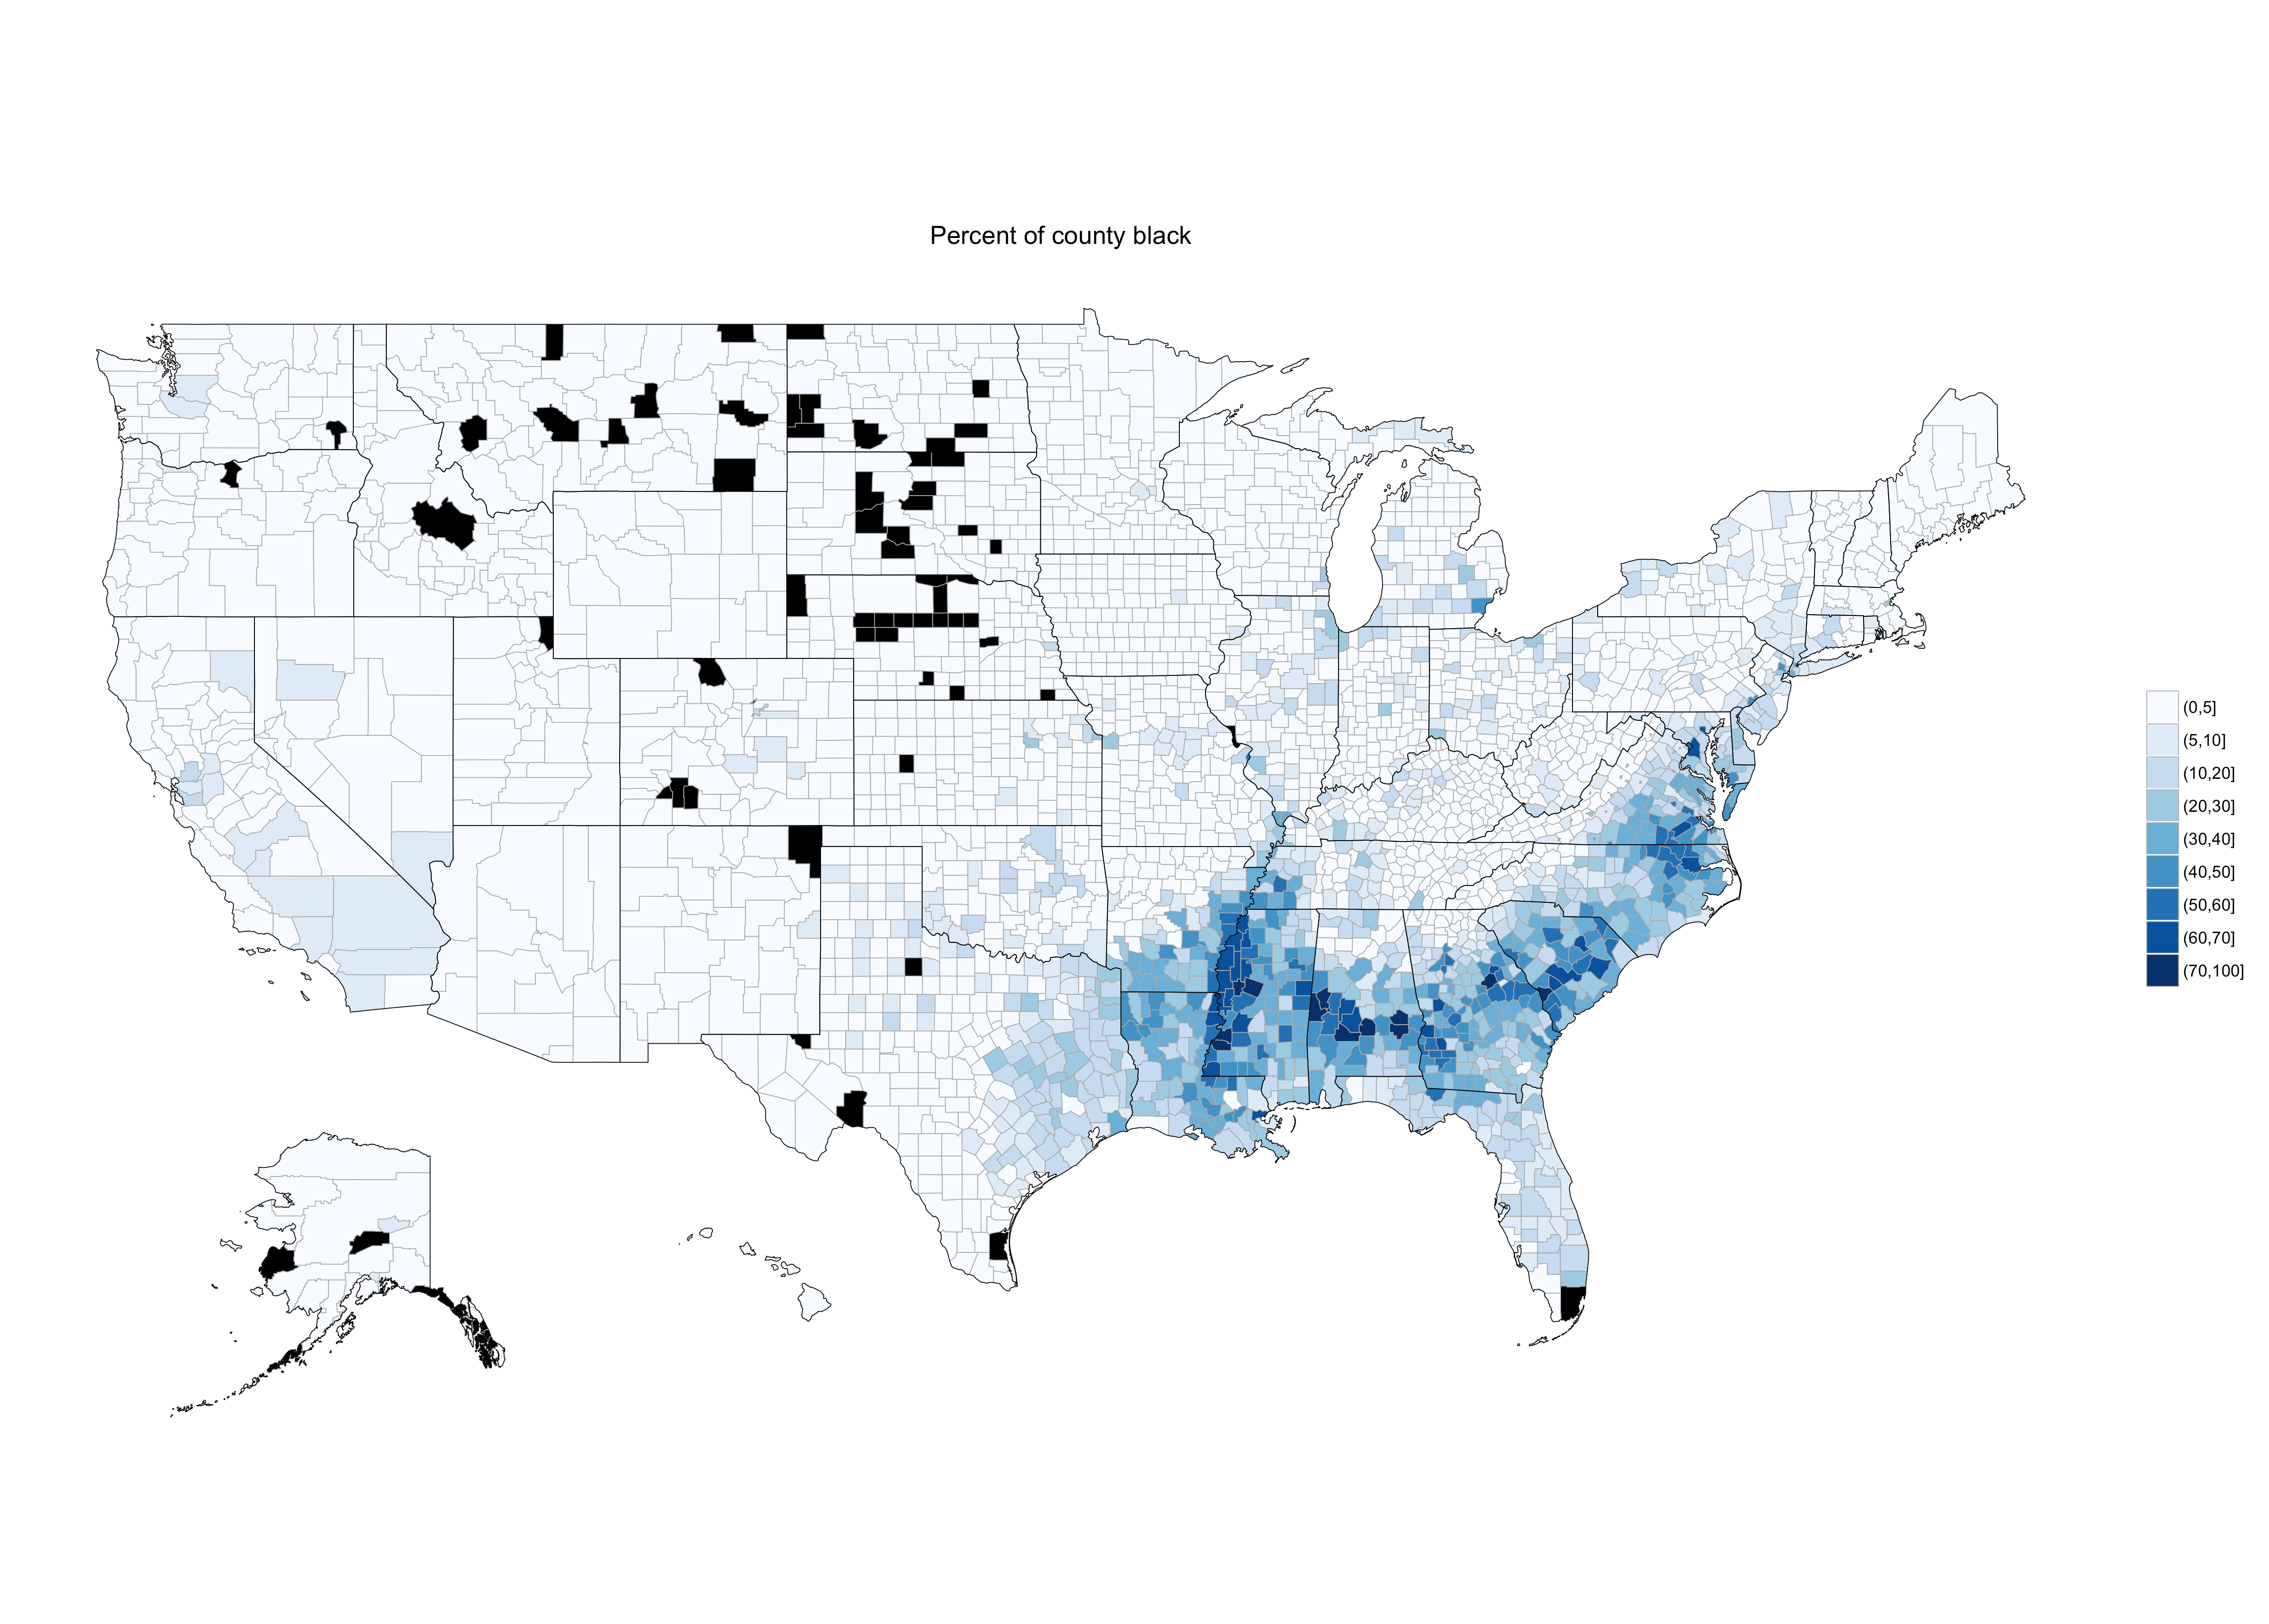
These modern black population distributions in the South are quite strongly correlated with slavery distributions back in 1860.

As for Appalachia, the “official” Appalachian counties go something like this:

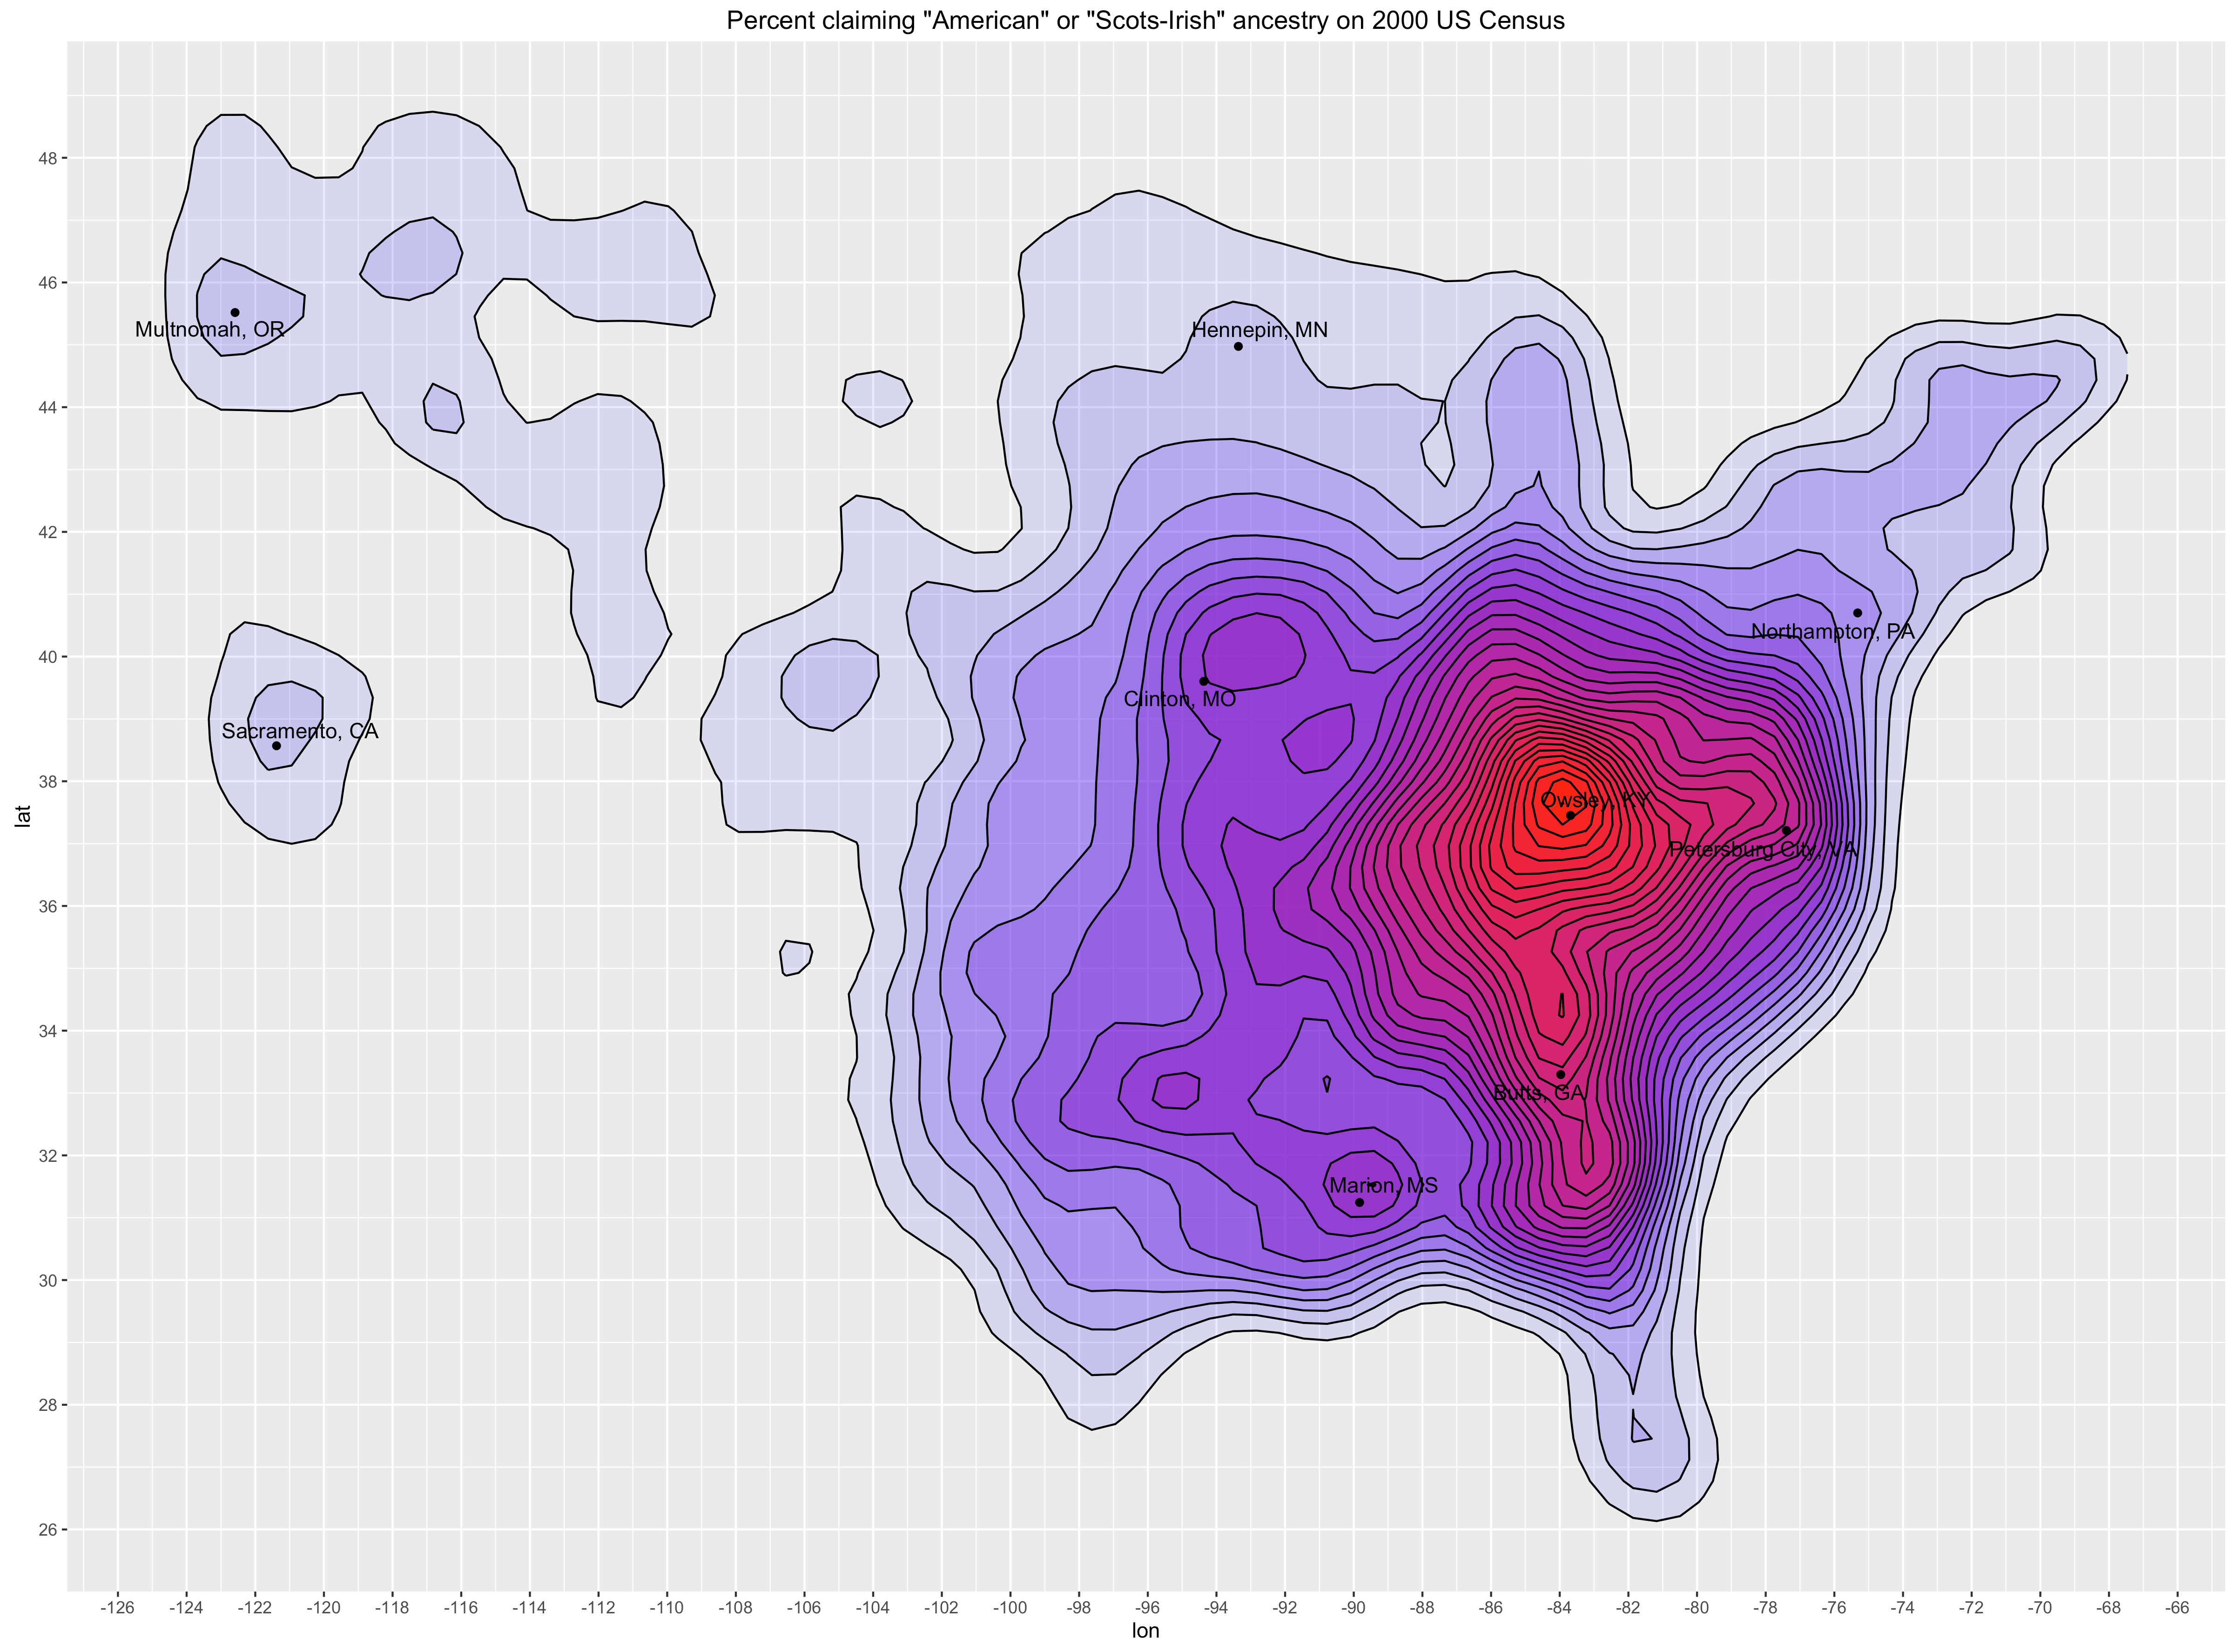
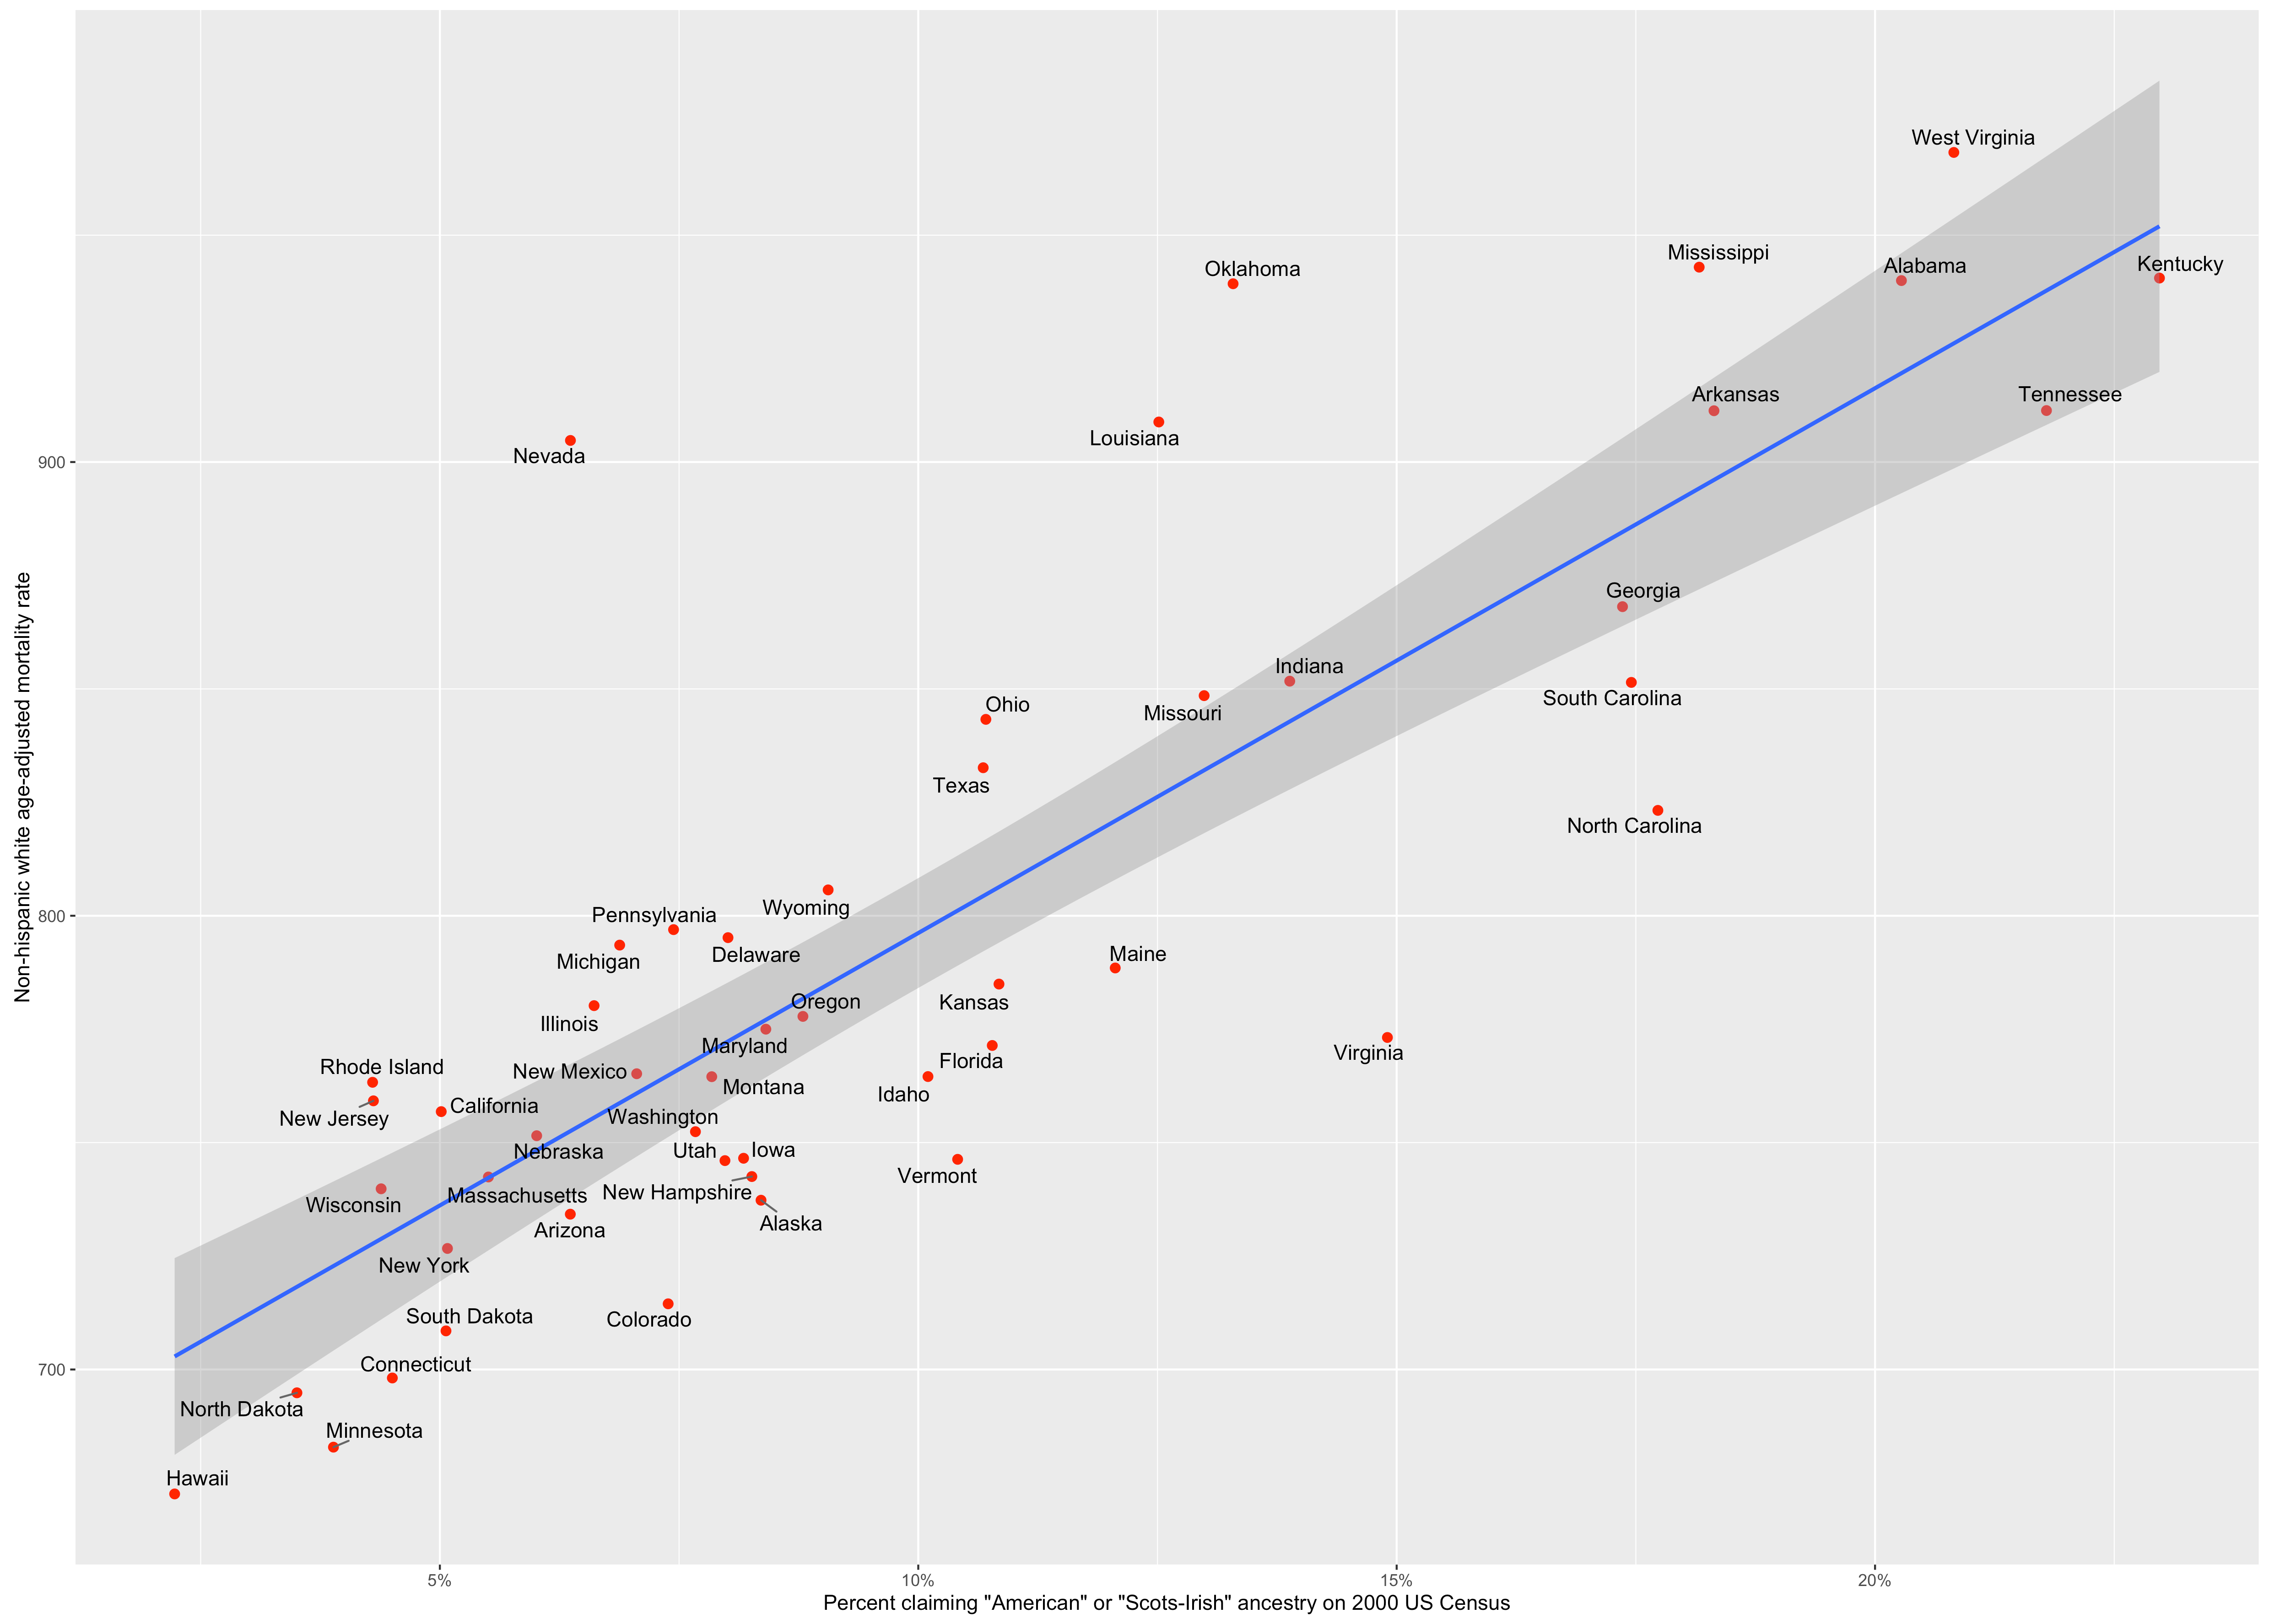
In part this is about place, but in my view it’s largely a proxy for Borderer/Scots-Irish population. A better proxy is percent claiming “American” or “Scots-Irish” ancestry on the US Census.  While maps are a useful way to help identify spatial patterns and generate hypotheses, this is a better way to show the actual associations:

We also find very similar patterns outside of Appalachia or states where these people are found in large numbers.

Even if we restrict this to Appalachian counties (per Appalachia Regional Commission) we find this predicts patterns between counties and mostly when we group by state too.
Moreover, even if we first control for white median income, white poverty rates, and un-insurance rates we find these spatial patterns are virtually identical. These covariates explain only part of the variance (~47% collectively) and do little to mediate these patterns (never mind the fact that this ancestry variable also predicts poverty, income, etc!)
Both are pretty much a map of where the borderers settled and how they dispersed subsequent to that (+/- measurement error / imperfect proxy):
Likewise, if I stick this directly into multi-regression (quasi-poisson) I find these variable both remain highly significant

This despite what is sure to be a large amount of measurement error associated with self-reported ancestry and its use as a proxy for this particular cultural group whereas income is pretty well measured and acts as a decent proxy for a number of significant behaviors itself. This is likely a significant under-estimate of the actual effects of ancestry here. You might also note that many of the regional rankings change quite dramatically once you account for these patterns (compare column 5 and 6). New England, Pacific, and South Atlantic divisions, in particular, look very different after we account for demographics.

Though I would not claim these estimates are divine truth, it definitely calls into question the notion that this is some kind of regional failure in health care provision since we find these patterns cut so clearly across regions, states, etc and estimates change quite dramatically with a few controls.
Further, even if we drop income, poverty, and insurance measures from the model and just use % black and % borderer, as in model 2 above, we find fair amount of consistency across regions.

That’s not to say these are the only factors that matter, far from it, but I would argue these can explain most of the very stark regional differences we observe.

Also these patterns correspond strongly to behavioral markers like lung cancer mortality rates (which also correspond to known rates of smoking, obesity, etc).


Smoking itself is surely a major culprit here, but this is also working as a proxy for a variety of other health behaviors too.
So it’s not very surprising when we find patterns like this:
Though the granular data on infant mortality rates (IMR) isn’t all that good (fewer observations and skewed towards big metro areas due to data censoring practices), we also find a significant correlation with borderer and IMR.


This would largely be mediated by obesity and the like, but these things aren’t unrelated.
Deep roots within the UK (major-source of US ancestry)
Though I don’t want to get too much in the weeds with the history of the Scots-Irish/Borderers (there are several books that dedicate much space to these topics and some free online resources), it’s worth pointing out that these people came from parts of the British Isles (far north of England & far south of Scotland hence “borderers”) that had similar characteristics vis-a-vis social development, mortality rates, etc.

source
Even to this day, despite the UK’s famed NHS and what is presumably a more generous welfare state, there are still large north/south differences in life expectancy and many of the more granular regions that these people’s ancestors came from are amongst the lowest today.

source

source
And here, too, behavioral factors seem to explain a great deal:
Many factors might plausibly determine the northern excess mortality, including socioeconomic, environmental (including working conditions), educational, epigenetic, and lifestyle, which may act over the whole life course, and possibly over generations. Statistics are available for region specific deaths attributable to smoking and alcohol consumption. Aggregation of these results into north and south shows that for 2004-6, 14.0% of the northern excess deaths for males and females were attributable to the difference in prevalence of smoking, and for 2005 the equivalent figure for alcohol was 3.5%. Such factors are particularly relevant to the worsening inequality in determinants of health among young adults. For men of working age (25-64 years), mortality data from 2001 to 2003 by socioeconomic group and region show the greater proportion of lower socioeconomic groups in the north (mortality in England increases from high to low socioeconomic group) and the greater mortality in the north compared with the south for each socioeconomic group, especially the lower groups
And many large differences are also found in”amenable” mortality categories:

source
The differences between the northern parts, especially in the border regions between England and Scotland, and the southern end, especially in and around London, are quite stark across a number of health metrics. According to Putterman and Weil “40.2% of those descended from the 1500 population of what’s now the United Kingdom live there today“, meaning that a large fraction of UK population almost certainly left between then and now, and some of them, especially the borderers, were likely negatively selected on law and order, economic development, and social development. The fact that these people were largely left to their own devices for generations if they settled in and around Appalachia (read: far removed from major agriculture, industry, and other major population centers) may have further widened these differences in social development (no, I don’t think it’s entirely genetic…. )
Oh, and by the way, the 2000 census estimates for american/scots-irish ancestry do correlate fairly well with the British/Irish estimates from 23andme amongst non-hispanic whites. 
So we can say this is probably a bit more than mere self-identification into said ancestry groups for people that happened to settle in these back-county parts. We also, unsurprisingly, find that these genetic measures correlate moderately with mortality.

But the correlation with our more direct borderer proxy is considerably stronger (not all people that emigrated from the British Isles were borderer, but the borderers all hailed from there and probably were somewhat more closely identified with 23andme’s derived British/Irish admixture group than several of those from other parts of the British Isles).
Smoking continues to play a major role in US life expectancy gaps
The United States had highest rates of smoking historically. This shouldn’t be surprising given its historic role in tobacco production internationally, not to mention wealth, previously mentioned issues pertaining to social capital, etc.

Evidence suggests historical rates of smoking are actually quite predictive of outcomes today, i.e., there is a long lag time associated with smoking and its cessation on mortality trends. Current smoking rates do not tell us everything we want to know and are probably actually less informative in the near term than what happened previously (though they do correlate to some degree)!
Brian Rostron, a mathematical statistician for the FDA, found smoking explains a large proportion of the gap in US life expectancy:
This analysis has used the PGW-R method to produce reliable estimates of smoking-attributable mortality and life expectancy in the absence of smoking-attributable mortality. The results have shown the increasing effect of smoking on life expectancy trends in developed countries during the second half of the twentieth century, first for males and then for females. The results also show that smoking is an important cause of observed mortality differences among these countries at the present time. For example, as shown in Table 3, the U.S. ranked toward the bottom of the 20 countries in observed e50 in 2003, at 14th for males and 17th for females. The PGW-R method estimates that the U.S. would have ranked much closer to the middle among these countries, at 10th for males and 12th for females (although close to tying four other countries), in the absence of smoking-attributable deaths.
source
Backing out smoking attributable deaths, both males and females at age 50 would have had 0.5-1 years higher life expectancy than their counterparts in the United Kingdom.

This method works by tracking lung cancer mortality between people that smoke at different intensity levels controlling for predictors like race/ethnicity, socioeconomic status, etc to determine the true rate of smoking prevalence in the broader population (where we have good data on lung cancer mortality) and then estimating its health impacts on a variety of other causes of mortality with that (smoking increases many risks, not just or even mostly lung cancer!). It appears to produce consistent estimates within and between countries and their estimates are generally consistent with those produced by the CDC (similar number of smoking attributable deaths), so I am inclined to trust them over much more haphazard estimates drawn from current smoking rate surveys.
I can sort of crudely approximate this method using IHME’s cause estimates and find a decent correlation amongst reasonably developed countries.

Keep in mind the US does much more screening for cancer, more intervention, and sees higher survival rates, so US is likely skewed considerably lower than the actual incidence rate of lung cancer or, especially, actual smoking rates/intensity (which is what we’re really trying to gauge).
Incidentally, black men smoked at significantly higher rates historically. The (near) convergence of self-reported smoking rates with white men may help explain why they have made so much progress recently.

The scope of these historical gaps may even be a significant under-estimation due to differential under-reporting of tobacco usage.
[back to top]
International obesity rate differences
Although it is possible to overstate the magnitude of the differences these days, there are clearly large differences in obesity and diabetes rates between the populations.

This US is about a decade or two ahead of Europe in obesity rates. This can significantly explained by differences in national wealth (especially AIC) and racial/ethnic differences, but it nonetheless is highly likely to contribute further, above and beyond historical smoking rates, to the United States’ depressed standing.
High SES groups in the US are on average about as unhealthy weight wise as low SES groups are in England (despite being much much richer)

It’s no wonder then that we find such large differences in cardiovascular risk between the US and most other developed countries.

These are substantial differences with major health implications for which the health industry has relatively few answers. Moreover in those categories where health care can help, most evidence suggests the US compares favorably to most of Europe (see: statins, bariatric surgery, etc).
Though I am leery of over-interpreting bivariate plots and though this method has some limitations due to not necessarily fully equatable measures (somewhat different life expectancy calculation, not standardized ages, and somewhat different years), this plot wherein I compare obesity rates and life expectancy for european countries (overall) and non-hispanic white life expectancy in various US states is at least highly suggestive.

Those few states where whites have obesity rates somewhat comparable to the european average see pretty similar life expectancy and those that are far beyond see much lower life expectancy.
There is non-linear, roughly U shaped, relationship between BMI and mortality

source
Ergo places with high obesity rates (BMI >=30) actually tip further into high risk territory than it might naively appear relative to developed countries (those with ample nutrition, clean water, good sanitation, etc) with comparatively low obesity rates today due to the fact that underweight status is actually quite rare and the relative risk increases the further to the right the population(s) shift.
These risks are also not isolated to just cardiovascular disease–many other mortality risks increase with it.


source
According to IHME‘s estimates, US metabolic risks are a major cause reduced life expectancy. They try to uniquely apportion this to many different specific causes, but this largely falls under the category of diet and lifestyle (obesity rates would be a strong proxy for these collectively)


source
Likewise, IHME’s behavioral risk categories also have US near the top (more years of life lost)

source
The point is people aren’t inexplicably dropping dead of heart attacks, diabetes, and related issues for reasons that can only plausibly be linked to deficiencies in the health care system. There are reasonable models to predict these risks across countries and these predictors generally point to substantially worse outcomes for the United States.
Homicides, suicides, auto accidents, and drug deaths
Besides the major metabolic/cardiovascular problems imposed by obesity and (historical) smoking, the United States life expectancy also suffers from substantially above average homicides, traffic deaths, and drug related deaths. I think most people can agree that these are mostly outside of the health systems’ reach and yet the US clearly does much worse than others.


source
If the risks for American males and females were equivalent to those of their English counterparts, even holding obesity, smoking, etc the same, their life expectancy would likely be about a year higher (which, btw, would put overall US life expectancy above Denmark). You can eyeball the relationship between age-standardized YLLs and life expectancy at birth like so:

Due to the fact that non-hispanic whites are more likely to live in rural areas and generally drive more miles per capita than average, the life expectancy impact is larger than average for them.

Non-hispanic whites likely bear a larger than average YLL burden in all categories here save for assault/homicides (note: other external causes = accidental poisonings/drug/alcohol overdose), so these categories surely have a pronounced impact when trying to make more “apples-to-apples” comparisons across countries.
Comparing outcomes and treatments in those areas least subject to lifestyle
Although comparisons of “amenable mortality” tend to be difficult to interpret due to strong influence of behavioral/lifestyle differences between countries, studies show that the US compares favorably in those areas that are least subject to lifestyle (certain cancers, certain communicable diseases, etc) and has demonstrated significantly greater than average progress in reduction of mortality from those diseases.
We have demonstrated that mortality reductions from prostate cancer and breast cancer have been exceptionally rapid in the United States relative to a set of peer countries. We have argued that these unusually rapid declines are attributable to wider screening and more aggressive treatment of these diseases in the US. It appears that the US medical care system has worked effectively to reduce mortality from these important causes of death.
This conclusion is consistent with other evidence that we have reviewed on the performance of the US health care system: screening for other cancers also appears unusually extensive; 5-year survival rates from all of the major cancers are very favorable; survival rates following heart attack and stroke are also favorable (although one-year survival rates following stroke are not above average); the proportion of people with elevated blood pressure or cholesterol levels who are receiving medication is well above European standards
These performance indicators pertain primarily to what happens after a disease has developed. It is possible that the US health care system performs poorly in preventing disease in the first place. Unfortunately, there are no satisfactory international comparisons of disease incidence. Individuals report a higher prevalence of cancer and cardiovascular disease in the United States than in Europe, and biomarkers confirm the higher prevalence of many disease syndromes in the US compared to England and Wales. Higher disease prevalence is prima facie evidence of higher disease incidence, although it could also be produced by better identification (e.g., through screening programs) or better survival. The history of exceptionally heavy smoking in the US, and the more recent massive increase in obesity, suggest that a high disease incidence in the US could not be laid entirely at the feet of the health care system.
[snip] Just as we are not addressing issues of efficiency on the production side, we are not treating patient welfare as the main outcome. Practices that produce greater longevity do not necessarily enhance well-being. This potential disparity is central to the controversy involving PSA testing, which uncovers many cancers that would never kill patients but whose treatment often produces adverse side effects.The question that we have posed is much simpler: does a poor performance by the US health care system account for the low international ranking of longevity in the US? Our answer is, “no”.
source


Comparing US to its northern neighbor
Canada is a natural comparison due to its proximity and greater similarity in some dimensions.
In this paper we focus on three questions: (1) What does the evidence show regarding differences in health status that can be attributed to the two systems?; (2) How does access to needed health care resources compare between the two countries?; and (3) Is inequality in access to resources different in the two countries? In other words, what do the data show about differences in the health/income gradient between the two countries?
[snip] Briefly, our findings are: No significant differences are evident in the four health status indicators available in the JCUSH data; A somewhat greater incidence of chronic health conditions in the U.S. combined with evidence of greater access to health treatments in the U.S.; greater access in the U.S. to important health care resources and no evidence that the income/health gradient is any different between the U.S. and Canada. Finally, on two questions asked about satisfaction with health services and the ranking of the quality of services recently received, more U.S. residents than Canadians answered fully satisfied and excellent.
source
US is significantly fatter than Canada.

Americans typically get crucial treatment at similar or greater rates (which is still influenced by some of issues I mentioned above vis-a-vis compliance, following up with physicians, etc)

IMR by birthweight are very similar and, if anything, US has a significant advantage in the under-weight/pre-term categories (which shouldn’t be surprising!)

Accidents, homicides, and heart disease (which goes to obesity, smoking, race/ethnicity, etc) explain a very large proportion of the gaps across most age groups.

Access to mental health services looks quite similar.

Canada looks to be slightly better in the unmet needs category for the non-elderly set, but the differences are pretty modest (“free” medicine isn’t a silver bullet for these types of issues).

Income is no less predictive of health in Canada

All of this tends to suggest that differences in health systems, especially narrowly vis-a-vis health financing, plays little role in the differences between US and Canadian health outcomes.
Socioeconomic gradients within countries
There are and have long been large socioeconomic gradients in mortality, life expectancy, etc across multiple causes of death in Europe despite their commitment of equal health care.

source


source
In fact, these gaps tend to be substantially larger in Northern Europe (Norway, Sweden, UK, etc) than Southern Europe.


And these gaps have generally widened with time:
Mortality differences between socio-economic groups have widened considerably in many high income countries during the last four decades (Mackenbach et al. 2003; Krieger et al., 2008; Shkolnikov et al., 2012). For relative inequalities, i.e. inequalities measured as a ratio of the mortality rates in lower as compared to higher socioeconomic groups, this widening has been observed in all countries with available data. On the other hand, absolute inequalities, i.e. inequalities measured as a difference of the mortality rates comparing lower and higher socioeconomic groups, have shown a more variable picture, declining in some countries and increasing in others. For example, among Finnish men the Rate Ratio comparing the low and high educated increased from 1.97 in the early 1990s to 2.08 in the early 2000s, while the Rate Difference declined from 639 to 564 deaths per 100,000 (Mackenbach et al., 2015). In most Western European countries, the widening of relative inequalities is the result of a difference between socioeconomic groups in the speed of mortality decline. While mortality declined in all socio-economic groups, the decline has been faster, in percentage terms, in the higher socioeconomic groups than in the lower ones. These faster mortality declines in higher socioeconomic groups were in turn mostly due to faster mortality declines for cardiovascular diseases and diseases amenable to medical intervention (Mackenbach et al., 2015).
Even if we limit this to so-called (health care) “amenable mortality” similar gaps are found:

source
In fact, contrary to this “amenable” notion, they found no indication that these amenable categories are significantly more correlated with inequities in health care use (which surely correlate with other differences) than non-amenable causes!
In most countries and for most amenable causes of death substantial inequalities in mortality were observed, but inequalities in mortality from amenable causes did not vary between countries in patterns that could be distinguished from those seen for inequalities in non-amenable mortality. More specifically, our hypothesis that, as compared to non-amenable causes, inequalities in mortality from amenable causes are more strongly associated with inequalities in health care use and less strongly with inequalities in common risk factors for disease such as smoking, was not supported by the data. Inequalities in mortality from amenable causes are larger in countries with larger inequalities in visits to any doctor, but so are inequalities from non-amenable causes. And just like inequalities in mortality from non-amenable causes, inequalities in mortality from amenable conditions also tended to be larger in countries where inequalities in smoking, smoking-related deaths and alcohol-related deaths were larger.
Moreover, it appears as if the SES gap measured with education is not that much larger in the US than it is in Europe

source
This likely overstates the relative size of the US education gap because many more people have attained nominal education (those in low education bins are a much smaller % of population, i.e., ergo they are negatively selected to a much greater degree in the US than their nominal counterparts in much of Europe).
In any event, my points here are:
- National or “free” health care has clearly not eliminated large systematic disparities associated with SES.
- There is ample evidence that lifestyle is substantially driving these differences in the rest of the developed world too (smoking, obesity, drug overdoses, etc)
- Evidence suggests US SES gaps are not that much larger than what is found in other developed countries (especially if you account for the large grain spatial/regional component)
- The US shortfall in life expectancy is mostly explained by a general downward shift in the intercept for all SES levels (see obesity/other health markers and mortality rate data)
All of this tends to implicate things that largely occur outside the health care system (lifestyle, broad national affluence, etc). If the presumed source of european advantage in life expectancy were the result of the very modest resources they allocate towards “preventative medicine”, do you really, truly, believe higher income people in the US would not demand and get similar services with their much higher expenditures levels? I find that to be highly unlikely! If, say, Europe had any real medical solutions to the obesity epidemic (evidence aside!) there would be a massive market in the US for aesthetic reasons, if nothing else.
IMR differences between countries
Infant mortality rate (IMR) differences are often held up as a smoking gun for the failure of the US health system. Closer inspection, however, shows that the actual gap has little to do with the health system.
First: there really are significant differences in how different countries track and report IMR (e.g., what US calls a live birth is not in several countries) and this tends to significantly inflate US IMR relative to many other countries.
Past literature (notably MacDorman and Mathews (2009)) has addressed this concern by limiting the sample to infants born after 22 weeks of gestation. Although previous literature has largely focused on the fact that this restriction does not substantially change the rank of the US IMR relative to other countries, it is nonetheless quite quantitatively important. This can be seen by comparing the first and second bars for Austria and Finland in Figure 1. The first bar shows the excess deaths in the US relative to other countries in the full sample. The second bar limits to infants born at or after 22 weeks of gestation. The US disadvantage declines once we impose this additional restriction. Our data allow us to address two related issues which prior literature has not explored. First, many countries also have reporting requirements related to birth weight and may not report infants under 500 grams as live births (MacDorman and Mathews 2009). Second, the presence of assisted reproductive technologies has increased the frequency of multiple births, which have higher mortality rates. Because the use of assisted reproductive technologies is a choice that we need not aim to fix via changes in policy or behavior, it seems appropriate to limit the sample to singleton births. The third column within each country in Figure 1 adds both of these sample restrictions. Adding these restrictions we are also able to look at the comparison with the UK and Belgium. The US disadvantage shrinks further with these additional restrictions. Overall, limiting to a sample of singleton births at birth weights and gestational ages where reporting is not a concern reduces the excess US infant mortality in both magnitude and share terms.
source
If you make more of an apples-to-apples comparison, the US gap is substantially reduced as compared to many.

Likewise, another micro-data study found no significant gap between US and Canada adjusting for birthweight
Second: the evidence suggests these gaps are largely attributable to pre-neonatal conditions and post-neonatal conditions weeks or months after leaving the hospital. As compared to other highly developed countries US mothers conceive in substantially worse health (see: obesity, diabetes, smoking, activity levels, etc) and are substantially more likely to see their children die a month or more after delivery. In other words, the gaps are largest the further the mother/child are away from the health care system in the US.
Note: Scandinavia, including Finland, has the lowest IMR amongst OECD countries (gaps with other countries tend to be smaller)
Pre-term IMR is actually significantly lower in the US (which is most likely a result of state of the art NICU and greater experience dealing with complications resulting from a sicker population)

source
In fact, if we use the OECD’s perinatal mortality rate measure, which is “the ratio of deaths of children within one week of birth (early neonatal deaths) plus foetal deaths of minimum gestation period 28 weeks or minimum foetal weight of 1000g, expressed per 1000 births“, which reduces the influence of unhealthy maternal conditions (via pre-term reduction and low-birth weight) and reduces deaths that largely occur after most mothers and babies are discharged as compared to IMR (within 1 year of birth), the US appears to compare reasonably well with several highly developed countries with national health systems.

Third: The US faces a much higher than average rate of pre-term and low-birthweight births. This can be expected to increase IMR dramatically.


Four: The US mothers are substantially higher risk in several dimensions: obesity, drugs, smoking, STDs, age (teenage mothers & delayed childbirth), etc.
Where health care expenditures per capita does not correlate negatively with IMR amongst the developed OECD countries
Predictors like the overall female obesity rate actually do correlate.

Likewise for adolescent (teen) fertility

Keep in mind that we’re talking about fractions of a percent of live births here, e.g., moving from current US IMR to, say, Finland IMR is less than a 0.4 percentage point difference in live births. Even modest differences in maternal/household characteristics (risk-factors) can move this indicator quite a bit.
Five: Overall US IMR significantly increased by blacks (both significant % of population AND much higher IMR).

Differences of this nature are (1) not well explained by SES, (2) are found internationally and (3) are not likely to be explained by income, insurance status, etc in the US either.
Six: The similar strong patterns are observed vis-a-vis south, Appalachia, etc. IMR is generally strongly correlated with non-infant mortality so this isn’t very surprising.
Seven: Obesity, smoking, activity, racial demographics, etc are significantly correlated with IMR at a county level. Meanwhile indicators of health system access suggest these explain very little of the variance (not even in the “right” direction with controls!)

All of this tends to point away from the health system and rather strongly towards lifestyle/choices (diet, smoking, drug use, teenage mothers, IVF, etc) and some probable genetic differences between groups vis-a-vis risk of pre-term, low-birth weight, SIDS, etc. This does not necessarily mean that the health system is totally impotent to mitigate some of these problems or save lives once the die is already cast, but differences in health provision are unlikely to be the origin of these IMR differences in the first place.
A brief rant on critics arguments
I would have much more respect for critics’ arguments if they could supply specific mechanisms for failure and objective empirical evidence to this effect. Unfortunately most of those claiming the US system is the source of these problems are unable to substantiate their claims and are otherwise unresponsive to a wide variety of evidence. Sure, they make noises about market failure, but when you get down to it their argument is little more than theory and the fact that the US sees worse results. As I have already pointed out though there is good reasons to expect to US to lag here (lifestyle, behavior, genetics, etc). In those areas that are least susceptible to lifestyle/behavioral problems the US typically does pretty well. Alternatively, you attempt grade with something more akin to value-add based on, say, population behavioral risk, actual cancer rates, obesity, heart disease, pre-term pregnancies, etc the US also does about as well as can be reasonably expected. Ask them sometime how the standard of care actually differs in the US for, say, heart disease. Where is the evidence suggesting the treatment is not only poor ROI in QALY terms (something I’d expect to find in any high HCE regime) but is actually so much less effective than than modal treatment plans in other rich countries as to even begin to explain these gaps? How do they respond to the evidence that the US actually treats these major health issues more aggressively than most (though still similarly and in line with the literature)? Why is that US performance in specific categories does not correlate with actual observed association between health inputs and outcomes in other rich countries? If health provision is still such a great marginal influence, why is it that there is essentially no correlation between rich countries’ HCE and overall outcomes today?
If the main problem in the US is instead lack of access or affordability instead, why do we find insurance status and other indicators of health system access predict precisely nothing vis-a-vis life expectancy, mortality rates, etc? Why have several experiments failed to detect such a presumably large signal? Why do we find these poor outcomes are largely confined to a few specific areas of the country and are associated with particular groups of people (even with controls for income, insurance status, health system access, etc)? Why do several low-income minority groups outlive not only affluent whites in the United States but also the averages observed in much of Europe by a wide margin? If nationalized health insurance is supposed to close socioeconomic gaps, why then do we also find large socioeconomic gaps in practically every developed countries, especially in UK/Northern Europe? Why have these gaps grown with time? If their argument is essentially “behavior”, how can they then deny evidence that US has worse indicators here or, alternatively, expect the US to somehow magically offset these sorts of issues to produce outcomes comparable to people with less risky lifestyles? Why assume the populations of countries are essentially perfect substitutes for one another? Why ignore evidence that the US looks different in so many other dimensions as well? Why not acknowledge that obesity, diabetes, etc have been increasing pretty much everywhere, that it’s quite well predicted by national wealth, and that we should probably expect the US to have more issues, other things being equal (which they’re not), given that it’s a very rich country.
I am not claiming the US system is perfect. There is room for improvement. No doubt other countries do some things better than the United States (and vice versa). Certainly a great deal of additional US spending isn’t likely to produce substantial effects on life expectancy, mortality, etc, but I would pretty much expect this given diminishing marginal returns and the patterns observed in other countries too ( correlation <= ~0 preceded by a strong secular trend of declining strength even in bivariate specifications). Even granting these arguments as essentially correct that does not mean that the health system is a substantial contributor to sub-par life expectancy or that US spending is out of line with what we would expect given its material living conditions, i.e., the cause of extra spending has little to do with how it is financed or managed and almost everything to do with the fact that it’s a rich country and the fact that most rich countries behave pretty similarly.
Conclusion
The United States is a heterogeneous country that dramatically economically outperforms its mean indicators of social development, traits that are significantly endogenous with respect to current health expenditures (or even other social programs…. at least in the near term). This leads to a combination of high health expenditures relative to outcomes because expenditures are strongly determined by material living conditions (AIC) and, amongst the developed world recently, the population level differences in life expectancy are mostly determined by lifestyle and health behaviors today, not health provision and not even wealth per se. It is actually quite likely that the average marginal effect of wealth is a negative amongst the most developed countries today due to the combination of rapidly diminishing marginal returns in health expenditures (and other inputs influenced by national wealth, e.g., sanitation) and downsides of national affluence through its effects on diet, activity levels, drug use, and the like.
The role of health care in determining life expectancy and other broad measures of health within and between countries in the developed world is vastly overstated. We cannot even reliably detect its effects amongst the leading OECD countries over the past couple years in crude bivariate analysis (and this clearly followed a secular trend of decline). Within the United States there is very little indication that health access contributes significantly to observed variation (which is very large indeed). Even amongst less developed countries there are good indications that it is determined by a hell of a lot more than health provision (see how deep history measures, cognitive ability, etc mediate much of the effect). Controlling for so much as Actual Individual Consumption (AIC) entirely-to-mostly mediates the apparent effect of health care expenditures (depending on the precise countries, time span, model specification, etc…. still usually very modest). The actual independent causal contribution of health provision is surely much smaller than these plots would have you believe.
Most data on health outcomes that are presumably “amenable”, “avoidable”, etc vis-a-vis health care provision show little sign that it varies systematically from presumed non-amenable causes of death within and between developed countries. We also don’t see any indication that the United States does worse in those mortality causes that are most correlated with observable health inputs (expenditures, primary care physicians per capita, etc), which we would expect if the source of US under-performance were inferior health provision. The US gaps in health outcomes are quite well explained by behaviors (or at least indicators there of) related to diet and lifestyle. The US lags across a wide number of risk indicators:
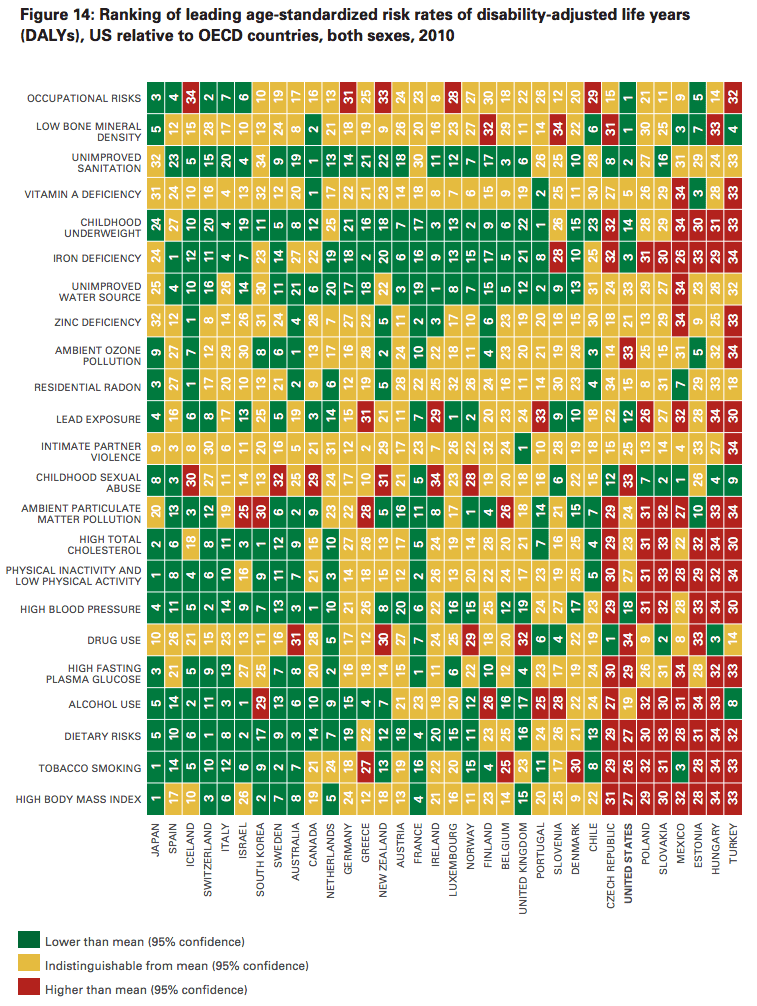
There is very little reason to think that the health system is significantly responsible for these patterns. For instance, the health system does not have effective non-surgical treatments for obesity and, if anything, the US does more to deal with this and its consequences than most (and even still we’re talking about partial mitigation–not the same as not having the condition in the first place!). The fact that we find similar obesity patterns amongst high SES in the US, who are extremely rich by practically any historical or international comparison, should further call into question the received wisdom that this is explained by preventative medicine or some such. That we also find large disparities within and between anglo/european countries in these “amenable” measures argues rather strongly that the health system has few tools at its disposal to change these sorts of behaviors (i.e., over and above increasing awareness that smoking kills you, obesity shortens lifespans, etc). We can at least say that equalizing access to health care and removing financial concerns does little to close SES gaps in other countries (it’s almost as if things that happen outside the health system matter!). Furthermore, not just repeated multi-variate analyses but actual experiments within the US show that increasing access to health care, even amongst those that should presumably most benefit (the poor, the uninsured, etc), has virtually no detectable effect on mortality or predictors of it (blood pressure, hba1c, etc).
We also know that there are large differences in homicides, car accidents, drug overdose deaths, and the like, that controlling for these alone can bring the US much more inline with N/W Europe, and that they have little to do with preventative medicine and things of that sort. Likewise, we know the US had much higher smoking rates than most of Europe and that these are likely to drive US mortality up across multiple causes of death (not just lung cancer!). There are several major causes that contribute (diet, smoking, activity, drug use, car accidents, etc) and largely account for the shortfall, but it is “death by a thousand cuts” to large extent that prevent US from achieving the highest life expectancy–lots of mortality rates across many different causes are significantly elevated relative to most developed countries, even those that are evidence suggests are unlikely to be explained by medicine. Many of these sources of extra mortality are substantially connected to social development, not to mention negative income effects (see: historical smoking, obesity, diabetes, etc), geography, and other factors that exist well outside the health systems, but mostly they pivot around human capital.
We know that the United States has distinctive demographics and distinctive geography relative to most highly developed countries. US excess mortality is highly spatially concentrated. Some groups and some parts of the country live much longer than others or, rather, there is a cluster that is distinctively far below naive expectations with other parts mostly being in the ball-park of other developed OECD countries. Non-hispanic whites outside of the South and areas in and around Appalachia live about as long as europeans in the most developed countries despite the fact that they’re also significantly more likely to be obese thanks, in large part, to history and national wealth. There is little to no sign that health care substantially explains these patterns as controlling for health care provision in multiple respects does practically nothing to close these gaps and electing to get regular checkups and the like is significantly self-selecting in the first place (even when financial considerations are largely removed). Furthermore, the evidence suggests this largely follows people— not places.
It does not much obey state lines and the like as you would probably expect if policy were driving this (state licensure, insurance companies operating within states, hospital systems, etc etc). Much of what we associate with the South or Appalachia vis-a-vis mortality and behaviors is found to be very similar in far removed places that happen to share these same crude demographic indicators, namely, percent of county Borderer/Scots-Irish and percent of county black (african american). Conversely, much of what we associate with the New England, Pacific Coast, and Upper Midwest (MN, WI, etc) is found in the South, Appalachia, etc when these same two demographic indicators more closely resemble these other more socially developed parts of the country. We find large effects even if we confine our analysis to non-hispanic whites and even with controls for income, poverty, health system access, and more. That we also find similar patterns historically in place/country of origin and currently in other countries further supports the view that this has much less to do with health policy than many would like to believe. In short, there is very good cause to believe that people, not health systems, are driving these differences. These problems are largely endogenous.
No doubt one could control away some of these patterns associated with percent black and percent borderers (“scots-irish”) by adding more controls, above and beyond actual economic characteristics, like education, occupation, family formation, and so on and so forth. With enough controls all groups can be made look almost identical in pretty much any dimensions you might choose. None of this is inconsistent with arguments here though. It is not that blacks or borderers are individually necessarily lacking in social development (I can name a number of individuals and even some particular neighborhoods that defy these stereotypes), but that there are a host of behaviors that have long been stubbornly associated with them collectively. They are generally not well explained by actual income, poverty, insurance status, and the like, i.e., they are probably substantially cultural or, at least, are very hard to disentangle from it today.
Although I am certainly receptive to the mounting evidence that genetic differences can cause large differences in health outcomes and may explain at least some of these group differences (race/ethnicity, specific european ancestry, SES, etc), it also seems highly likely that most of these differences are channeled through behavior (diet, lifestyle, etc) and that culture can have a large influence here (which we don’t really find with, say, general cognitive ability). These behaviors are bound to have substantial spillover effects beyond the individual, the family, or even immediate neighbors through its effects on schools, crime, traffic, cuisine, and more. These effects almost certainly flow both ways. This makes them very difficult to begin to solve or even discuss in polite company today. Blacks influence whites; whites influence blacks; borders influence non-borderers; rich -> poor; poor -> rich and so on and so forth.
It is simply not true that the better ordered community will exclusively affect the less ordered community for the better. If anything it’s likely much harder to create order and social harmony than it is to destroy it. Further complicating these matters is that there is not necessarily a single objectively correct behavior. Some behaviors that may extend life expectancy may also make life less worth living for others. Even if people can agree in principle that they wish to optimize for life expectancy, different people have different ideas about how to do that and how much they are actually willing to give up to get there (think: revealed preferences). There is still not widespread agreement on what constitutes healthy food, at least not beyond some broad strokes, but I strongly suspect banning tobacco entirely and placing a massive tax on food, especially convenient and calorically dense foods, would go a long way to improve life expectancy, health, etc. Problems like crime/related social disorder might in principle be amenable to solutions and may yet yield large gains in life expectancy, both directly (less mortality/injury contributing to mortality) and indirectly (less stress, greater social cohesion, etc), but it’s not as if we are only concerned with these narrow outcomes (issues of disparate impact and the like are constantly cropping up!).
In any event, these are difficult problems to solve and they are largely problems that the most developed countries outside of the United States have much less experience with, not at this scale and not of this nature, and what little evidence does exist here is mostly not very encouraging. Diversity in general is not always easy. Diversity with groups of individuals of substantially different levels of social development is tougher (it’s conditional on how selected the particular individuals are from those groups). And the multi-generational implications are quite different than what is found in the first/second generations (in many respects recent immigrants tend to be on their best behavior….. it doesn’t necessarily carry on over to the 2nd and 3rd generations).
Postscript
P.S., Though I argue in this blog post that the regional and group differences are not well explained by differences in income, poverty, health system access, and so on, I do believe some of these problems (especially with respect to the recent drug epidemic) are substantially aggravated by broader macro-economic forces (the decline of industries that provided employment and a sense of purpose for people in some of these regions combined with domestic competition from low skill, but hard working, immigrants in occupations like construction). These issues are at least as much social as they are economic though. I do not believe that even perfectly matching cash transfers are a good replacement for the combined effects of the same earned income within these communities and, to some degree, transfers can even make these problems worse (reduces need to find work, to stay married, etc). The sense of purpose, social status, and discipline related to having regular work is important at the individual level (it’s not just about the ability to consume) and it is even more important at a community level (externalities with thousands of similarly situated people, especially men, and behaviors resulting from that). A topic for another day perhaps.
Figure 14 is brilliant. Severe mental illness as a risk factor has been shown to reduce life expectancy by 25 years. Depression, bipolar disorder, alcohol and drug problems are some of the leading disabilities in the world according to WHO.
Interesting analysis. I’d be interested to read a response by a health care-specialized economist. I wonder if having health insurance (or easy access to decent health care) changes behavior. Perhaps people make better life choices when they meet with a doctor a couple times a year.
The RAND study didn’t show any effect of cost sharing on risky behavior.
I notice that you compare health outcomes for the Amish population in the US but it’s a shame that you didn’t include studies of the Seventh Day Adventists, a church dedicated to healthy living that runs a number of hospitals. The men seem to live an average 7 years longer according to long term studies.
https://en.wikipedia.org/wiki/Adventist_Health_Studies
Thank you for the huge amount of data and in most cases well presented arguments.
As scientist I have only a few minor issues with your interpretation of your data.
“We also know that there are large differences in homicides, car accidents, drug overdose deaths, and the like, that controlling for these alone can bring the US much more inline with N/W Europe, and that they have little to do with preventative medicine and things of that sort.”
Death by drug overdose in the USA often starts with prescription drugs. In countries like Austria or Germany we also observe a very high prescription rate of problematic drugs, however, without corresponding numbers of ODs. The supervison of patients by their physicians is according to studies I have seen better, i.e. the health care system works better.
https://www.theguardian.com/us-news/ng-interactive/2018/nov/29/usdrug-overdose-epidemic-opioids-crisis-getting-worse
Greetings from Graz!
Olaf Kunert