As I mentioned to Robert VerBruggen in his latest piece on educational attainment and income, I do not believe that economic concerns are a major cause of differences in education attainment rates by income.

I previously analyzed this and related issues using the ELS:2002 data, but I decided to extend my analysis with NLSY97 and clarify my views, now that I have marshaled a fair amount of data to support my arguments.
First
Although the IQ (ASVAB) is an excellent predictor and generally mediates these differences fairly well, there are other systematic differences that are not fully accounted for when you control for IQ. High SES people, whether measured by income or educational attainment, typically have higher GPAs even with the same test scores.


(these differences would likely to be larger still if I did this as a composite SES index using education, income, occupational prestige, etc)
Second
High SES people are more likely to attend relatively competitive high schools where their (average) course loads are larger and the grading standards are higher. This stands to reason given the different average ability between different communities and relative minimal differences in average GPA, but it can also be observed in the data.

(The cohort of low-income students is the fraction that actually went to college, who are probably better prepared and more motivated than their average HS class mate. It’s somewhat of a range restriction issue. The real-world, population-wide, difference is probably considerably larger than this)
Third
Although the SAT and ASVAB are strongly correlated (r=~0.86) and predict similar outcomes for most groups, those relationships are not exactly the same for all groups at all points in the score distribution. 

(this should read 1997, not 2007 🙂
Some of this is probably regression towards the mean, some of this is apt to be the cumulative effect of differences in studying rates and motivation (independent of school “quality”), and some of this is probably due to some differences in the the competitiveness of the schools people attend (which would be less of an issue if we had more and better academic tracking).
Fourth
If we control for ASVAB, HS GPA, and HS graduation status in a simple linear model we can close much of this gap.


(You might also notice that the parent education gap is much larger than the parent income gap above!)
Fifth
Even if we just control for SAT scores, the differences are quite small.


It’s clearly a better predictor than ASVAB alone. Some of that is apt to be varying levels of interest (people that aren’t even interested in college aren’t likely to sit for the SAT at all), but that goes to my point (it’s not all economics).
Sixth
If we improve the model using SAT, HS GPA, and HS graduation status (which is pretty similar to the primary criteria schools make admissions decisions with), the differences shrink further still.


Seventh
There are differences in propensity to even sit for the SAT in the first place.


If we combine IQ and HS GPA together (mainly) these differences largely shrink through…


Or in linear mode to smooth out the random noise a bit…


(again, you might notice that the education delta is much larger than the income delta)
Eighth
There are clear differences in college aspirations by SES, even when you control for GPA or test scores.


Ninth
As with differences between other groups, some of this is apt to be cultural.


Tenth
If we control directly for several key factors that we know matter, specifically race/ethnicity, sex, and the parents education level, the difference is smaller still.


(r=0.63 for this model)
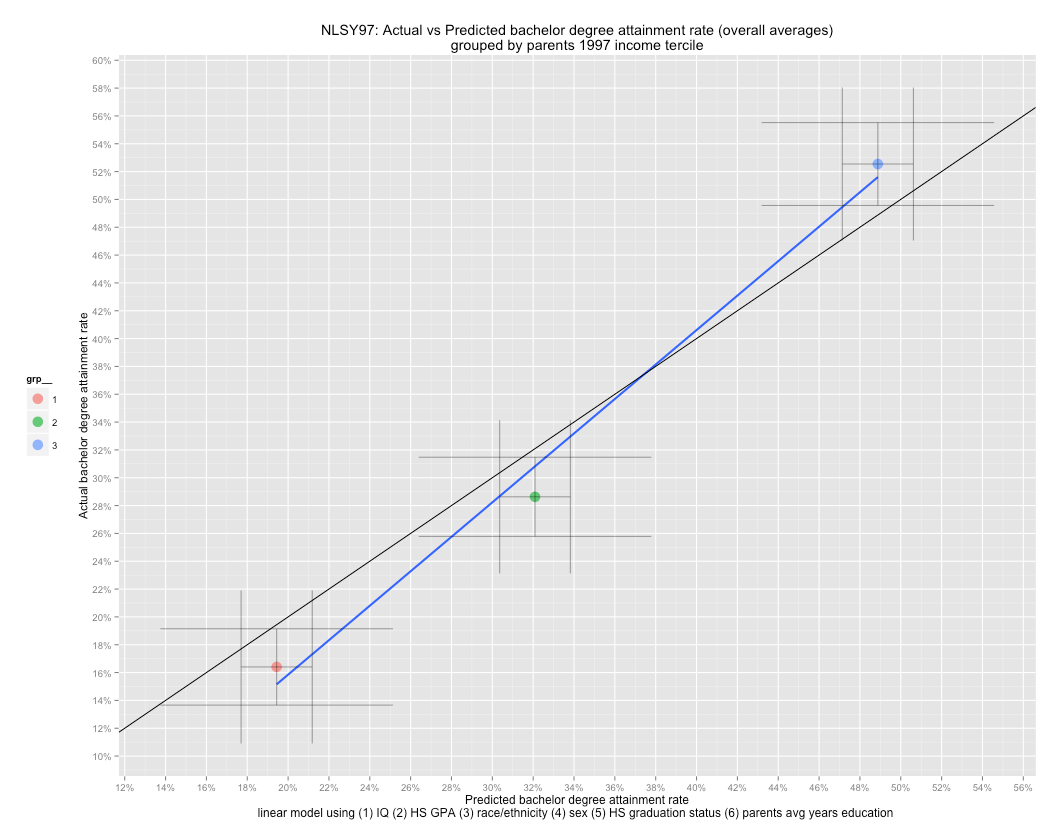
(Assuming the actual relationships are strictly linear throughout the entire distribution, this might be a better way of dealing with outliers/regression toward the mean)
Long story short, the maximum percentage point difference potentially attributable to income differences, holding other things roughly equal, is probably 7% or less, possibly quite a bit less. That difference may not even be mostly economic concerns as income is also correlated with other important characteristics like actual college readiness differences (imperfect GPA comparisons), parental ability (which is relevant due to measurement error of juvenile IQ, in particular, and imperfect correlations with future ability), educational priorities, etc that aren’t perfectly controlled with parental education either [as in, a bachelors in elementary education and a BSEE have the same degree for these purposes, but the BSEE on average will be significantly more intelligent, better educated, and earn more. The reason why the BSEE’s children are likely to perform better on average isn’t necessarily attributable to income…].
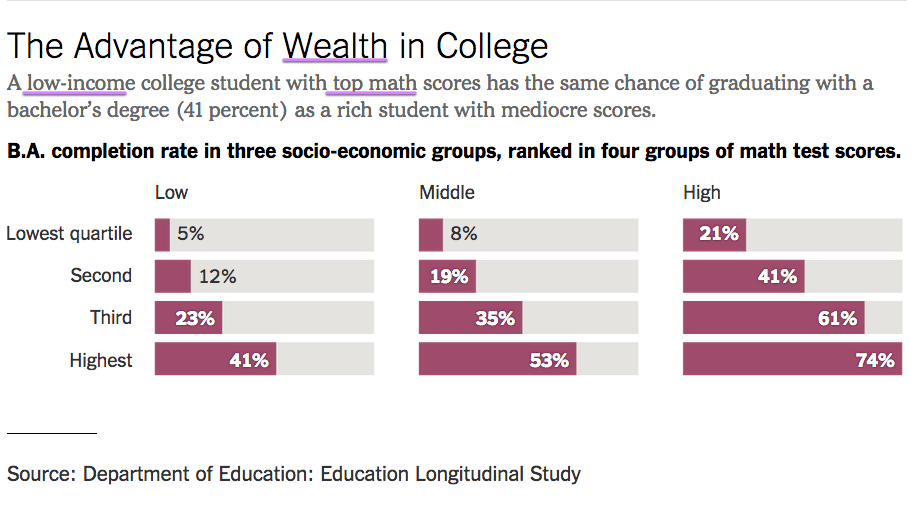
The best predictors of educational attainment are clearly, by far, cognitive ability and high school GPA, followed distantly by parental educational attainment and race/ethnicity (and probably good direct measurements of interest in pursuing higher ed). Poor high IQ students with top grades actually attend college at very similar rates as high income students with similar stats. Rich but low IQ students with marginal grades have similarly lousy educational attainment as their poor counterparts. The differences in average educational attainment rates between income groups is mostly attributable to large average differences in IQ/test scores, HS GPA, and the like.
That reality is a far cry from the argument in the NYTimes that the actual cause of differences between groups can almost entirely be attributed to economic concerns (never mind that their groups here are actually SES index groups, not merely income, as in, it includes and is heavily weighted towards parents education levels and their occupational categories/prestige…).
I do not believe these differences are entirely genetic, although that is clearly a large part of it.


However, just because parents/family background probably also “matters” for some environmental reasons does not mean that that is caused by economic considerations, school “quality” (especially not in the exogenous sense), and the like or that we can readily mitigate these differences through any kind of feasible policy prescription. Some groups clearly put a much greater emphasis on education than others, but these differences don’t just magically appear in 12th grade. The differences run deeper and start much much earlier. They can be found in K-12 GPA, average course loads, discipline, classroom behavior, etc. Without actually addressing those underlying issues simply engaging in more efforts to send yet more people to college starting in 12th grade, where many people today fail out already or graduate with little, to nothing, to show for it, isn’t apt to do much to close these gaps and will likely just waste time and resources.
I’m confused by your approach. You control for IQ and shows that income makes very little difference beyond that. But is it not the case that income matters because it can purchase access to enrichment activities that increase IQ? Even Charles Murray acknowledges that income plays some meaningful role here: http://www.wsj.com/articles/charles-murray-why-the-sat-isnt-a-student-affluence-test-1427238664
I’m not arguing that it makes absolutely no difference whatsoever, but that: (1) the residual associated with income is quite small (2) that effect is likely concentrated at the very bottom of the (post-tax, post-transfer) income distribution (3) it’s likely that that much residual effect is likely a spurious relationship….
Parental income is *also* associated with greater parental education, higher marriage/lower divorce rates, greater emphasis on education, etc in ways that are likely not causative. [Which is not to say that this is “fair” in a metaphysical sense, but that the parents’ economic means are a very small piece of this puzzle–genetics, culture, parent education, family idiosyncratic differences etc drive most of this].
Murray’s analysis and arguments are generally consistent with mine:
Keep in mind that I *not* arguing it is entirely genetic or that even the genetic effects are purely through IQ (there are other heritable traits that are weakly-to-moderately correlated with IQ but that effect education levels and the like). Also, Murray only has access to the mother’s IQ score, not the fathers. It’s highly likely that, holding maternal IQ equal, higher income implies a higher IQ father too (not to mention higher education, etc etc… as in, unmeasured genetic, culture, and other differences associated with the extra income).
Btw-you might want to take a look at this quantitive genetic study on educational attainment (GCSE scores in the UK)…
http://www.pnas.org/content/111/42/15273.full.pdf
(Heritability of educational attainment is high and IQ only accounts for about half of it)
***
If income per se causes these observed differences, we should expect exogenous wealth transfers to boost scores substantially. We generally don’t find this in practice in the first world.
https://ideas.repec.org/p/hhs/iuiwop/1060.html
(Study of Swedish lottery winners w/ ~0 change in child cognitive measures)
Very interesting. I would honestly like to see a comprehensive large scale study that measures all of the different traits of both parents, all of the different traits of the child, the income over time, the consumption over time, the specific level of education (as in selectivity of the college, performance in college, number of years in college for dropouts), and much more. This would be a fair way to settle the debate where both sides could feel reasonably confident about the truth. At the same time, I realize that this is not likely to happen because of logistical difficulties. On your point about income, here is a White House fact sheet that cites a large number of studies that look at staggered roll out of welfare programs to conclude that there is a benefit to children from transfers. Thoughts on this? https://www.whitehouse.gov/blog/2015/05/11/six-examples-long-term-benefits-anti-poverty-programs